A novel image segmentation approach for wood plate surface defect classification through convex optimization
Zhanyuan Chang•Jun Cao•Yizhuo Zhang
Abstract Detection of wood plate surface defects using image processing is a complicated problem in the forest industry as the image of the wood surface contains different kinds of defects.In order to obtain complete defect images,we used convex optimization(CO)with different weights as a pretreatment method for smoothing and the Otsu segmentation method to obtain the target defect area images.Structural similarity(SSIM)results between original image and defect image were calculated to evaluate the performance of segmentation with different convex optimization weights.The geometric and intensity features of defects were extracted before constructing a classification and regression tree(CART)classifier.The average accuracy of the classifier is 94.1%with four types of defects on Xylosma congestum wood plate surface:pinhole,crack,live knot and dead knot.Experimental results showed that CO can save the edge of target defects maximally,SSIM can select the appropriate weight for CO,and the CART classifier appears to have the advantages of good adaptability and high classification accuracy.
Keywords Convex optimization·Threshold segmentation·Structure similarity·Decision tree·Defect recognition
Introduction
Surface detection of a product is a significant step in industrial production.The result and accuracy of the detection affect the quality of the product directly.In forest products production,wood plate surface defect detection is a key step,including defect image segmentation,feature extraction and defect recognition(Barszcz et al.2014;Yuan et al.2016).
Gray level co-occurrence matrix(GLCM)is de fined over an image as the distribution of co-occurring pixel values and is widely used in wood surface detection as a basic method for theoretical support(Hu et al.2011).Wang et al.(2015)proposed a method to detect wood surface quality and to classify wood samples using GLCM texture features extracted from surface images.This approach used more pixel information than the traditional four-angle method and resulted in high classification accuracy.However,the GLCM contains all texture information of the image and the information not required.In order to identify wood plate surface defects,Zhang et al.(2016)extracted three-level dual-tree complex wavelet decompositions from the plate image and obtained a 40-dimensional feature vector.They used particle swarm optimization(PSO)algorithm for feature selection and dimension reduction.Results showed that the direction property of dual-tree complex wavelet can express the complex information on wood plate surface and the compressed sensing classifier is effective.However,the wavelet decomposition method produces a large amount of redundant information and is not readable facing objective classification problems with immeasurable information like defect.Using edge detection techniques and threshold detection methods to get defect area information is efficient to minimize the time of identification of defects.With a good classification method,the detection process is quick and the defect identification rate significantly improves(Santiago et al.2012).Castellani and Rowlands(2009)designed a Multi-Layer Perceptron classifier for wood veneer defects from statistical features of wood sub-images.They used the Taguchi method to optimize the neural network classifier and backpropagation rule to train the connection weights.Experimental tests showed that the classifier produces highly compact neural network structures capable of accurate and robust learning.Zhang et al.(2014)used morphological reconstruction with R component from RGB image to construct a novel flaw segmentation method.With two template images for low and high thresholds for seed optimization and inflation,geodesic inflection was applied by the high threshold template to recognize rapid growth of the flaw area in the floor plate for margin optimization.This method produced accurate defect segmentation rapidly and accurately.It shows that threshold segmentation based on clear target defect edges is efficient and easy for subsequent image processing and classification.
The convex optimization(CO)method is effectively proposed to avoid getting into the local extremum(Baják and Páles 2009).It is also a very complete and quick method to count optimal solutions(Bouhamidi et al.2014).With CO as the pretreatment approach,defect target area images can filter out noise and maintain a clear edge of the defect for segmentation using Otsu algorithm(Dirami et al.2013;Han et al.2016).The SSIM method calculates the degree of similarity between two reference images from the viewpoint of the brightness,contrast and structure,and can be used as an objective evaluation method for image segmentation(Bhateja et al.2014).For the optimal classification algorithm,the CART classifier has the advantages of a simple structure,rapid classification,effectiveness,and strong applicability.It is a readable robust classifier and contains immeasurable information like defect or color.Based on the above methods,we are going to design a novel classification system for the recognition of four types of wood plate surface defects(pinhole,crack,live knot and dead knot).
Materials and methods
Four types of defects,pinhole,crack,live knot and dead knot were selected on X.congestum wood plates.Each type of defect had 80 samples for a total of 320 samples.The samples were dried,polished and cut to a standard size of 15 cm×15 cm×1.5 cm.Sample image acquisition used a F810CIRF Oscar company camera,lens type was M0814-MPFA.Light source was a double row parallel LED light.Image acquisition size was set to 256×256 pixels and the image processing computer had Intel Core i3-3240 CPU,3.40 GHz main frequency,4.00 GB RAM.The image processing software was Matlab 7.11.0(R2010b).Some of the acquisition results are shown in Fig.1.
As the testing samples were choose,we planned to use CO for smoothing as pretreatment then choose Otsu segmentation algorithm to get the defect target area image.Then,we calculated the SSIM between defect image and original image to evaluate the CO weights and the segmentation results.We counted the geometrical and intensity features of defect from target image then built up classifier based on CART method to finish the classification method.
Convex optimization
The CO method is a mathematical optimization containing least square(LS)and linear programs(LP).It has the advantage that a local solution is also the global optimal solution of convex optimization.Therefore,it can effectively avoid initialization algorithms,local extremum and step length selection problems,and is a highly efficient numerical method.For the real number set R,n dimensional Euclidean space Rn,CO can be de fined as:

In this definition,x ∈Rnis a control variable,f0(x):Rn→R is the objective function,fi(x):Rn→ R is the inequality constraint function and hi(x):Rn→ R the equality constraint function.
As the objective function f0(x)and constraint functionis the convex function,the affine function,and the convex optimization problem may be de fined as:


Fig.1 Part of the image acquisition results:a pinhole,b crack,c live knot,d dead knot
Image smoothing
After the image acquisition,we provided a CO function as pretreatment for the captured image for smoothing and denoising:

Image segmentation
The Otsu algorithm is an efficient image segmentation method for binaryzation.The algorithm describes image containing two classes of pixels following a bi-modal histogram,foreground pixels and back ground pixels.We can separate them accurately by seeking the optimal threshold value,so that their intra-class variance is minimal,or equivalently and their inter-class variance is maximal. Otsu algorithm exhibits a relatively good performance for the histogram and can be assumed to have a bimodal distribution and to possess a deep,sharp valley between two peaks.However,Otsu has the same limitations as all other global threshold techniques,small mean differences,large variances of object,background intensities,and the large amount of added noise.These limitations make the Otsu algorithm very sensitive to noise and it has a better segmentation result with the image after smoothing then the image without any pretreatment.
Structure similarity
SSIM is a full-reference,image quality evaluation index which can recognize the similarity between two images from brightness,contrast and structure.The SSIM value of the images and their similarity are positively correlated.For image X and Y:

In the functions,C1C2C3are constants where C1=(K1·S)2,μXand μYare means of X and Y,rXand rYvariances of X and Y,rXYcovariance of X and Y,

Related formulas for the parameters of Y are the same as the above.With all the parameters,here is the definition of SSIM.

Using a sliding window to cut the image into N blocks,and considering the window shape.Gaussian weighting is used to calculate the mean value,variance,covariance and SSIM of each window.After this,the corresponding structure similarity of the two images,de fined as mean structure similarity(MSSIM)is:

CART classifier
The Decision Tree classification method(DT)is a common and readable pattern recognition approach to solve decision and classification problems by asking a series of related questions.DT method has several advantages as it is simple to understand and interpret with a brief explanation and the insights can be generated by experts,it is convenient to handle both numerical and categorical data with good robustness.The method also performs well with large datasets.The classification and regression tree method(CART)is a non-parametric decision-tree learning technique illustrating classification,depending on whether the dependent variable is categorical or numeric.CART is a binary tree and the root node is located in the top connected to the other nodes through the branches until there are no subsequent branches or terminal leaf nodes.The construction process of CART has two steps:
1. Building
(a) Check each node of the tree to choose the best point of division,to test each prediction and all possible points of division;
(b) Build two child nodes;
(c) Establish the relationship between child nodes and sample points;and,
(d) Repeat the above processes until the stop criteria.
2. Pruning
(a) Build up the cross-validation trees;
(b) Calculate the cross validated misclassification of each tree;and,
(c) Prune the trees in 1)into the optimal size.
Results and discussion
Convex optimization threshold segmentation
To test the smoothing and denoising performance of convex optimization,we added the original image with white noise.Results of CO with different weights are in Fig.2.
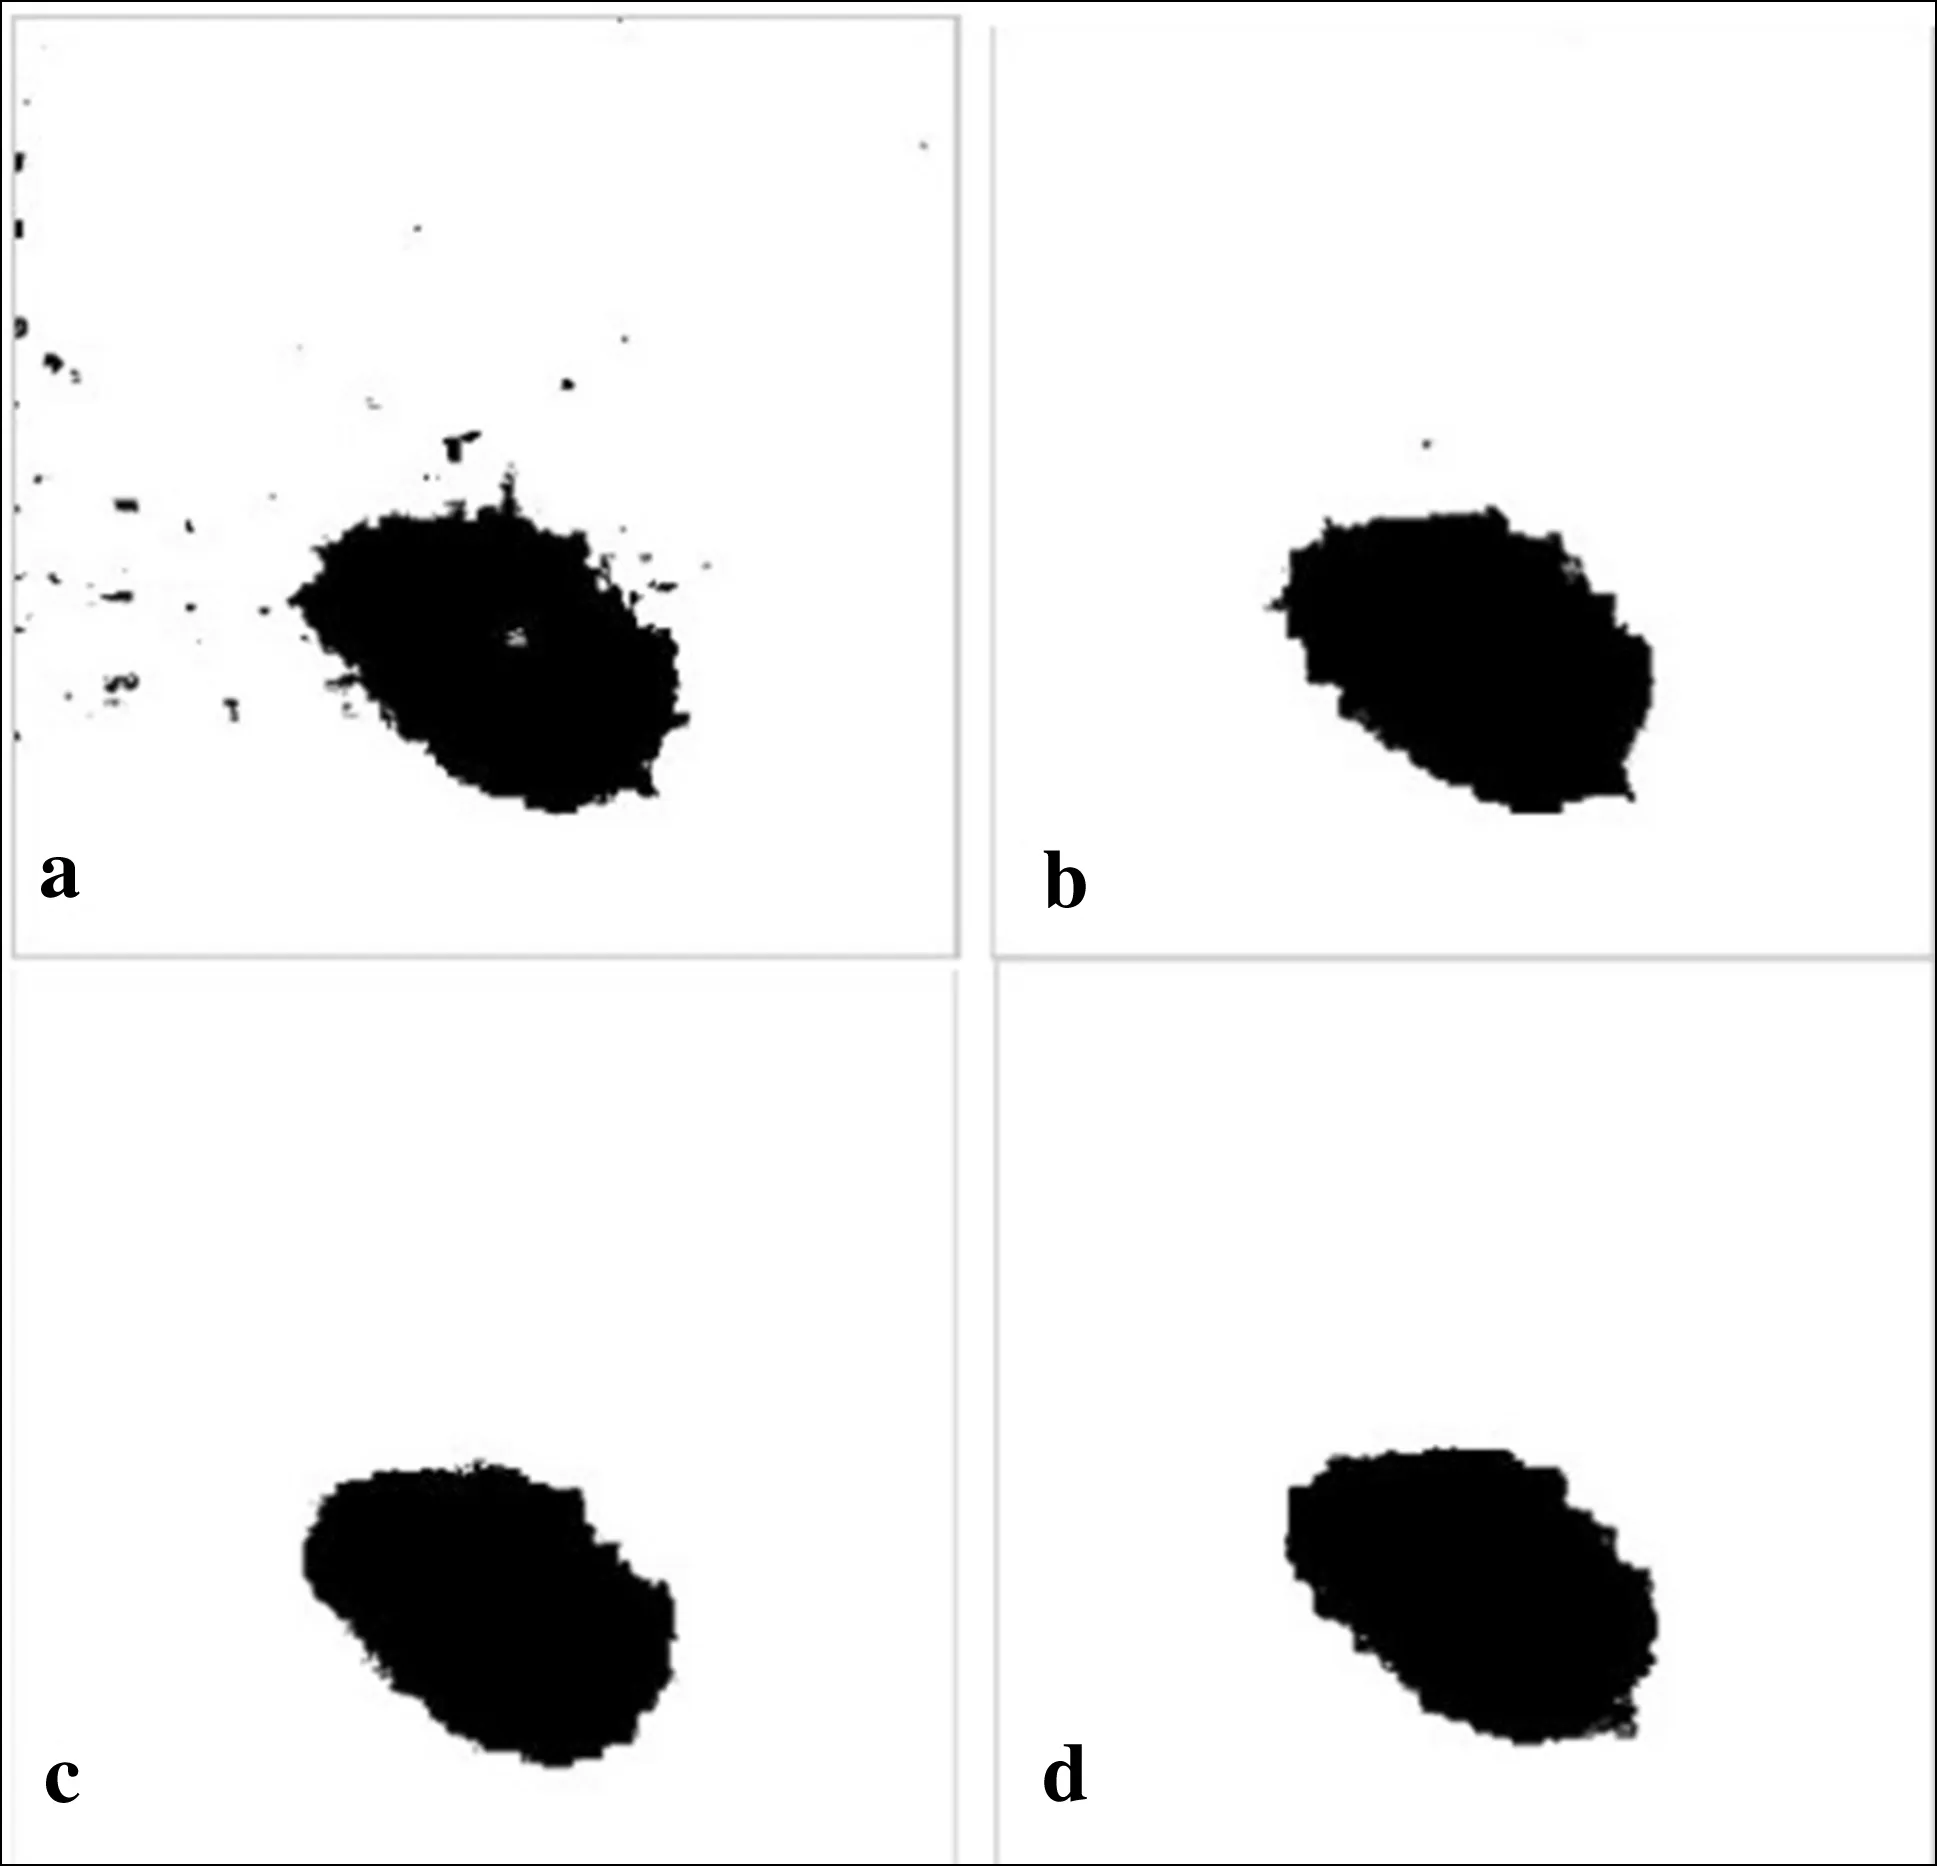
The CO function used L1-norm to adjust the smoothness of the image and filter the white noise as well as to keep the edge maximal.As the results in Fig.2 illustrate,when the weight is 0.02,denoising process is not finished.When the weight is 0.04,denoising is finished and the result keeps the edge of defect area completely.With a weight values of 0.06,the edge of the defect area is unclear and is much different from the original image.After CO,we used Otsu threshold segmentation to separate the defect area from the background(Fig.3).As the effects of segmentation with different weights are difficult to determine by subjective sense,we used the objective SSIM method to determine which weight is better than the others.
SSIM evaluation
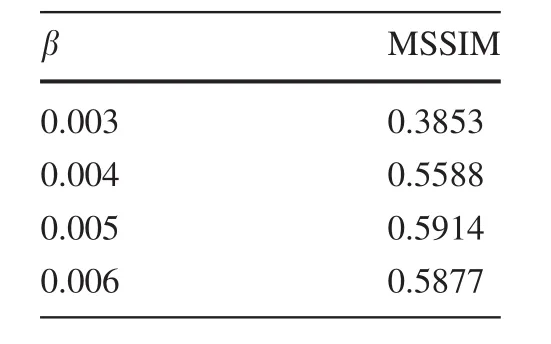
MSSIM values with different weights were calculated to evaluate the performance of each weight in CO segmentation.The segmentation results were added to the original image to get a new defect target area image.The MSSIN was calculated between the defect image and the original one and shows that when the weight values is 0.005,the image segmentation effect is better than the other weights(Table 1).
Feature extraction
The defect geometrical characteristics were defect area,defect perimeter,defect external rectangular aspect ratio,determined by:

In the functions,M are the pixels which equal 1,E represent the pixels of the defect edge,L and R are the length and width of the defect,Lmax,Lmin,Rmax,Rminare the maximum and minimum line,and maximum and minimum row of the defect.With the parameters,there are three geometrical features:the defect area S,defect perimeter C,and the defect external rectangular aspect ratio LRr.
Following this,the intensity features of defect for feature extraction are determined.The transformation functions change the RGB images into CIE Lab images when both color space belong to[0,255].

In the transformation,L is the brightness information and L∈[0,100],a is the transformation from red to green and a∈[-128,127],b is the transformation from yellow to blue and b∈[-128,127].After the Lab parameters of the image are obtained,the first and the second moment of L are calculated.

Fig.2 Results of convex optimization with different weights:a original image,b original added white noise,c β =0.003,d β =0.004,e β =0.005,f β =0.006

Fig.3 Results of defects egmentation with different weights:a β =0.003,b β =0.004,c β =0.005,d β =0.006

Table 1 MSSIM results with different weights

pi,jrepresents the possibility of the existence of pixels with the gray value j in the i component of the color channel in a color image containing N pixels.
CART classifier
Forty images of each defect were used as the test set to build up the CART classifier.After pruning and calculation of the cross validated misclassification of each tree,there was the minimum misclassification error with 6 knots and 3 layers.The structure of the CART classifier is shown in Fig.4.

Fig.4 Structure of the decision tree classifier

Table 2 Average accuracies of classifiers with different weights
After the process of CO smoothing to the image,the Otsu threshold segmentation was used to cut off the target area of defect on the wood plate surface.Using the formulas above(12–19)to calculate the features of defect,the five dimension features were input into the CART classifier.
Defect recognition
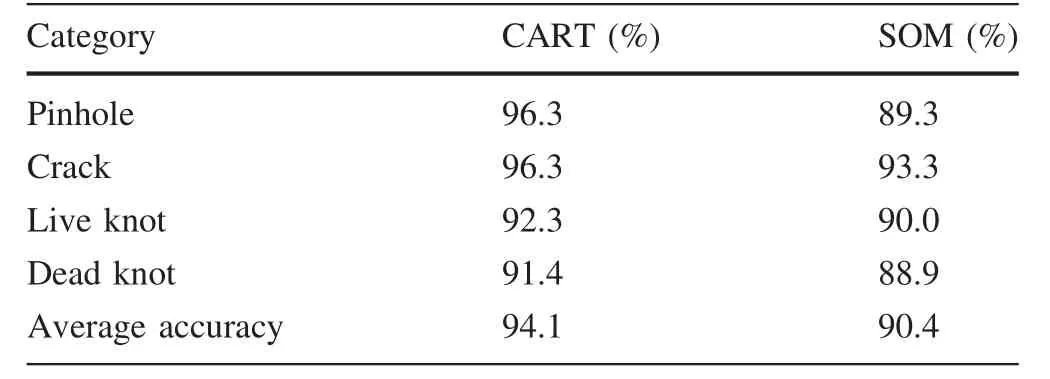
The classification accuracy of the CART classifier was tested with different convex optimization weights to see the effects of SSIM evaluation.The weights were 0.004,0.005,0.006 and the results in Table 2 show that the 0.005 weight had 93.8%higher accuracy than other weights(Table 2).Classification results of the CART classifier are in Table 3 and shows that it is more effective in crack and pinhole recognition with an accuracy of 96.3%for both.Matlab Neural Network Toolbox was used to build up another SOM classifier to test the performance of the CART classifier.Comparable classification results betweenthe CART classifier and the SOM neural network classifier(Table 4)show that the CART classifier had higher classification accuracies with all four types of defect.The SOM neural network classifier also needs to adjust parameters and structure to improve performance but the CART classifier does not require any retraining.

Table 3 Results of CART classifier for 4 kinds of defect

Table 4 Comparable accuracy results of 4 kinds of defects between DT and SOM

Conclusions
An effective defect recognition method was developed using convex optimization for smoothing.With this as pretreatment,the Otsu segmentation algorithm was used to get the defect target area image.Calculation of the results of the structure similarities between defect image and original image objectively helped to select convex optimization weights.Finally, five dimension features were extracted from the defect image and inputted into the CART classifier to finish the classification.The results show that Otsu segmentation algorithm based on convex optimization has a good segmentation performance to keep the defect edge.The SSIM method can evaluate segmentation objectively,and the CART classifier has the accuracy of 94.1%with pinhole,crack,live knot and dead knot defects.The classifier also has advantages of simple structure,good robustness and readability.
 Journal of Forestry Research2018年6期
- Journal of Forestry Research的其它文章
- Temperature characteristics of wood during microwave treatments
- Tin-based metal bath heat treatment:an efficient and recyclable green approach for Pinus massoniana wood modification
- Decay resistance and dimensional stability improvement of wood by low melting point alloy heat treatment
- Ectomycorrhizal fungus enhances drought tolerance of Pinus sylvestris var.mongolica seedlings and improves soil condition
- First report of leaf-spot disease caused by Sphaeropsis visci on Asian mistletoe[Viscum coloratum(Kom.)Nakai]in China
- Wild grapevine(Vitis vinifera subsp.sylvestris)in the Hyrcanian relict forests of northern Iran:an overview of current taxonomy,ecology and palaeorecords
