
Alternate row mulching optimizes soil temperature and water conditions and improves wheat yield in dryland farming
2018-11-06 08:19:18YANQiuyanDONGFeiLOUGeYANGFengLUJinxiuLIFengZHANGJianchengLIJunhuiDUANZengqiang
Journal of Integrative Agriculture 2018年11期
YAN Qiu-yan, DONG Fei, LOU Ge, YANG Feng, LU Jin-xiu, LI Feng, ZHANG Jian-cheng, LI Junhui, DUAN Zeng-qiang
1 Institute of Wheat Research, Shanxi Academy of Agricultural Sciences, Linfen 041000, P.R.China
2 Department of Earth and Environmental Engineering, Columbia University, New York 10027, USA
3 Department of Earth System Science, University of California, Irvine 92697, USA
4 State Key Laboratory of Soil and Sustainable Agriculture, Institute of Soil Science, Chinese Academy of Sciences, Nanjing 210008, P.R.China
Abstract Straw mulching allows for effective water storage in dryland wheat production. Finding a suitable straw mulching model that facilitates wheat growth was the objective of this study. A 2-year field experiment was conducted to investigate the effects of two straw mulching patterns (FM, full coverage within all the rows; HM, half coverage within alternate rows) and two mulching rates (4.5 and 9.0 t ha-1) on soil moisture, soil temperature, grain yield, and water use efficiency (WUE) of winter wheat in northern China, with no mulching (M0) as the control. Results showed that mulching increased the soil water storage in all growth stages under high mulching rates, with a stronger effect in later growth stages. Water storage under the HM model was greater in later stages than under the FM model. Soil water content of HM groups was higher than that of FM groups,especially in surface soil layers. Evapotranspiration decreased in mulched groups and was higher under high mulching rates. Aboveground biomass during each growth stage under the HM model was higher than that under M0 and FM models with the same mulched rate, leading to a relatively higher grain yield under the HM model. Mulching increased WUE, a trend that was more obvious under HM9.0 treatment. Warming effect of soil temperature under the HM pattern persisted longer than under the FM model with the same mulching rates. Accumulated soil temperature under mulched treatments increased, and the period of negative soil temperature decreased by 9-12 days under FM and by 10-20 days under HM.Thus, the HM pattern with 9.0 t ha-1 mulching rate is beneficial for both soil temperature and water content management and can contribute to high yields and high WUE for wheat production in China.
Keywords: mulching pattern, winter wheat, soil temperature, grain yield, water use efficiency
1. Introduction
Drought is the main factor that restricts the high yield of wheat in dryland systems in northern China (Deng et al.2010). Water consumption during the growing period is 2-3 times the rainfall amount of the same period, which often causes seasonal drought (Liu et al. 2015). Maintaining effective preservation and use of natural rainfall is a key solution to improving winter wheat production and water use efficiency in this region (Chen et al. 2007; Li et al. 2008;Ali et al. 2016).
Straw mulching, as a water-saving technique, is widely used on many crops, not only to reduce soil evaporation,but also to increase rainwater infiltration, thereby increasing soil water storage capacity (Chakraborty et al. 2010; Deper et al. 2014). Mulching winter wheat with maize straw between rows has been extensively studied (Huang et al.2005; Stagnari et al. 2014; Zhang P et al. 2015). Despite ideal soil water conditions under mulch, the effect of straw mulching on the yield of winter wheat is not stable due to a risk of yield reduction (Zhang et al. 2009; Chen et al.2011). For instance, physical barriers caused by mulching materials might influence photosynthesis and disturb the growth of wheat, especially in the re-greening period (Gupta et al. 2016). Additionally, Chen et al. (2015) determined that lower spike numbers under excess mulching was the main reason for yield loss. Yang et al. (2006) found that soil temperature caused by straw mulching in the re-greening stage can delay seedling emergence and freeze roots of winter wheat, which in turn influences crop growth, and even decreases winter wheat yield.
Considering the high level of water retention from straw mulching, finding a suitable straw mulching model for increasing winter wheat yield was the focus of this study.Planting patterns under mulching must be modulated accordingly, as the population structure of winter wheat could also significantly affect ventilation and light availability in farmland. Reasonable population structure is an important foundation for high-yielding wheat (Wajid et al. 2004).Separate mulching and planting zone had been focused on by some studies, such as a banding planting method with a planting width from 20 to 60 cm and a blank row for mulching (Wang et al. 2015). A wide-precision planting and mulching model was proposed by Liu et al. (2015).From an ecological viewpoint, blank-row planting reduces the density of the unit area, thus weakening competition among individual crop plants. The crop thus occupies more ecological niches, and use of ecological resources such as water and nutrients is reorganized, showing an obvious edge advantage (Wang et al. 2015). Decreasing mulching areas using an interlacing mulching pattern in wheat was also reported by Zhang J P et al. (2015). It is critical to have a better understanding of the impacts of different straw mulching models on soil activities and wheat growth.Further studies including suitable mulching rates and plant response are required.
In the study, we hypothesized that half coverage within alternate rows in wheat would decrease the mulching area,enabling crops to receive more solar energy and increasing coverage thickness, thus increasing soil water storage. We aimed to compensate for the drought that happens during the growing season and the low temperatures under straw mulching during the reviving stage (spring season), thereby increasing wheat yield. Therefore, the study focused on the influence of straw mulching on: (1) variation in soil temperature; (2) water storage capacity of soil; and (3)the growth parameters, yield and growth stage of wheat.The influence mechanism of different mulching models on the growth of winter wheat was explained, to provide theoretical and technical support for water conservation and yield improvement of winter wheat in dryland areas in northern China.
2. Materials and methods
2.1. Experimental site
The field experiment was conducted at an experimental station situated at 36°19´N and 111°49´E within Shanxi Province in northern China from 2013 to 2015. The climate of this area is characterized as semi-arid and semi-humid.The mean annual temperature was 11.3°C, and the frostfree period was 127-280 days. The long-term mean annual rainfall at the site was 420.1-550.6 mm (Chen et al. 2015).Fig. 1 shows that the rainfall received during the wheat season was 250.4 mm from 2013 to 2014 (wet) and 156.6 mm from 2014 to 2015 (dry).
The experimental field was calcareous cinnamon according to the FAO/UNESCO Soil classification (FAO and UNESCO 1993). The slope of experimental site was flat. The level of underground water of the study region was 35.5-70.3 m. The soil of the experimental site was alkaline(pH=8.13, soil:water=1:5, v/v), the electrical conductivity was 141.40 μS cm-1, the organic matter was 15.20 g kg-1,the total nitrogen was 1.28 g kg-1, the alkali-hydrolyzable N was 76.69 mg kg-1, the Olsen-P was 10.64 mg kg-1, and the available K was 117.0 mg kg-1. The soil was a moderately well drained loamy soil with a deep profile.
2.2. Experimental design and methods
The experiment was a randomized block with three replicates.The experiment was established in the same location and treatments were imposed on the same plots in both years.The experiment included five mulching patterns: M0 (no mulching), FM4.5 (full coverage within all rows at a rate of 4.5 t ha-1), FM9.0 (full coverage within all the rows at a rate of 9.0 t ha-1), HM4.5 (half coverage within alternate rows at a rate of 4.5 t ha-1) and HM9.0 (half coverage within alternate rows at a rate of 9.0 t ha-1). Each plot was 2.5 m wide and 10 m long. The high mulching rate was average straw yield per hectare (9.0 t ha-1) in northern China. The covering thickness of FM was 1-2 cm under FM4.5 and 3-4 cm under FM9.0; the thickness of HM was 2-4 cm higher than FM under the same mulched dose.
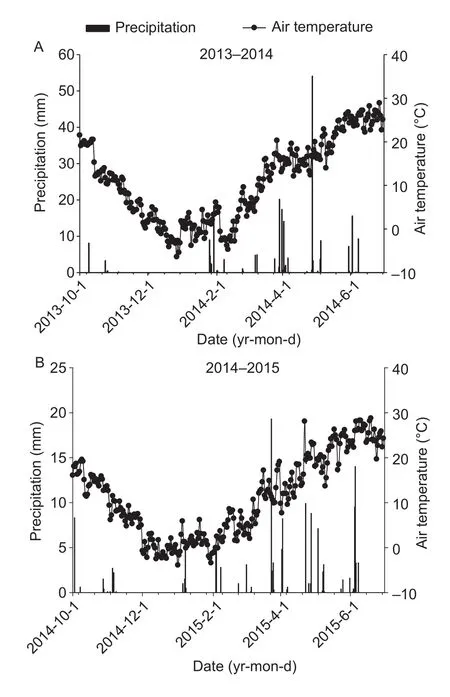
Fig. 1 Dynamics of precipitation and air temperature during the growth period of winter wheat from 2013 to 2014 (A) and from 2014 to 2015 (B).
Mechanically-harvested maize straw pieces sized 5-20 cm were manually applied as the surface mulch material between the rows during the 3-leaf stage. Winter wheat(cv. Linyuan 8) was sown at a seeding rate of 150 kg ha-1at a row spacing of 20 cm on October 8 and 10 in 2013 and 2014, respectively. N (in the form of urea) at 150 kg ha-1, P at 120 kg P2O5ha-1and K at 60 kg K2O ha-1were applied to the 15-20 cm soil layer 10 days before sowing. During both years of the experiment, no artificial irrigation was provided.Wheat was harvested on June 10, 2014 and June 12, 2015.
2.3. Measurements
Soil water content, water storage and water use efficiency (WUE)The content of soil water was determined in every plot in every growth stage of winter wheat using three random samples of soil with the usage of a 50-mm diameter steel score-sampling tube at 0-20, 20-40, 40-60,60-80, and 80-100 cm in every growth stage. The samples of soil were first weighed wet, then dried in an oven with a fan for 2 days at 105°C, and, finally, reweighed to determine the contents of soil water.
Soil water storage (mm) was calculated for a 100-cm profile by multiplying the mean soil volumetric water content by the soil profile depth (Zhou et al. 2011).

Where, W (mm) is the soil water storage; w (%) is the percentage of soil water content by weight; ρs (g cm-3)is the soil bulk density in each soil layer; and h is the soil layer depth. Soil water content was determined in each plot in each growth stage of winter wheat by taking three random soil core samples using a 50-mm diameter steel score-sampling tube, which was driven manually to depths of every 20 cm from 0 to 100 cm during each growth period.The soil samples were weighed wet, dried in a fan-assisted oven at 105°C for 48 h, and weighed again to determine the soil water content.
WUE (kg ha-1mm-1) was calculated as:

Where, Y is the grain yield of winter wheat (kg ha-1).Evapotranspiration (ET) was calculated using the below soilwater balance equation (Bolger and Turner 1999) as follows:

Where, ΔW (mm) is the change in the stored soil water for the soil profile (0-100 cm depth) between planting and harvest; P is the growing season rainfall (mm); I is the irrigation (mm); D is the drainage (mm); and R is the runoff(mm). Drainage was negligible in the plots because the tensiometers indicated there was no water movement from 120 to 200 cm. Furthermore, the irrigation amount in the experiment was small (approximately 120 mm). None of the plots had a deep soil profile or strong water-holding capacity (Zhou et al. 2011). Therefore, we modified the equation as follows:

Soil temperatureSoil temperature was recorded using an intelligent digital recorder (L93-4, Hangzhou Logger Technology Co., Ltd., China) with a measurement range of-40-100°C and a measurement accuracy of ±0.5°C and a resolution of 0.1°C. The recorder probe was placed in the row where the wheat was sown in each plot at the 20-cm soil layer after wheat seedling emergence. Soil temperature was recorded automatically every hour over whole growth period. The average 24-h temperature was used as the daily mean soil temperature, and multiplied by the average soil temperature during the growth stage and the days within the stage as the accumulated soil temperature (AST).
Grain yield and aboveground biomassTo determine the aboveground biomass, the number of emerged wheatseedlings in a 1-m row length was counted at two randomly selected places in each growth period. Roots were cut from the plants. Before weighing, the fresh shoots were carefully dried at 105°C for 30 min and then further dried at 80°C for 24 h. Grain yields were determined based on the actual yield in each plot after drying in the sun.
Statistical analysisAnalysis of variance (ANOVA) was performed using the general linear model univariate procedure from the SPSS ver. 17.0 Software based on the interaction of years and mulching level and the means were separated using Duncan’s multiple range test (DMRT) at the 5% level. SigmaPlot 12.0 was used for illustrations.
3. Results
3.1. Soil water content and water storage
Mulching improved soil water content at different levels compared with M0, and soil water content increased with the increase in mulching quantity under the same mulching pattern. At the same mulching quantity, the water content in the HM groups was slightly higher than that in the FM groups. Mulching influenced water content of the soil layer of 0-80 cm from the overwintering to jointing stage (Fig. 2).
In the tiller stage, soil water storage in the 0-100 cm soil layer under mulching groups was higher than that of no mulching treatment, especially under high rates of mulching(Fig. 3). In the overwintering stage, soil water storage under FM groups increased by 42.3 mm, and increased 35.5 mm under HM groups compared with M0. Soil water storage rates increased by 12.5 under FM groups and 20.7 mm under HM groups at the heading stage, and by 18.5 mm under FM groups and 11.8 mm under HM groups at the maturity stage. Soil water storage in the early and middle growth stages during 2014-2015 and was the same as in 2013-2014. At the maturity stage, soil water storage increased by 29.4 mm under FM groups and 48.7 mm under HM groups (Fig. 3).
3.2. Soil temperature
Daily mean soil temperature (ADST) at the different growth stagesThe ADST of all treatments had similar trends in the tillering stage and early overwintering stages;there was a higher ADST as the mulching quantity increased(Fig. 4-A and B). The warming effect under mulching was considerable in the early overwintering stage. In the late overwintering stage, compared with M0, high mulching rates (FM9.0 and HM9.0) retained higher soil temperature(Fig. 4-C). From the reviving to the standing stage, soil temperature showed large fluctuations. The ADSTs under the mulching treatments were higher than that under M0 before March, but, after March, the HM pattern showed a continuous warming effect, while the ADST of FM began to drop below the ADST of M0 (Fig. 4-D). However, with the soil temperature increasing gradually at the booting stage, the ADSTs under all mulching treatments were lower than under M0 (Fig. 4-E and F). The ADST between the treatments showed a shrink-magnify-shrink-magnify-shrink trend with the wheat growth stages (Fig. 4).
Daily maximum and minimum of soil temperatureThe daily maximum soil temperature under mulching was higher than that of M0 before the reviving stage with decreasing soil temperature (from November to February), but it dropped to lower than that of M0 after the reviving stage (from March to June) with increasing soil temperature (Fig. 5-A). The daily minimum soil temperature under mulching was mostly higher than the negative soil temperature under M0 (Fig. 5-B).
Accumulated soil temperature (AST)When soil temperature was decreasing (from November to early February), ASTs under mulched groups were higher than that in M0, with AST under higher mulching rates obtaining higher values. In the reviving stage, the AST of FM was lower than that in M0, whereas the AST of HM was still higher than that in M0. From the jointing to maturity stage,the ASTs of mulched groups were slightly lower than that of M0 (Table 1). Mulching effects on soil temperature had almost no significant difference between years. However,there was a significant difference within mulching patterns.The interaction effect between years and mulching patterns was mainly found in the early wheat growing stage (Table 1).
The average temperature of winter (<0°C) and the negative accumulated temperature under mulch were both higher than that of M0 (Table 2). The starting date of the negative temperature under the mulching treatment was later than that under M0 (4-13 days later in 2013-2014 and 5-10 days later in 2014-2015), while the ending date of the negative temperature under mulching treatments was the same or slightly earlier than that in M0 (0-6 days earlier in 2013-2014 and 1-6 days earlier in 2014-2015). Thus,the duration of negative temperature under the mulching treatments was 4-20 days fewer in 2013-2014 and 5-21 days fewer in 2014-2015 compared to M0 (Table 2).
3.3. Grain yield and biomass
Straw mulching increased wheat grain yields in both years(13.1-25.1% in 2013-2014 and 15.4-34.8% in 2014-2015)compared with M0 (Table 3). A bigger yield increase was found under the HM pattern in both years. The positive effect on yield production brought by the mulching treatment was clearer in the drier year (2014-2015). Dry matter accumulation under straw mulch was significantly greater than that under M0 in all five growth stages, showing a significantly positive correlation with grain yields (Table 3).
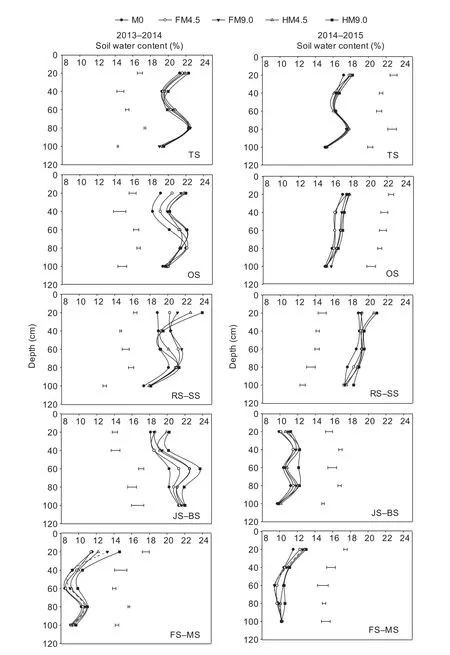
Fig. 2 Soil water content affected by mulching pattern and amount during different growth stages in 2013-2014 and 2014-2015.TS, tillering stage; OS, overwintering stage; RS-SS, reviving to standing stage; JS-BS, jointing to booting stage; FS-MS, filling to maturity stage. M0 stands for no mulching; FM4.5 and FM9.0 stand for full coverage within all rows at a rate of 4.5 and 9.0 t ha-1,respectively; HM4.5 and HM9.0 stand for half coverage within alternate rows at a rate of 4.5 and 9.0 t ha-1, respectively. Bars indicate the LSD0.05 values.

Fig. 3 Soil water storage in 0-100 cm soil layer under different treatments during 2013-2014 (A) and 2014-2015 (B). M0 stands for no mulching; FM4.5 and FM9.0 stand for full coverage within all rows at a rate of 4.5 and 9.0 t ha-1, respectively; HM4.5 and HM9.0 stand for half coverage within alternate rows at a rate of 4.5 and 9.0 t ha-1, respectively. Bars indicate the LSD0.05 values.
3.4. Evapotranspirstion and water use efficiency
ET under the mulching treatments was less (mean 59.8 mm in 2013-2014 and 61.1 mm in 2014-2015) than that under M0 in both years. With the same mulching quantity, there was more ET under the HM pattern than under FM. Higher WUE was obtained in mulching groups (mean 28.4% in 2013-2014 and 26.4% in 2014-2015) compared with M0. ET had no significant correlation with yield, while a significantly positive correlation was found between yield and WUE in both years (Table 4).
3.5. Correlations between soil temperature and aboveground biomass and yield in different growth stages
The correlation analysis between soil temperature at different growth stages and three factors (i.e., aboveground biomass, water content and yield) is presented in Table 5.Soil temperatures of the five stages had a non-significant correlation with aboveground biomass. The soil water content showed a significantly (P<0.01) positive correlation with soil temperature in the early stages (the tillering stage and the reviving to standing stages), but no significant correlation was observed with the other stages. Yield was significantly (P<0.05) positively correlated with soil temperature in the overwintering stage, while there were no significant correlations with the other stages. The correlation between yield and water content was more significant in the tillering stage and the reviving to standing stages, but was not significant in the other stages.
4. Discussion
4.1. Soil water storage and rainfall
The production of dryland wheat and economic income depends mainly on the rainfall and the distribution of rainfall at different growth stages (Sun et al. 2010). The degree of rainfall infiltration and soil water evaporation differs according to straw mulching rates and the soil waterholding capacity differs with mulching model (Zhang J P et al. 2015). In the present study, the two growing seasons were similar between December and January when there was a small amount of rainfall that caused drought, leading to significant insufficiency of water storage in soil. Higher water storage occurred during the tiller stage of wheat.According to Balwinder-Singh et al. (2016), mulch appeared to be more effective in reducing soil evaporation earlier in the season when evapotranspiration and leaf area were low.Regardless of the rainfall rate in different growth stages,the water storage status improved to varying degrees with the straw mulch treatments compared with no mulching treatment. During the fallow season, decreased soil water storage was due to the greater evapotranspiration of plants(Zhang J P et al. 2015). There is lower water content in later stages, which could be due to a stronger effect of mulching on soil water storage compared to no mulching plots, similar to the results of Chen et al. (2007). To some extent, mulching can change the soil water distribution from deep to surface soil layers (Yang et al. 2006).
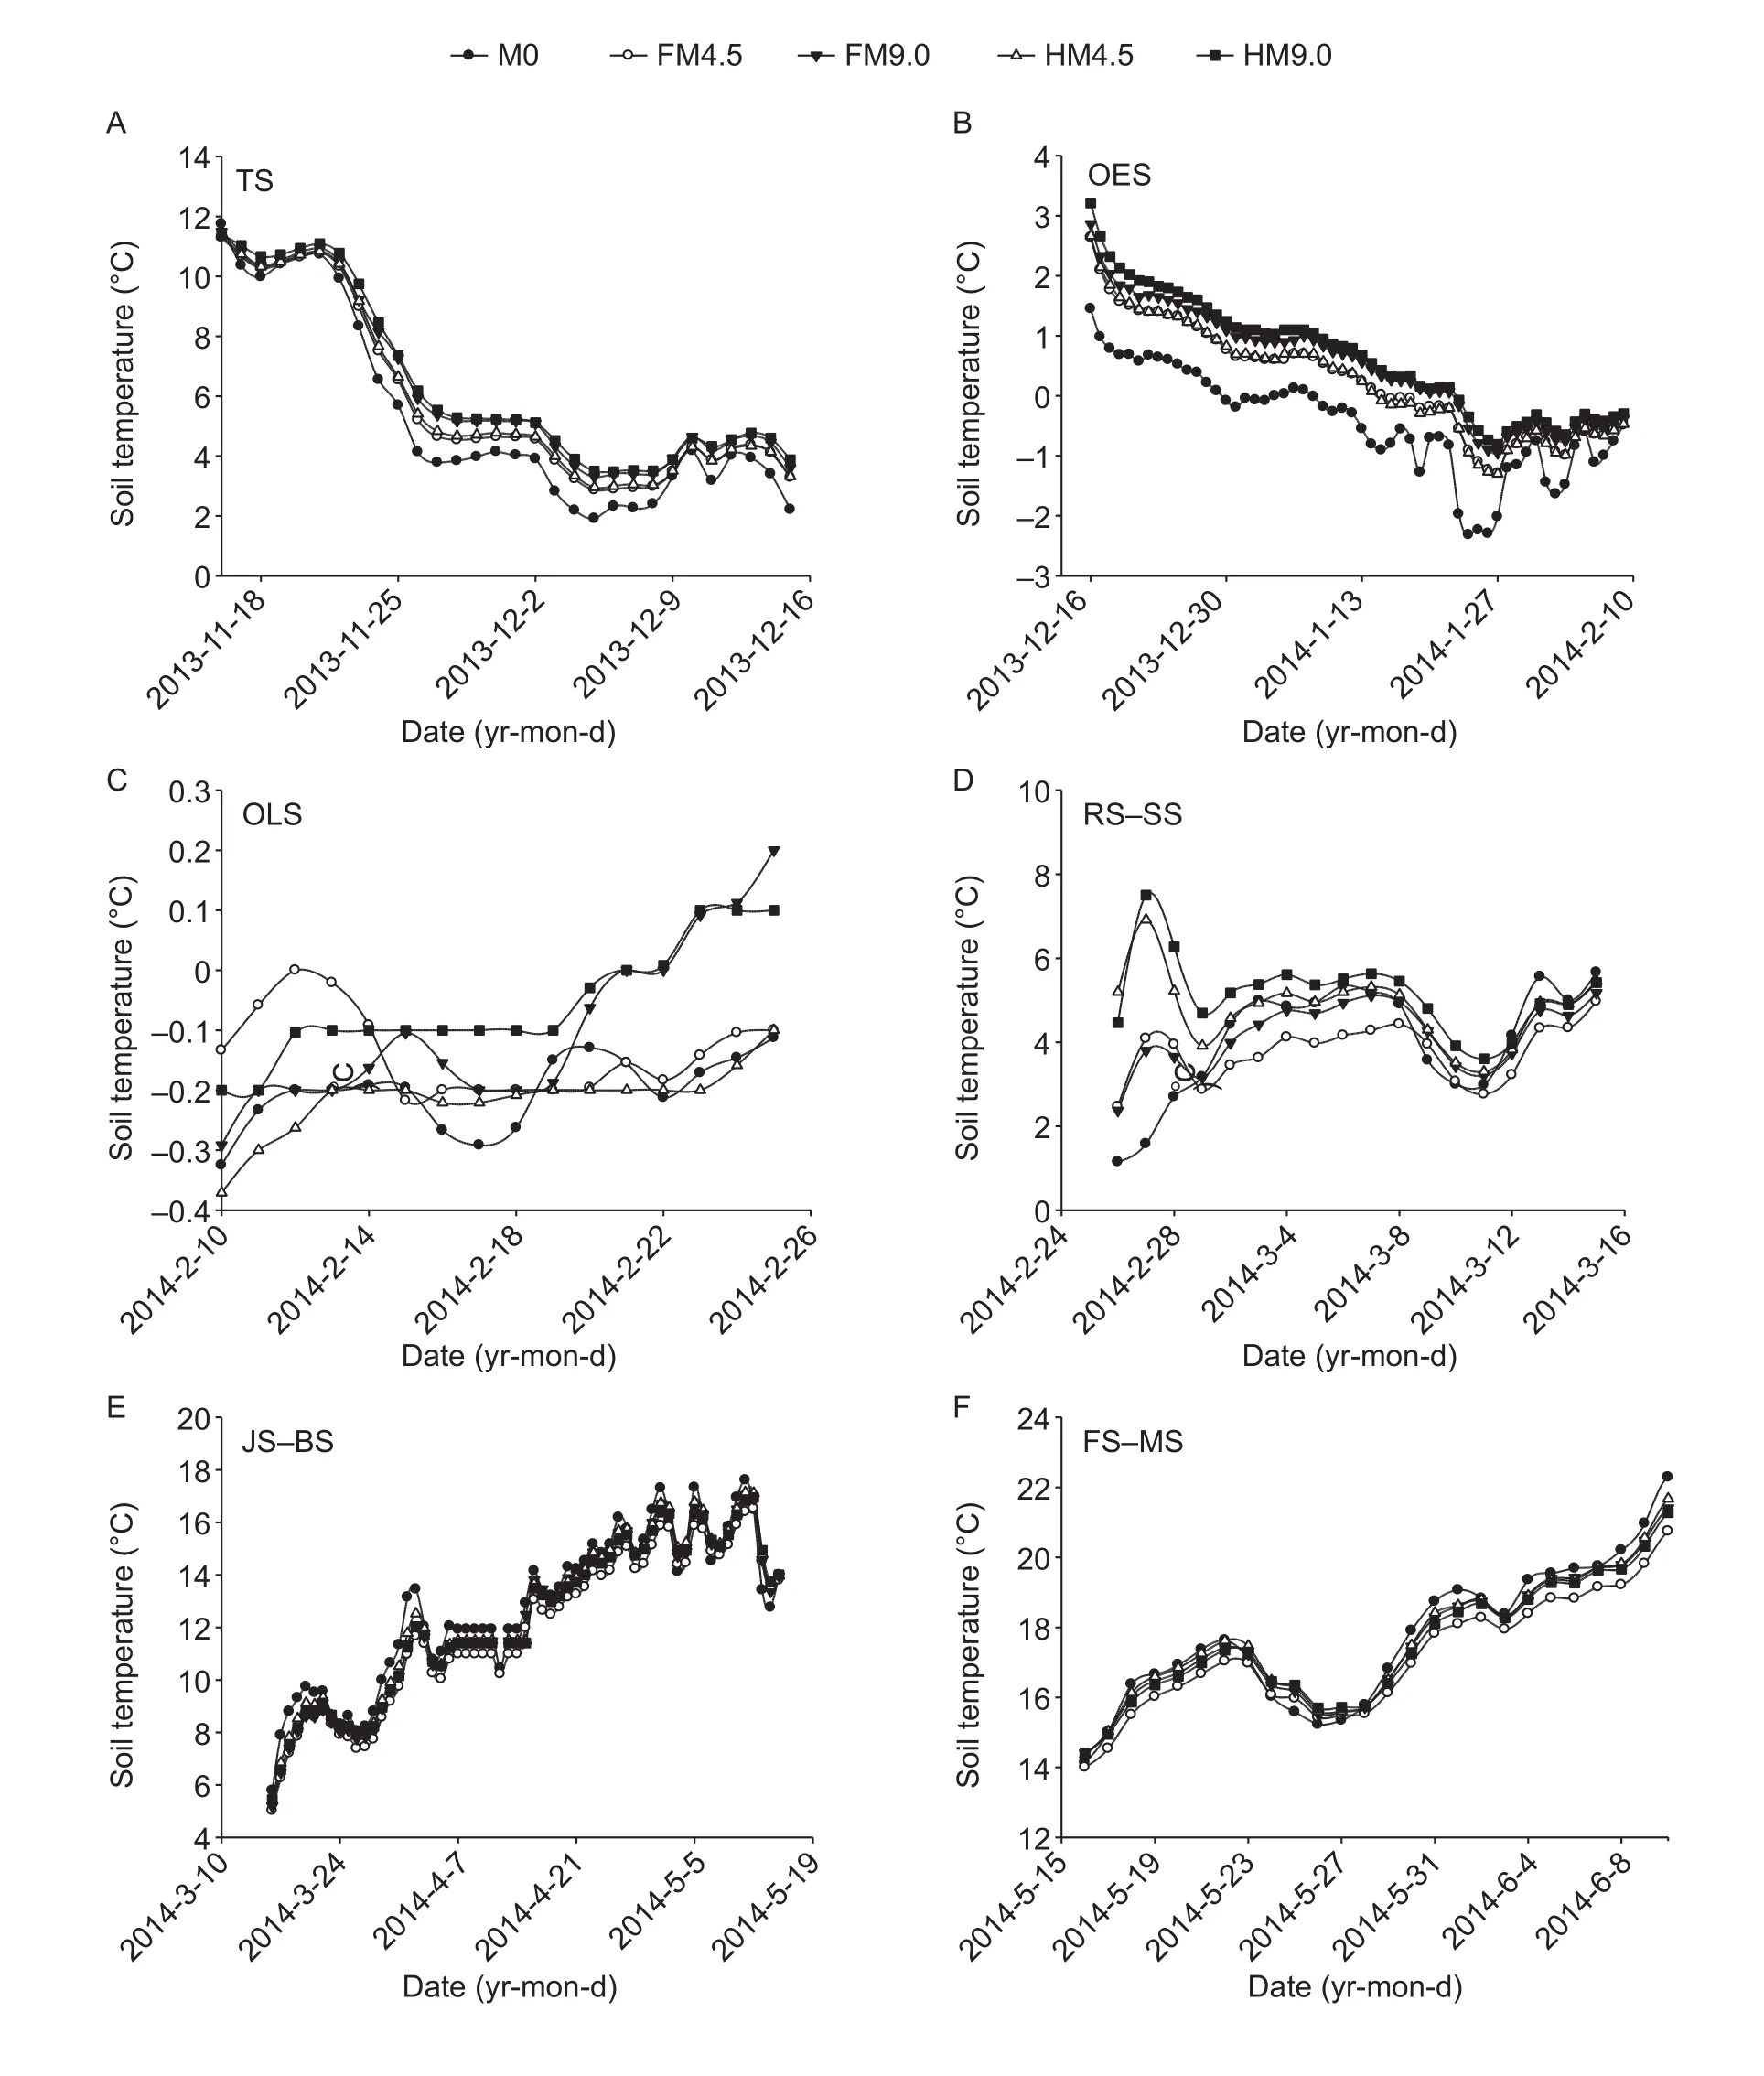
Fig. 4 Average daily soil temperature of the soil profile from 0 to 20 cm with the different mulched treatments in the different growth stages from 2013 to 2014. A, tillering stage (TS). B, overwintering early stage (OES). C, overwintering late stage (OLS). D,reviving to standing stage (RS-SS). E, jointing to booting stage (JS-BS). F, filling to maturity stage (FS-MS). M0 stands for no mulching; FM4.5 and FM9.0 stand for full coverage within all rows at a rate of 4.5 and 9.0 t ha-1, respectively; HM4.5 and HM9.0 stand for half coverage within alternate rows at a rate of 4.5 and 9.0 t ha-1, respectively.
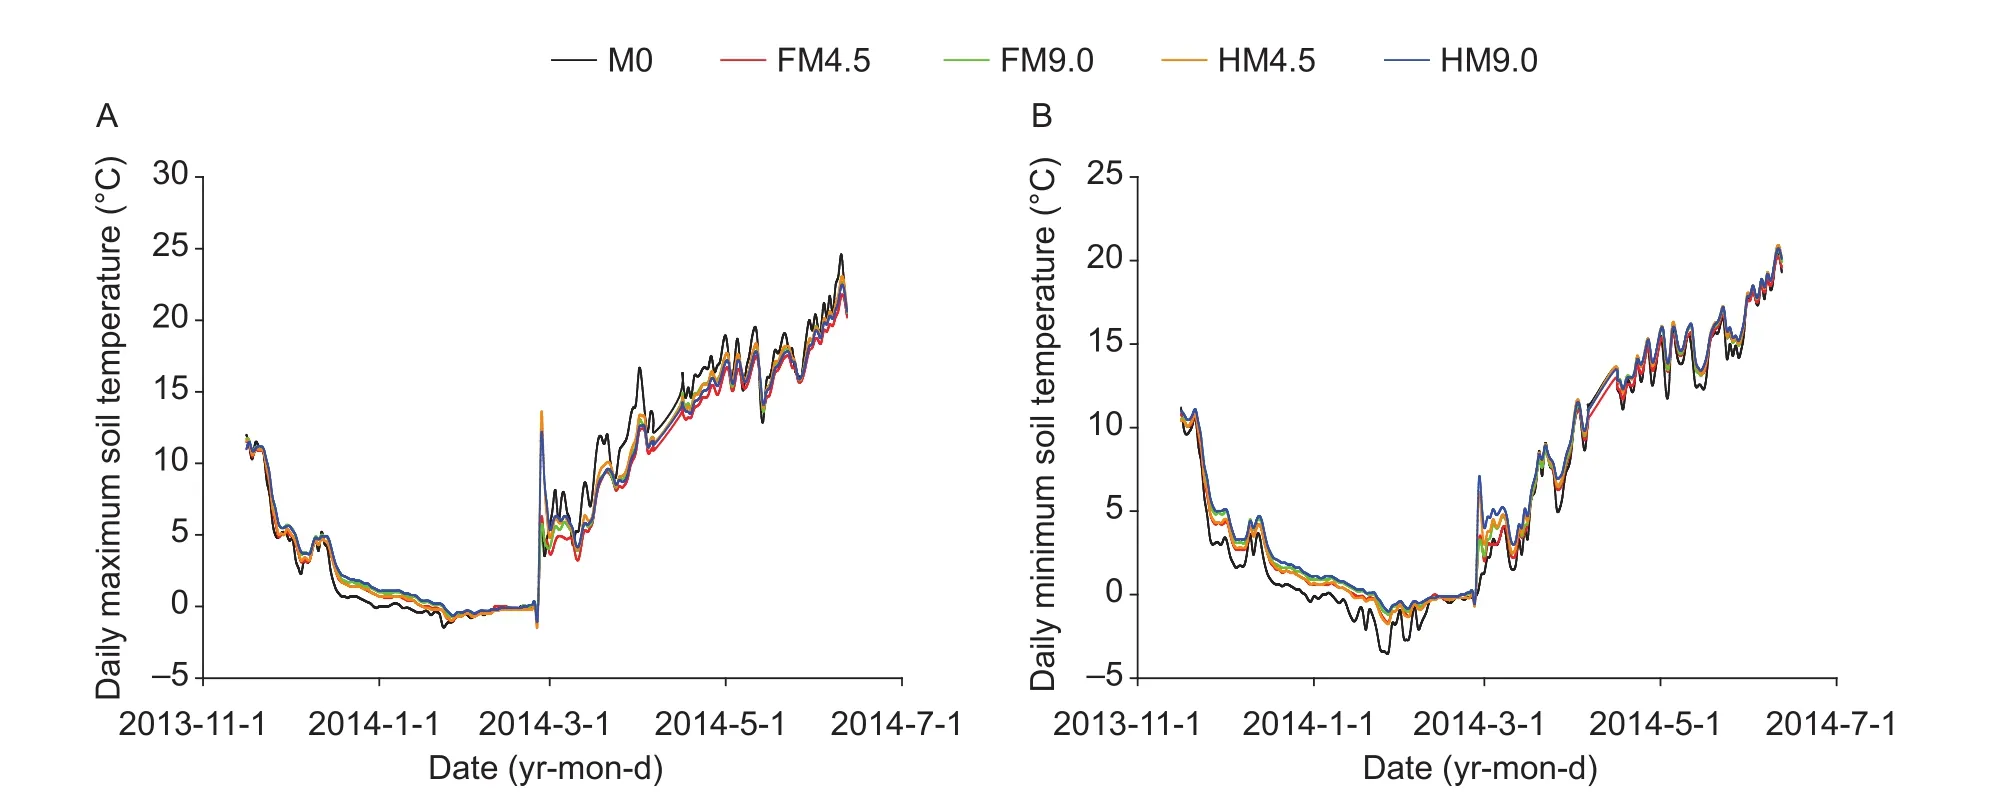
Fig. 5 Daily maximum (A) and minimum (B) soil temperature in different treatments from 2013 to 2014. M0 stands for no mulching;FM4.5 and FM9.0 stand for full coverage within all rows at a rate of 4.5 and 9.0 t ha-1, respectively; HM4.5 and HM9.0 stand for half coverage within alternate rows at a rate of 4.5 and 9.0 t ha-1, respectively.
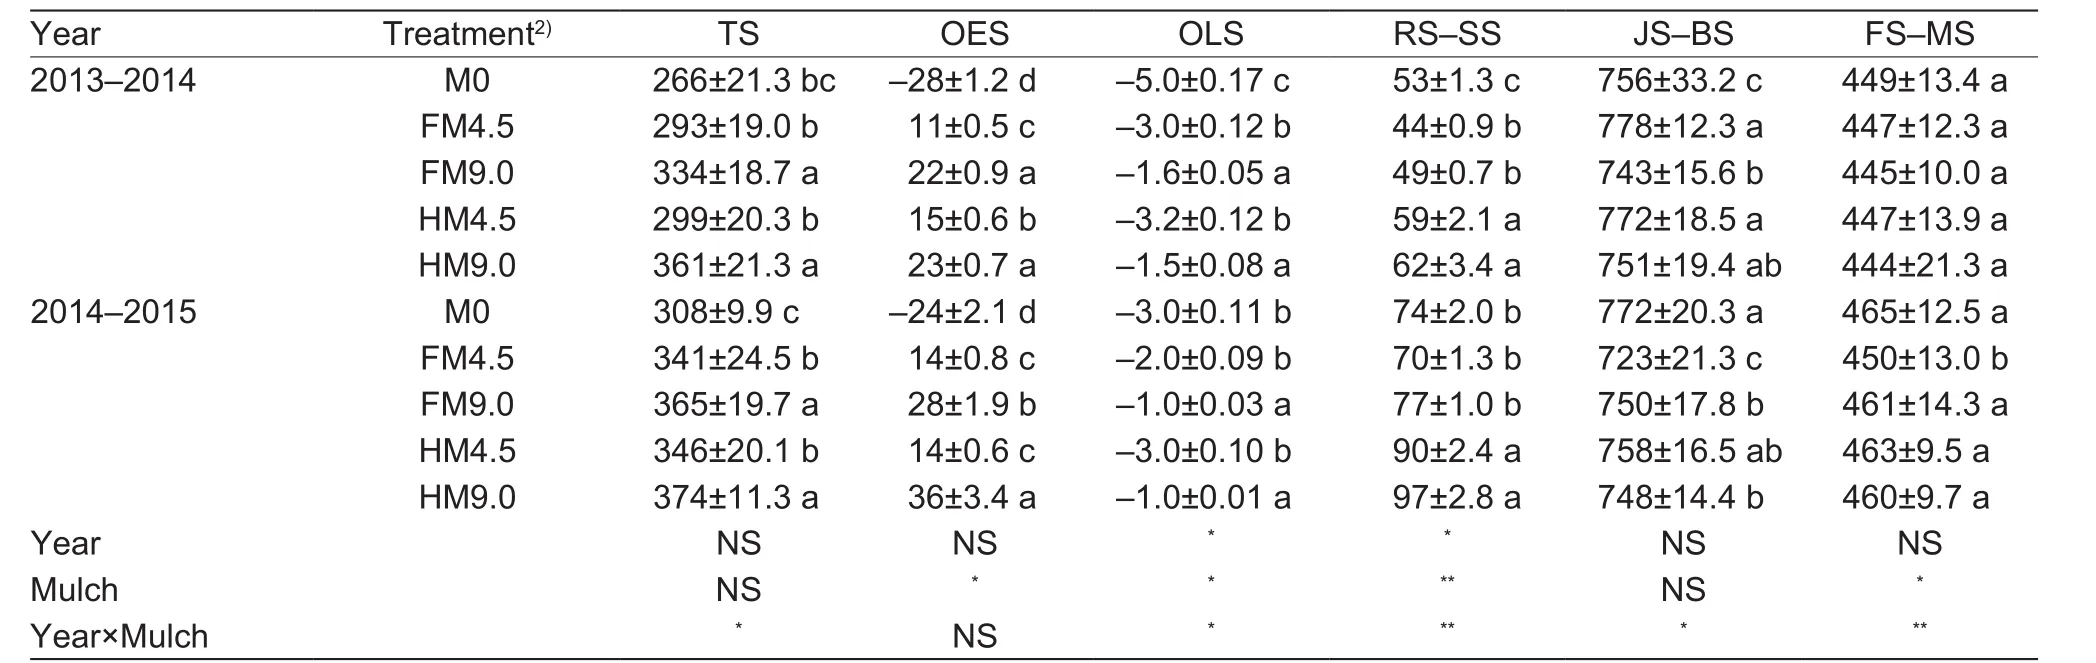
Table 1 Accumulated soil temperature (AST, °C d) of each growth stage in winter wheat in the different treatments1)
The straw-mulching regime is another factor that influences soil water conditions. In the present study,differences in the straw mulching regimes were the coverage areas and thickness with the same mulched rate. Soil water storage under half coverage within alternate rows (HM) was worse than that under full coverage within all rows (FM) in the early stages. It is possible that the main effect of mulching on water storage is to inhibit water evaporation when there is less rainfall during a particular growth stage. In dryland regions, preventing soil water evaporation plays main effect in soil water storage (Ram et al. 2013). Soil water content in the 0-40 cm layer under the HM pattern was higher than under the FM pattern. Soil water content from 0 to 40 cm was sufficient to meet the moisture requirements of wheat roots during earlier growth stages. However, in the later stages of wheat growth, soil water storage was higher in HM patterns especially under high mulching rates. This may be because HM provided more bare space for rainfall to percolate through the soil and less water passed through the residual straw on the surface. The HM pattern provided space, which can improve air exchange. Thicker mulching patterns could inhibit water evaporation and improve soil properties (He et al. 2016). Previous studies indicated that soil water-holding capacity was greater under high mulching rates (Chen et al. 2007; Zhang P et al. 2015).
4.2. Soil temperature
Soil temperature under mulching conditions was higher during colder weather and lower during a warmer weather.Chen et al. (2015) and Tegen et al. (2015) found that mulching can stabilize soil temperature change as opposedto large fluctuations under no mulching conditions; a similar trend was observed in the present study. The lower soil temperature in late stages is beneficial to a longer booting stage (Chakraborty et al. 2010). Although mulching increased the maximum soil temperature in the early stages and decreased the maximum diurnal soil temperature in the late stages, the minimum soil temperature was always higher under mulching than under no mulching during the entire growing process, consistent with the results of Fan et al. (2014). The magnitude of the warming effect under mulching in the early stages was greater than that of the cooling effect in the late stages. The difference in soil temperature between the mulching treatments was reduced when the crop canopy reached its maximum size in May in the present study, which is in accordance with results of Chen et al. (2007) and Fabrizzi et al. (2005). However,whether the lower soil temperature under mulch in the late stages was mainly affected by the mulching or by the higher plant canopy was unclear.
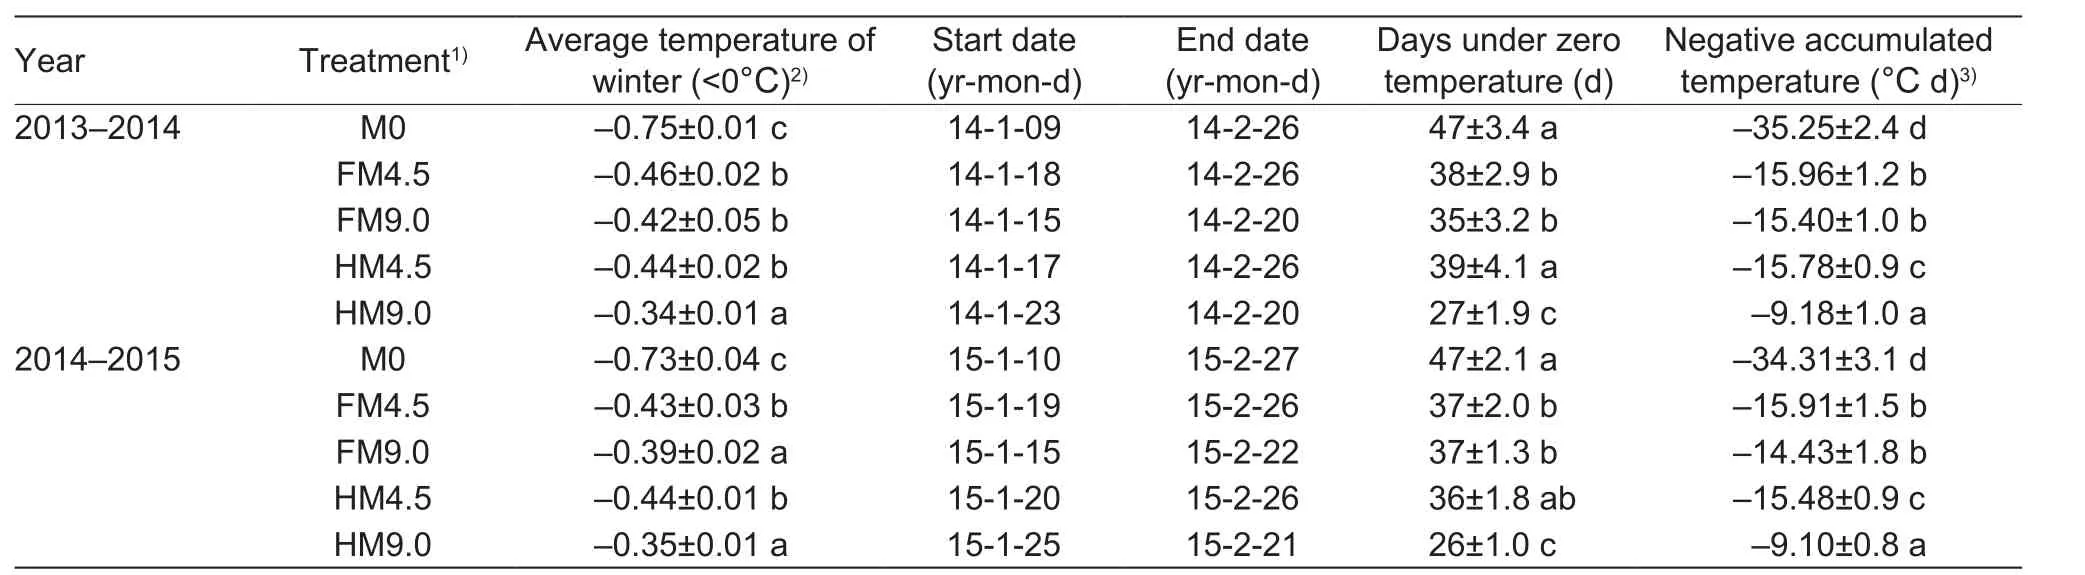
Table 2 Mulching effects on negative accumulated temperature and the average winter temperatures in the 0 to 20 cm soil layer
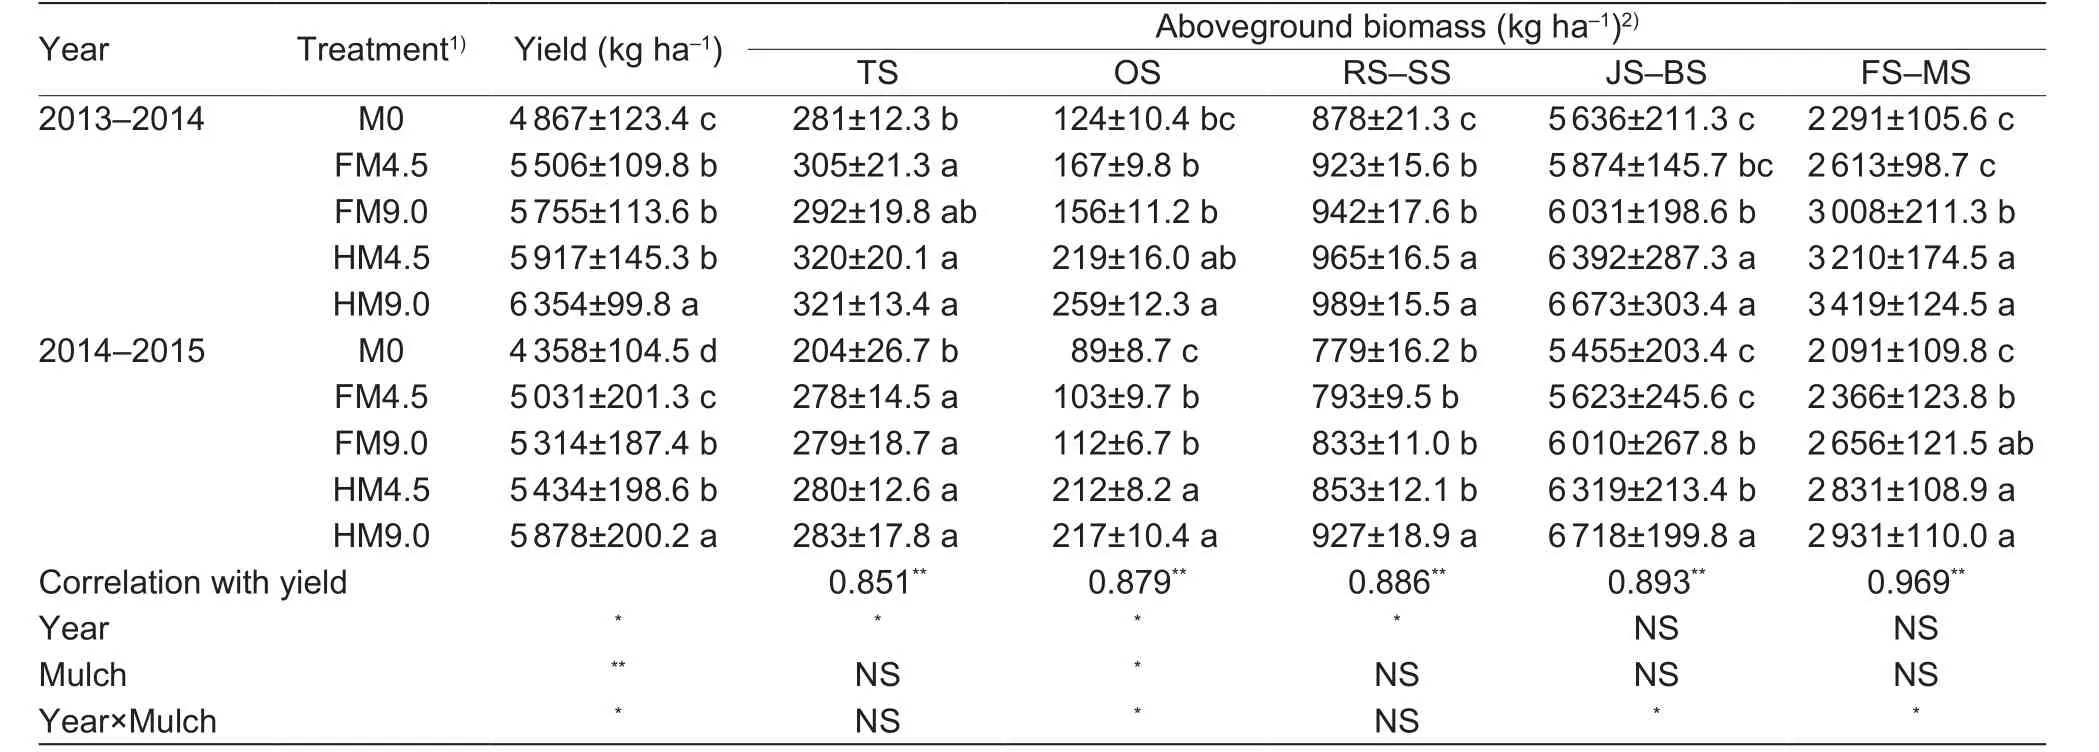
Table 3 Wheat yield and aboveground biomass in the different treatments
Higher soil temperatures under mulching in the winter can promote the tillering rate, which is favorable for grain yield(Zhang J P et al. 2015). Moreover, the mulching effect on soil temperature in the reviving stage is a crucial factor for wheat reviving. Lower soil temperatures under mulching in the spring can delay wheat growth and affect grain yield(Fan et al. 2014; Yin et al. 2016). However, Zhang J P et al.(2015) argued that straw mulching weakens the effects of water stress by decreasing soil evaporation, and to someextent, compensates for the negative impacts of lower soil temperature on winter wheat during the reviving stage.
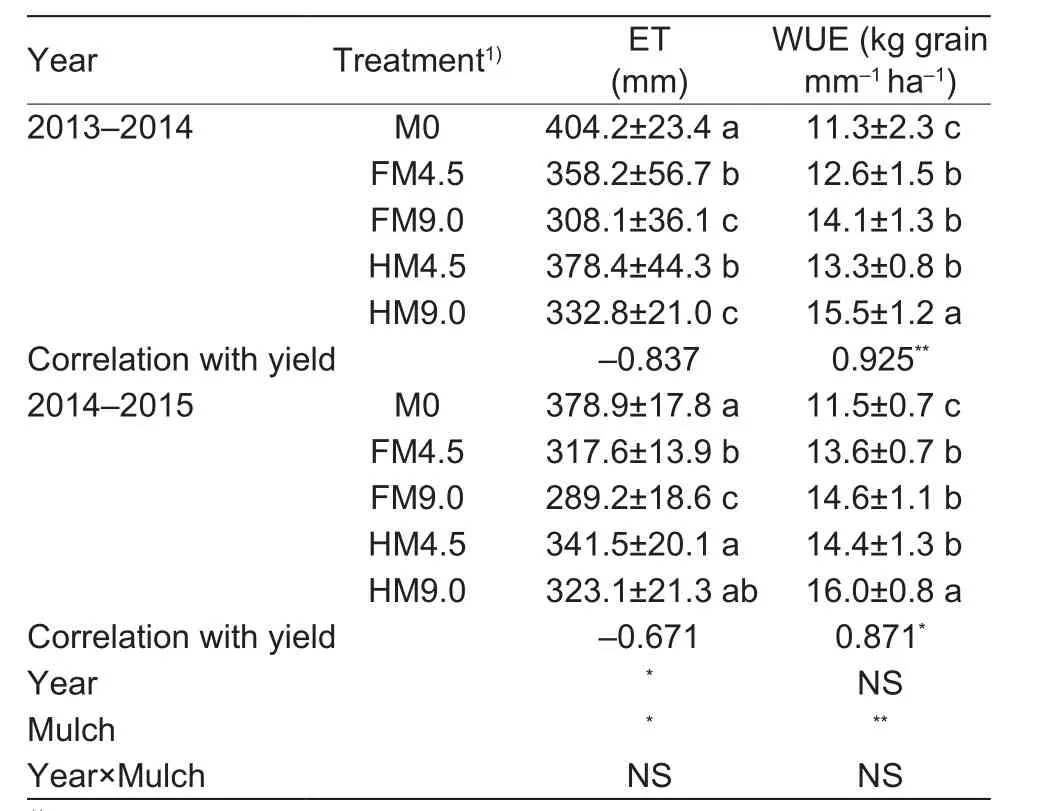
Table 4 Evapotranspiration (ET) and water use efficiency(WUE) of winter wheat under different straw mulch treatments
On the soil surface, the transmission of heat can be directly affected by the soil water content. According to Liu et al. (2014), soil evaporation can be affected by soil temperature in return. The mixed effects of changes in surface and albedo roughness, higher water content and increased plant cover at the soil surface can lead to the lower soil temperature under straw mulching (Buerkert et al. 2000). Lower soil temperature at 20 cm depth under mulching compared to non-mulched soil implies a reduction in the energy available for vaporizing water from the soil surface (Balwinder-Singh et al. 2016). The correlations between yield, soil temperature and soil water content were more significant in the tillering stage and the reviving to standing stages.
4.3. Crop factors
Mulching improvement of wheat yield has been reported in Zhang P et al. (2015). The higher grain yield in mulched groups may be caused by improving aboveground biomass over all growth stages. Besides the increase in biomass,the additional straw mulching favored the N accumulation during grain filling, allowing higher protein concentration in kernels and higher yield of wheat (Stagnari et al. 2014).The soil temperature and water content are two main factors promoting developmental stage and tillers for winter wheat growth (Yang et al. 2006). However, the soil temperatures of the five stages had non-significant correlations with aboveground biomass. Although lower soil temperature under mulching may inhibit wheat development, yield still increased. This is due to the early warmer soil temperature before the reviving stage and the ideal root distribution (Chen et al. 2007). The HM pattern showed greater grain yield under the same mulched rate. Less physical barriers in this mulching model (Liu et al. 2014) and a long warming effect on soil temperature would promote wheat growth. Yield was the highest under high mulching rates of 9.0 t ha-1at each mulching pattern in the present study. In the study of Zhang P et al. (2015), mulching of 9.0 t ha-1showed increased yield.
In the present study, grain yields were higher in the wetter growth season than in the drier growth season (2014-2015).However, the mulching effect on increased grain yields was more obvious in the drier year. WUE was also higher under the mulching groups in both years, showing a significant correlation with grain yields, which could be attributed mostly to the increase in grain yields and a decrease in evapotranspiration under the mulching treatments (Li et al.2013; Ram et al. 2013; Balwinder-Singh et al. 2016; He et al. 2016).
5. Conclusion
Half mulching coverage within alternate rows (HM) increased soil temperature in the early growth stage and prolonged time of warming compared with full mulching coverage withinall rows (FM). Moreover, the magnitude of the warming effect in the early stages under mulching conditions was greater than that of cooling effect in the late stages. Duration of negative soil temperature was shortened in mulching groups, especially under HM9.0. Additionally, soil water content was higher in HM groups than FM groups at the same mulching rate in all growth stages. The highest grain yield and water use efficiency were recorded in HM under 9.0 t ha-1of maize straw. Despite higher yields in mulched groups in the wetter year (2013-2014), yield increase rate was higher in the drier year (2014-2015). There results suggested that, despite the positive effects of mulching on yield increase, the HM pattern was more favorable to wheat growth, soil temperature and water efficiency.
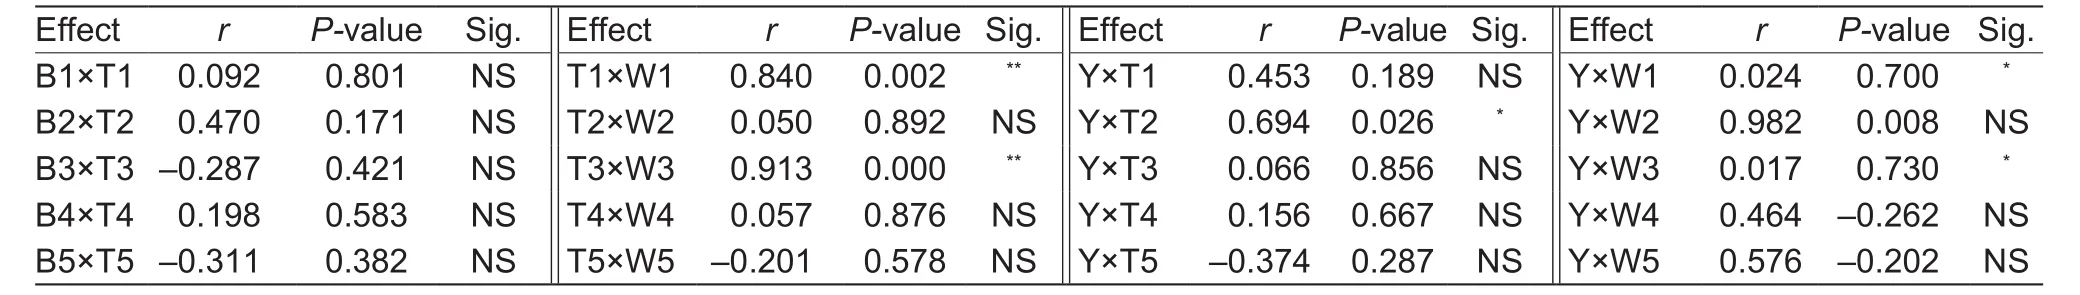
Table 5 Correlations between grain yield with soil temperature, water content, and aboveground biomass during the different stage of wheat growth1)
Acknowledgements
This work was financially supported by the Key Research and Development Program of Shanxi Province, China(201703D211002-5) and the Open Fund of the State Key Laboratory of Soil and Sustainable Agriculture, Institute of Soil Science, Chinese Academy of Sciences (Y20160019).
 Journal of Integrative Agriculture2018年11期
- Journal of Integrative Agriculture的其它文章
- First report of Athelia bombacina causing postharvest fruit rot on pear
- Sustainability assessment of potato fields using the DEXi decision support system in Hamadan Province, lran
- Effect of long-term continuous cropping of strawberry on soil bacterial community structure and diversity
- lnter-annual changes in the aggregate-size distribution and associated carbon of soil and their effects on the straw-derived carbon incorporation under long-term no-tillage
- Mycoplasma leachii causes polyarthritis in calves via the blood route but is not associated with pneumonia
- Genome-wide detection of selective signatures in a Duroc pig population