
lnter-annual changes in the aggregate-size distribution and associated carbon of soil and their effects on the straw-derived carbon incorporation under long-term no-tillage
2018-11-06 08:19:18YlNTaoZHAOCaixiaYANChangrongDUZhangliuHEWenqing
Journal of Integrative Agriculture 2018年11期
YlN Tao , ZHAO Cai-xia, YAN Chang-rong , DU Zhang-liu HE Wen-qing
1 Institute of Environment and Sustainable Development in Agriculture, Chinese Academy of Agricultural Sciences, Beijing 100081,P.R.China
2 Key Laboratory of Prevention and Control of Residual Pollution in Agricultural Film, Minstry of Agriculture, Beijing 100081,P.R.China
3 College of Plant Protection, Agricultural University of Hebei, Baoding 071001, P.R.China
Abstract Converting from conventional tillage to no-tillage influences the soil aggregate-size distribution and thus soil organic carbon(SOC) stabilization. However, the dynamics of soil aggregation and the straw-derived carbon (C) incorporation within aggregate fractions are not well understood. An experiment was established in 2004 to test the effects of two treatments,no-tillage with residue (NT) and conventional tillage without residue (CT), on the soil aggregate-size distribution and SOC stabilization in a continuous maize (Zea mays L.) cropping system located in the semiarid region of northern China. Soil samples were collected from the 0-10 cm layer in 2008, 2010 and 2015, and were separated into four aggregate-size classes(>2, 0.25-2, 0.053-0.25, and <0.053 mm) by wet-sieving. In each year, NT soil had a higher proportion of macroaggregates(i.e., >2 and 0.25-2 mm) and associated SOC concentration compared with CT. Additionally, to compare straw-derived C incorporation within NT and CT aggregate fractions, 13C-labeled straw was incubated with intact NT and CT soils. After 90 days, the highest proportion of 13C-labeled straw-derived C was observed in the >2 mm fraction, and this proportion was lower in NT than that in CT soil. Overall, we conclude that long-term continuous NT increased the proportion of macroaggregates and the C concentration within macroaggregates, and the physical protection provided by NT is beneficial for soil C sequestration in the continuous maize cropping system in semiarid regions of northern China.
Keywords: no-tillage, aggregate-size distribution, aggregate-associated carbon, 13C-labeled straw
1. lntroduction
No-tillage has been widely regarded as a potential option to enhance soil organic carbon (SOC) sequestration and thus mitigate the effects of climate change (Six and Paustian 2014; Du et al. 2017). SOC sequestration under no-tillage farming is affected by the balance between SOC decomposition and carbon (C) inputs (Six et al. 2000; Novara et al. 2016; Lopez-Bellido et al. 2017). Currently, three main soil organic matter (SOM) stabilization mechanisms have been proposed: chemical stabilization, physical protection and biochemical stabilization (Six et al. 2002). Physical protection, which is defined as the interaction between SOC and the soil structure, can be achieved by physico-chemical stabilization and aggregate formation (Lutzow et al. 2006).
SOC can be protected by aggregates via the formation of physical barriers between microbes and enzymes and their substrates (Six et al. 2002; Hontoria et al. 2016). Soil macroaggregation mediates SOM turnover and storage (Six et al. 1988; De et al. 2006), and macroaggregate turnover not only exposes labile organic matter but also provides a mechanism for the occlusion and physical protection of particulate organic matter (Plante and Mcgill 2002). Soil macroaggregation can show high temporal and seasonal dynamics (Angers and Mehuys 1988; Bronick and Lal 2005; Segoli et al. 2013; Andruschkewitsch et al. 2014b).However, although soil structure is constantly changing(De et al. 2006), aggregate formation dynamics possibly reach a steady state in the long-term (Yoo and Wander 2008; Andruschkewitsch et al. 2014a). This steady state prevents new C from serving as nucleation sites for the formation of new aggregates, and in turn the decomposition and distribution of new C might be related to soil aggregation processes (Six et al. 2004; Zhang et al. 2017). Therefore,understanding the diachronic dynamics of aggregate distribution and the associated C is essential for evaluating C sequestration, especially of new C under contrasting tillage systems.
To increase or maintain SOC content in no-tillage,crop residue retention is necessary (Turmel et al. 2015).Many studies have shown that residue C is redistributed from macroaggregates to microaggregates over time(Angers et al. 1997; Six et al. 1999; Gale et al. 2000; Guan et al. 2015). Other studies have reported that residue C stabilization occurs mainly at the microaggregate level(Li S Y et al. 2016) or is randomly distributed within the aggregates (Urbanek et al. 2011; Rabbi et al. 2015).These results suggest that residue C sequestration in soil aggregates may be dependent on the soil aggregation state (i.e., aggregate-size distribution and associated C)(Poirier et al. 2014; Zhang et al. 2015). Consequently,understanding the dynamics of residue C in aggregates is necessary to identify the pathways of C sequestration in soil(Angers et al. 1997; Gunina and Kuzyakov 2014).
During the last two decades, conservation tillage has been gradually adopted by the local farmers in northern China (Du et al. 2013). Previous studies on the aggregatesize distribution and associated C under no-tillage have shown that no-tillage enhances the proportion of stable macroaggregates (Plaza-Bonilla et al. 2013) and C concentration within macroaggregates (Du et al. 2013).However, there have been few studies on the effects of the aggregate-size distribution and associated C on strawderived C incorporation. Moreover, previous studies have been largely based on comparisons at a single timepoint.Therefore, there is a strong need to examine how changes in the distribution of aggregate-size and associated C over time affects the stabilization of straw-derived C. We hypothesized that: (1) the diachronic dynamics of soil aggregation under no-tillage with residue and conventional tillage without residue may result in the formation of aggregates with different sizes and associated C distributions; and (2) the soil aggregate-size distribution and associated C concentration may influence residue C incorporation. To test these hypotheses, in this study we investigated the interannual changes in soil aggregate distribution and the associated C concentration, and quantified the residue C distribution within aggregate fractions after 11 years of NT management.
2. Materials and methods
2.1. Experimental site
The study was conducted at the rainfed spring maize field experimental station, Agro-environment and Crop Water Productivity, Ministry of Agriculture, China (37°51´N,113°05´E, 1 130 m.a.s.l) in Shanxi Province, China. The experimental area is characterized as semiarid and subtropical, with a mean annual precipitation of 503 mm, of which 70% occurs from June to August. The mean annual temperature over the past 30 years is 8.2°C. One-season maize (Zea mays L., late April-early October) is the main cropping system in the region. The soil is silt loam (23.1%sand, 43.3% silt, 33.6% clay) and is classified as a Cambisol according to the FAO (2006). In the top 20-cm layer, the initial properties of the soil were: pH 8.4 (soil:water, 1:2.5);SOC, 24.2 g kg-1; total N, 1.04 g kg-1; available K, 0.10 g kg-1; available P, 0.008 g kg-1.
2.2. Field experiment
Field experimental designThe field experiment was a completely randomized design with three replications for each treatment, and the maize-fallow-maize cropping experiment was established beginning in 2004. The experiment included two treatments: (i) conventional tillage(CT) without residue; (ii) no-tillage (NT) with residue. In the CT treatment, all straw was removed after the fall harvest. Mouldboard plowing was applied to a depth of 15 to 20 cm after harvest, and tine tillage was used for seedbed preparation in mid-April using machines. In the NT treatment, all straw (average 5.25 t ha-1) was directly used to cover the soil surface in the field after the fall harvest.In the next spring, the seeds were sown manually with no-tillage.
The plot area measured 80 m2(8 m×10 m). The spring maize variety used throughout the study was Qiangsheng 31,which was generally sown on approximately April 25 and harvested on approximately October 10 each year. Urea(CO(NH2)2) and diammonium phosphate ((NH4)2HPO4) were applied as fertilizers to provide 150 kg N ha-1and 75 kg P2O5ha-1. Weeds and insects were effectively controlled by applying herbicide (2,4-D butylate) and insecticide (40%dimethoate) at a rate of 0.9 and 0.3 kg ha-1, respectively,in each treatment.
Soil samplingNT and CT fields were continuously cultivated with maize for 11 years (2004-2015), and soil samples were collected from the top soil (0-10 cm) by hand and shovel before sowing in 2008, 2010 and 2015. Impurities in the soil were removed with tweezers to avoid disturbing the natural structure of the soil as much as possible. Large soil clods were broken along the original fissures. The soil was placed in plastic boxes and then brought to the laboratory and stored at 4°C for soil fractionation analyses and the incubation experiment.
Soil aggregate fractionation and analysesSoil samples were physically fractionated using the wet sieving method,according to the procedure of Elliott (1986). A series of sieves was used to obtain four aggregate-size classes:large macroaggregates (>2 mm), small macroaggregates(0.25-2 mm), microaggregates (0.053-0.25 mm), and a silt plus clay fraction (<0.053 mm). Briefly, a 45-g air-dried soil sample was placed at the top of a stack of sieves. The sieve stack consisted of a geometric series of 2-, 0.25-,and 0.053-mm sieves. The sample was steam-wetted and then immersed in water for 5 min. Sieving was performed manually by moving the sieve 3 cm up and down 150 times for 5 min. The soil particles retained on each sieve were gently back-washed into pre-weighed aluminum containers.The soil materials that passed through the <0.053-mm sieve during wet-sieving were collected through extraction and filtration. Visible plant residues were carefully removed before drying and all fractions were oven-dried at 45°C for 48 h before they were weighed and stored for SOC analysis. The subsamples were ground (<200 μm), and C and13C contents were analysed using an isotope ratio mass spectrometer (IsoPrime 100; Elementar, UK).
We calculated the mean weight diameter (MWD, mm) of soil aggregates as described in Bavel et al. (1950):

Where, xiis the mean diameter of the size fraction and wiis the proportion of each size fraction over the total sample weight.
We calculated the average annual growth rate (AAGR,%) of soil aggregate C concentration as described in Jia et al. (2015):

Where, A and B are the soil aggregate C concentrations in first and last year, respectively, and n is the D-value of the last year from the first year.
2.3. lncubation experiment
Preparation of 13C-labeled maize residueMaize seeds(cv. Qiangsheng 31) were surface-sterilized with H2O2and planted in transparent plexiglas chambers (0.55 m×0.55 m×1.2 m).13CO2was generated by adding H2SO4to portions of 99%13C-enriched BaCO3(13C atom%>98, Shanghai Research Institute of Chemical Industry, China), and13CO2was injected into the plexiglass chamber via an injection port four times every five days throughout the incubation.The maize plants, including the shoot and root materials,were destructively sampled, oven-dried, and ground to pass through a 3-5 mm sieve 25 days after C labeling. The13C abundance in the labeled residue samples was determined using an isotope ratio mass spectrometer (IsoPrime 100;Elementar, UK). The straw used was a mix of maize shoots and roots with C and N contents of (371.3±1.8)and (28.0±0.3) g kg-1, respectively. The bulk isotopic signature of the maize straw C was (3 191±104)‰. Isotopic signature was expressed in the delta notation (δ13C) relative to the Pee Dee Belemnite (PDB) international standard(Craig 1957):
Where,13C/12Csampleis the stable isotope ratio of the sample and13C/12Creferenceis the stable isotope ratio of the PDB carbonate standard.
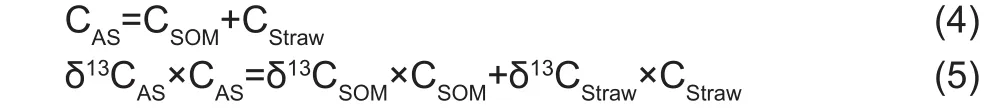
Design of the incubation experimentThe soil used for the incubation experiment was collected from the NT and CT fields described above before sowing in 2015. Prior to incubation, the remoistened soil was preincubated at 25°C for 10 days to minimize variation in microbial activity due to changes in temperature and water content (Kiem and Kandeler 1997). The experimental treatment consisted of NT and CT soil with the addition of13C-labeled maize straw residue (NT+S and CT+S). The control treatment consisted of NT and CT soil without the addition of maize straw residue. Experimental soil samples (50 g dry weight equivalent) were mixed with 0.5 g of13C-labeled maize straw residue, which was equivalent to 15.5-22.0% of the total soil organic C. The chemical properties of soil and13C-labeled maize straw are shown in Table 1. All treatments were replicated thrice, with five samples per treatment. The samples were incubated at 25°C in the dark for 90 days. Soil moisture was maintained at 60% of the water holding capacity during the incubation period.Three replicates of the control and experimental samples were destructively sampled at several time points, including before the start of incubation (day 0), and after 15 (day 15), 30 (day 30), 60 (day 60), and 90 days (day 90) of incubation. All samples were immediately fractionated and analyzed as described below.
Estimation of the amount of maize-derived C within soil fractionsThe following formula was used to calculate the ratio of different sources of organic carbon in the soil fraction(Blaud et al. 2012):
Where, CASis the total amount of C in a given fraction of experimental soil, CSOMis the amount of C derived from SOM, CStrawis the amount of C derived from maize straw,δ13CASis the isotopic signature of amended soil, δ13CStrawis the isotopic signature of maize straw, and δ13CSOMis the isotopic signature of initial SOM. The δ13C of the control samples (δ13CCS) was used to estimate δ13CSOM. The ratio of CStraw/CASincorporated into a given fraction was determined using eq. (6), which is a combination of eqs. (4) and (5):

2.4. Statistical analyses
Two-way ANOVA was used to determine the main and interactive effects of treatment and sampling time. A general linear model with a Fisher’s least significant difference (LSD)test was used to detect statistical differences between the treatment main effects. The independent samples t-test was used to detect statistical differences between treatments within each sampling event. Results in thefigures are presented as mean±SE. P<0.05 was accepted as statistically significant. All statistical analyses were conducted using IBM SPSS Statistics 21.0.
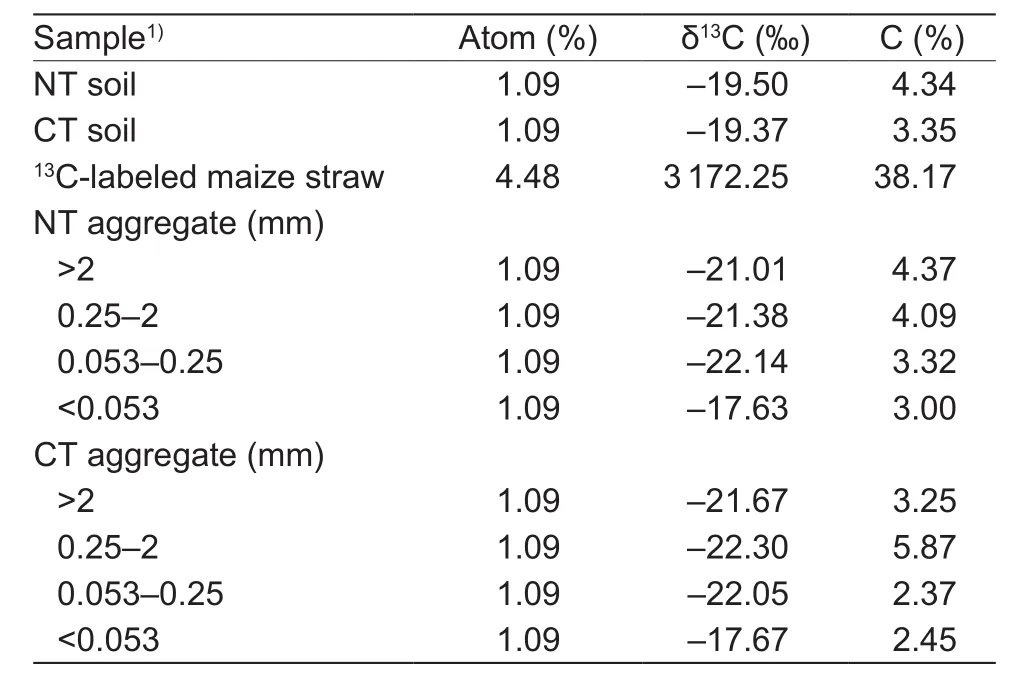
Table 1 Properties of soil samples and 13C-labeled maize straw before incubation
3. Results
3.1. Soil aggregate-size distribution and MWD of aggregates
The soil aggregate-size distribution was significantly influenced by tillage treatment (T; all P<0.001, Fig. 1),sampling event (S; all P<0.001, Fig. 1), and their interaction(T×S; P<0.001, Fig. 1-A and B; P<0.05, Fig. 1-C and D). NT had a significantly higher proportion of >2 mm aggregates than CT, with an average of 114.0% for 2008-2015 (P<0.05;Fig. 1-A). And the proportion of >2 mm aggregates continually increased with sampling time under NT. Except for the sampling event in 2008, NT had a significantly higher proportion of 0.25-2 mm aggregates than CT, with an average of 39.2% for 2008-2015 (P<0.05; Fig. 1-B).However, compared with 2008, the proportion of 0.25-2 mm aggregates under NT was significantly lower in 2015(P<0.05; Fig. 1-B). Compared with NT, CT had a significantly higher proportion of 0.053-0.25 mm aggregates (average of 56.5% for 2008-2015; P<0.05; Fig. 1-C) and <0.053 mm aggregates (average 51.9% for 2008-2015; P<0.05;Fig. 1-C and D). Overall, NT significantly increased the proportion of the >2 mm and 0.25-2 mm fractions compared with CT, except for the 0.25-2 mm fraction in 2008 (P<0.05;Fig. 1-A and B). The proportion of the >2 mm fraction under NT and the proportion of the <0.053 mm fraction under CT continually increased with time (P<0.05; Fig. 1-A and D).However, in 2015, the 0.25-2 mm and 0.053-0.25 mm fractions under NT and CT were significantly lower compared with 2008 (P<0.05; Fig. 1-B and C).
The MWD was also significantly influenced by T, S,and T×S (P<0.001, P<0.001, P<0.05; Fig. 2). The MWD of NT was 30.8, 50.6 and 98.2% greater than that of CT in 2008, 2010 and 2015, respectively (all P<0.05, Fig. 2).The differences in MWD under NT between 2010 and 2015 were not significant (P<0.05, Fig. 2).
3.2. Total carbon concentration within soil aggregate fractions
Total C concentration within soil aggregate fractions was significantly influenced by T (P<0.001, Fig. 3-A and B;P<0.05, Fig. 3-C and D), S (all P<0.001, Fig. 3), and T×S;however, significant T×S interactions were only found for the >2 mm and 0.053-0.25 mm fractions (P<0.001, Fig. 3-A;P<0.05, Fig. 3-C).
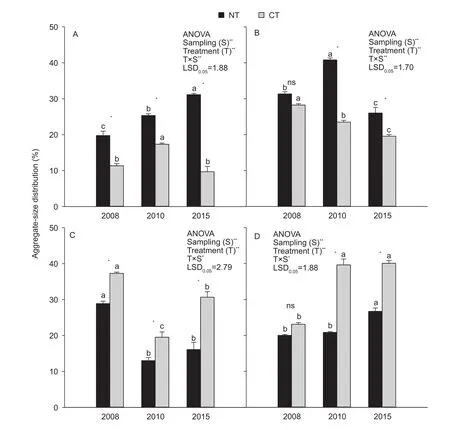
Fig. 1 Water stable aggregate-size distribution as influenced by tillage treatments and sampling times. A, >2 mm fractions. B,0.25-2 mm fractions. C, 0.053-0.25 mm fractions. D, <0.053 mm fractions. NT, no-tillage with residue; CT, conventional tillage without residue. Error bars represent the SEM of three replicates. The value of LSD (LSD0.05) calculated by two-way ANOVA at P=0.05 level was used for pairwise multiple comparisons across sampling events within each soil aggregate fractions. Different lowercase letters indicate significant differences between sampling times within each treatment and soil aggregate fractions (P<0.05).Independent samples t-test was used to detect the statistical differences between tillage treatments within each sampling event and soil aggregate fractions (P<0.05). * and **, statistically significant difference at P<0.05 and P<0.001, respectively; ns, no significance.
NT had a significantly higher total soil C concentration than CT in the >2 mm and 0.025-2 mm fractions at all time points, except for the 0.25-2 mm fraction in 2008 (P<0.05,Fig. 3-A and B). However, for the 0.053-0.25 mm and<0.053 mm fractions, no significant difference in total soil C concentration between NT and CT was observed, except for the 0.053-0.25 mm fraction in 2015 (P<0.05, Fig. 3-C and D). Overall, significant differences in total C concentration within soil aggregate fractions between NT and CT were mainly observed in the >2 mm and 0.25-2 mm fractions(Fig. 3-A and B).
The total C concentration within all soil aggregate fractions under NT continually increased over time (Fig. 3).Averaged across all sampling time points, the ranking of soil aggregate fractions under NT based on total C concentration was as follows: >2 mm (20.8 g kg-1), 0.25-2 mm (20.4 g kg-1),0.053-0.25 mm (14.6 g kg-1) and <0.053 mm (13.9 g kg-1).The change in total C concentration of CT showed a similar trend; however, the ranking of soil aggregate fractions was slightly different: 0.25-2 mm (16.8 g kg-1), >2 mm (14.7 g kg-1), 0.053-0.25 mm (13.3 g kg-1) and <0.053 mm (12.5 g kg-1). The greatest AAGR of aggregate C concentration was observed for the 0.053-0.25 mm fraction under NT (8.8%)and the 0.25-2 mm fraction under CT (6.9%).
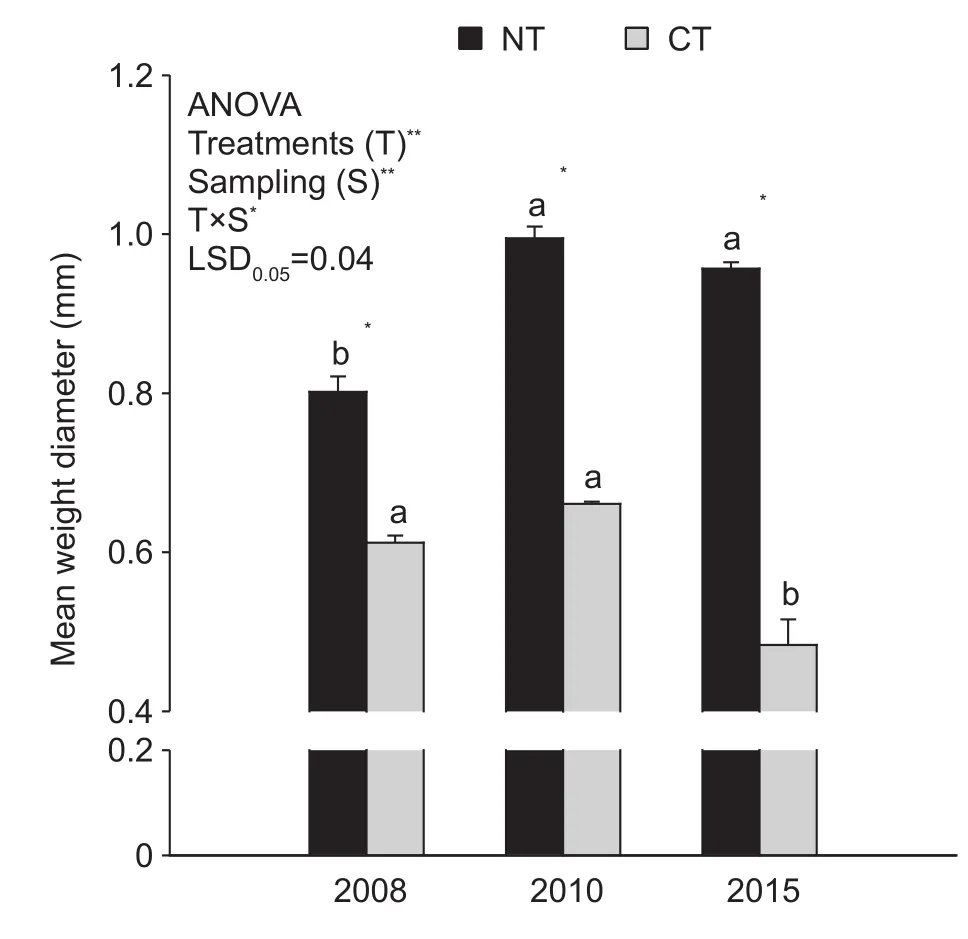
Fig. 2 Mean weight diameter (MWD) of aggregate-size fractions as influenced by tillage treatments and sampling times.NT, no-tillage with residue; CT, conventional tillage without residue. Error bars represent the SEM of three replicates.The value of LSD (LSD0.05) calculated by two-way ANOVA at P=0.05 level was used for pairwise multiple comparisons across sampling events. Different lowercase letters indicate significant differences between sampling times within each treatment (P<0.05). Independent samples t-test was used to detect the statistical differences between tillage treatments within each sampling event (P<0.05). * and **, statistically significant difference at P<0.05 and P<0.001 respectively; ns,no significance.
3.3. lncubation experiment
Straw-derived C in bulk soilThe proportion of strawderived C in bulk soil was significantly influenced by T but not by S and T×S interaction (P<0.001, P>0.05, Fig. 4).The proportion of straw-derived C in bulk soil under NT+S was lower than that under CT+S at all time points, but a significant difference was only found for the 30 d sampling point (P<0.05, Fig. 4). Under NT+S, the proportion of strawderived C in bulk soil was not significantly different after incubation for 30 days (P>0.05, Fig. 4).
Straw-derived C in soil aggregate fractionsA significant effect of T on the straw-derived C distribution in soil aggregate fractions was only observed for the >2 mm fractions (P<0.001, Fig. 5-A). S significantly affected the straw-derived C distribution (P<0.001, Fig. 5-A; P<0.05,Fig. 5-C and D) for all fractions except the 0.25-2 mm fraction (Fig. 5-B).
In the >2 mm fraction, the proportion of straw-derived C under NT+S was significantly lower than that under CT+S, except at the 90th day of incubation, where the difference between NT+S and CT+S was not significant(P<0.05, P>0.05, Fig. 5-A). In other fractions, there were no significant differences between NT+S and CT+S (P>0.05,Fig. 5-B and D).
In NT+S, the proportion of straw-derived C in the >2 mm and 0.25-2 mm fractions did not significantly differ between incubation time points (P>0.05, Fig. 5-A and B), but for the 0.053-0.25 mm and <0.053 mm fractions, there were significant differences between sampling events (P<0.05,Fig. 5-C and D). Averaged across all sampling times, the ranking of soil aggregate fractions under NT+S based on the proportion of straw-derived C was as follows: >2 mm(0.60%), 0.053-0.25 mm (0.54%), <0.053 mm (0.49%)and 0.25-2 mm (0.48%). In CT+S, the proportion of strawderived C in the 0.25-2 mm fraction did not significantly differ between incubation time points (P>0.05, Fig. 5-B),while for the other fractions, significant differences were mainly observed between 15 and 90 days (P<0.05, Fig. 5-A,C and D). Averaged across all sampling time points, the soil aggregate fractions under CT+S were ranked based on the proportion of straw-derived C as follows: >2 mm(1.39%), 0.25-2 mm (0.49%), <0.053 mm (0.45%) and 0.053-0.25 mm (0.35%). Overall, for both NT+S and CT+S,the largest proportion of straw-derived C was observed in the >2 mm fraction, and the straw-derived C was more evenly distributed between aggregate fractions in NT+S than that in CT+S.
4. Discussion
4.1. Soil aggregation and aggregate stability
Aggregate-size distribution was significantly impacted by tillage management and time (Fig. 1). NT increased the proportion of large macroaggregates (>2 mm), and this may be mainly due to the low rate of macroaggregate turnover(Six et al. 2000). Additionally, the high proportion of large macroaggregates may be attributed to dynamic equilibrium,which balances the formation and destruction of aggregates over time (Bronick and Lal 2005; Yoo and Wander 2008;Andruschkewitsch et al. 2013). Residue C input can also promote soil macroaggregation (Bravo-Garza et al. 2010;Zhang et al. 2017). In our study, the increased proportion of large macroaggregates (>2 mm) probably originated from binding of small macroaggregates (0.25-2 mm) and microaggregates (0.053-0.25 mm), because the proportion of these smaller aggregates significantly decreased over time(P<0.05; Fig. 1-B and C). This is consistent with previous observations that no-tillage increases microaggregate formation within macroaggregates (Angers et al. 1997;Six et al. 1998; De et al. 2008). The higher proportion of the <0.053 mm fraction under continuous CT may cause physical disruption of macroaggregate structures and increase the decomposition rate of formerly incorporated organic material (Andruschkewitsch et al. 2013).
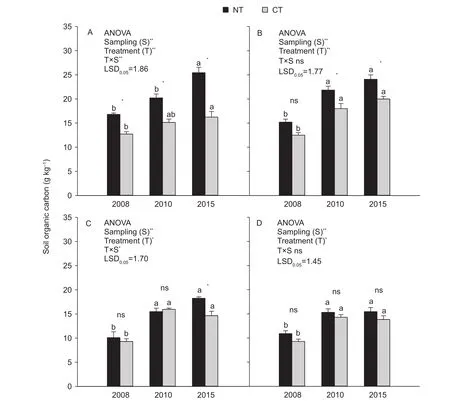
Fig. 3 Total aggregate-associated C concentration as influenced by tillage treatments and sampling times. A, >2 mm fractions. B,0.25-2 mm fractions. C, 0.053-0.25 mm fractions. D, <0.053 mm fractions. NT, no-tillage with residue; CT, conventional tillage without residue. Error bars represent the SEM of three replicates. The value of LSD (LSD0.05) calculated by two-way ANOVA at P=0.05 level was used for pairwise multiple comparisons across sampling events within each soil aggregate fractions. Different lowercase letters indicate significant differences between sampling times within each treatment and soil aggregate fractions (P<0.05).Independent samples t-test was used to detect the statistical differences between tillage treatments within each sampling event and soil aggregate fractions (P<0.05). * and **, statistically significant difference at P<0.05 and P<0.001, respectively; ns, no significance.
Variation in aggregate MWD can be used to compare the relative rates of aggregate formation and destruction (Plante and Mcgill 2002; Yoo and Wander 2008). Compared with CT, MWD under continuous NT significantly increased at each sampling time point (P<0.05, Fig. 2). The MWD under NT increased in 2010 and then decreased in 2015, but this difference was not significant (P<0.05, Fig. 2). This result may indicate that aggregation dynamics reach a steady state after 11 years of continuous NT. A similar tendency was observed under CT, except that the MWD significantly decreased in 2015 relative to 2010 (P<0.05, Fig. 2). This result suggests that the aggregation process under NT and CT is similar and that differences in SOM content, binding agents in macroaggregates and soil microbial distribution are the main reasons for the difference in MWD (Amin et al.2016; Cates et al. 2016; Zhang et al. 2016).
4.2. Aggregate-associated C concentration within aggregate fractions
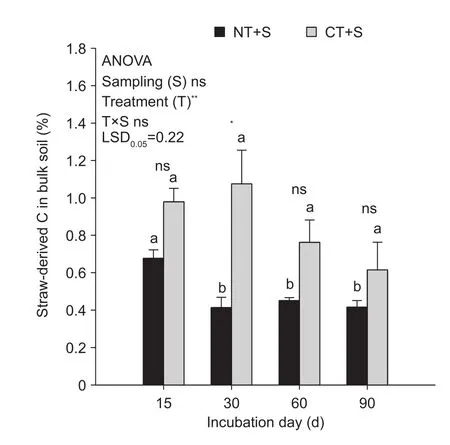
Fig. 4 The proportion of straw-derived C in bulk soil as influenced by treatments and sampling times. NT+S, NT soil with 13C-labeled maize straw; CT+S, CT soil with 13C-labeled maize straw. Error bars represent the SEM of three replicates.The value of LSD (LSD0.05) calculated by two-way ANOVA at P=0.05 level was used for pairwise multiple comparisons across sampling events. Different lowercase letters indicate significant differences between sampling times within each treatment(P<0.05). Independent samples t-test was used to detect the statistical differences between treatments within each sampling event (P<0.05). * and **, statistically significant difference at P<0.05 and P<0.001, respectively; ns, no significance.
Compared with CT, continuous NT mainly increased the C concentration in the >2 mm and 0.25-2 mm fractions(Fig. 3), suggesting that changes in tillage systems may particularly affect SOC concentration and dynamics within macroaggregates. These results are supported by other studies regarding soil C distribution in aggregates (Six et al. 2000; Bhattacharyya et al. 2009; Du et al. 2013). The increased C concentration in macroaggregates under NT is probably due to less soil disturbance (Plaza-Bonilla et al.2013), which thus enhances the occlusion of small-sized particulate organic matter in the macroaggregates (Wright and Hons 2005; Du et al. 2013). The greatest AAGR of aggregate C concentration was observed in the 0.053-0.25 mm fraction (8.8%) under NT. One reason for this result could be that when the ability of particulate organic carbon to be a nucleation site for the formation of new aggregates was restricted in the steady aggregation state under notillage (Bossuyt et al. 2004; Rabbi et al. 2015; Song et al.2016), hydrolysable organic carbon probably became the major carbon source and was adsorbed or preserved by microaggregates (Ochoa et al. 2009; Ghosh et al. 2016).However, the higher AAGR of aggregate C concentration in microaggregates is probably due to multiple factors and needs to be further investigated, especially under NT.
4.3. Distribution of maize-derived C in the soil and aggregate fractions
We found that the proportion of straw-derived C in bulk soil under both NT+S and CT+S decreased with incubation time (Fig. 4). This was probably due to the decomposition of straw by microbial activity (Andruschkewitsch et al.2014a; Marschner et al. 2015; Li L G et al. 2016; Lian et al.2016). However, during the incubation, the CT+S treatment sequestrated more maize-derived C than NT+S (Fig. 4),indicating that maize-derived C was preferentially preserved by the SOC-poor soil. This result is consistent with the results of Poirier et al. (2014) and An et al. (2015). In contrast, Plaza-Bonilla et al. (2010) reported that SOC-rich soil preserved more residue-derived C than SOM-poor soils.Consequently, the accumulation of residue C in the soil is not only affected by initial SOC level and C saturation deficit,but also by the initial aggregate-size distribution (Yoo et al.2011; Stamati et al. 2013). For instance, Poirier et al. (2013)reported that the aggregate-size distribution, especially the fine fraction percentage, may also influence the stabilization of residue-derived C. Accordingly, the higher proportion of 0.053-0.25 mm and <0.053 mm fractions in CT than that in NT (Fig. 1-C and D) could partially explain the higher sequestration of C by this soil.
Regarding the distribution of residue C in aggregate fractions, the initial soil aggregate-size distribution and the associated C concentration may be important factors. We found that the proportion of residue C under NT+S was relatively well-distributed across the aggregate fractions during the incubation experiment (Fig. 5), suggesting that the higher proportion of macroaggregates and the associated C prevented the residue C from serving as a nucleation site for the formation of new aggregates. By contrast, the proportion of residue C in the >2 mm fraction under CT+S was higher than other fractions across sampling time points (Fig. 5-A).Our results are in accordance with other studies showing that the incorporation of residue-derived C into aggregates increases with aggregate-size (Puget and Drinkwater 2001;Olchin et al. 2008). On the other hand, our data suggest that adding crop residues to soil could promote the formation of macroaggregates following their decomposition by soil microorganisms, which is consistent with the conclusions of previous studies (Denef and Six 2005; Zhang et al. 2017).We therefore recommend that an appropriate amount of crop residue is applied to maintain or increase SOC stock under the NT system.
5. Conclusion
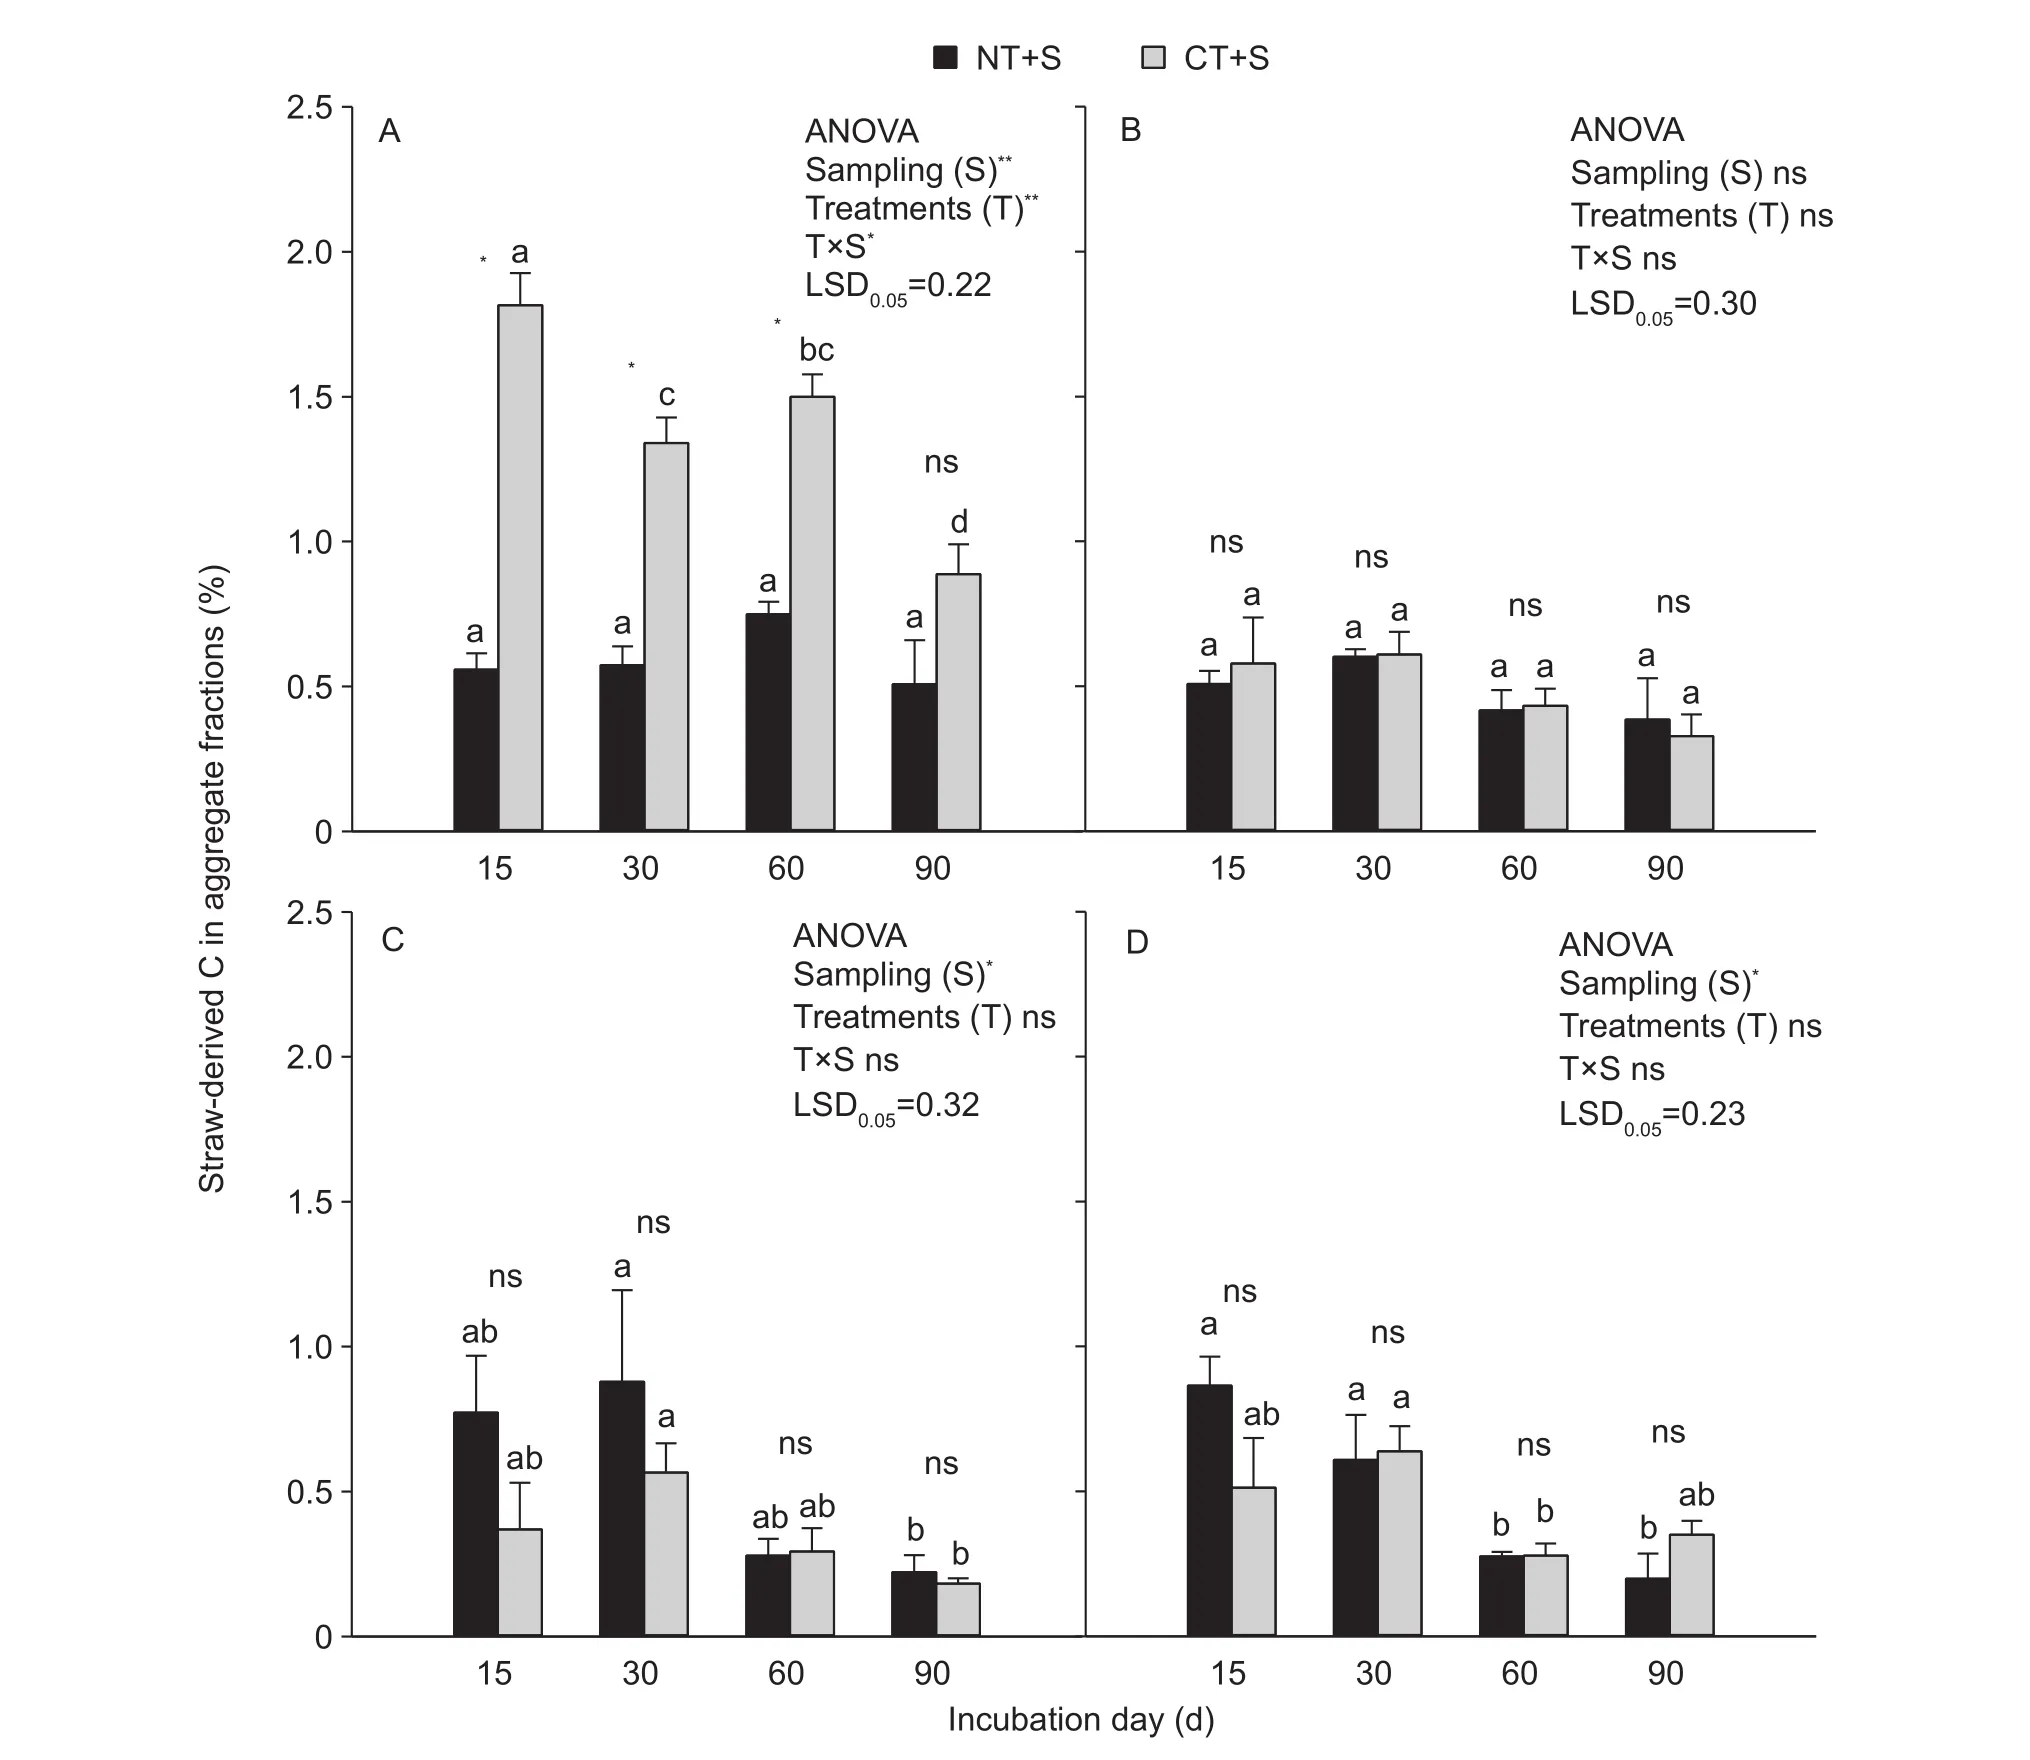
Fig. 5 The proportion of straw-derived C in aggregate fractions as influenced by treatments and sampling times. A, >2 mm fractions.B, 0.25-2 mm fractions. C, 0.053-0.25 mm fractions. D, <0.053 mm fractions. NT+S, NT soil with 13C-labeled mazie straw; CT+S,CT soil with 13C-labeled mazie straw. Error bars represent the SEM of three replicates. The value of LSD (LSD0.05) calculated by two-way ANOVA at P=0.05 level was used for pairwise multiple comparisons across sampling events. Different lowercase letters indicate significant differences between sampling times within each treatment (P<0.05). Independent samples t-test was used to detect the statistical differences between treatments within each sampling event (P<0.05). * and ** represent statistically significant difference at P<0.05 and P<0.001, respectively; ns, no significance.
Our study showed that continuous NT altered soil aggregation and the aggregate-associated C concentration and thus affected the amount and location of maizederived C incorporation. NT increased the proportion of macroaggregates (>2 mm and 0.25-2 mm) and the MWD with time, indicating that NT improved soil structure quality.The SOC concentration within macroaggregates (>2 and 0.25-2 mm) was increased in NT, which suggests that NT provides favorable conditions for C accumulation in macroaggregates. In addition, the highest proportion of13C-labeled straw-derived C was observed in the >2 mm fraction, and this proportion was lower in NT than that in CT soil. Overall, we conclude that NT increases the proportion of stable macroaggregates and the enrichment of C concentration within macroaggregates, and thus the physical protection provided by NT is beneficial for soil carbon sequestration under the continuous maize cropping system in semiarid regions of northern China.
Acknowledgements
We thank Prof. Denis Angers (Quebec Research and Development Centre, Agriculture and Agri-Food Canada)for his helpful comments on the manuscript. This study was partially supported by the National Natural Science Foundation of China (31171512) and the Central Publicinterest Scientific Institution Basal Research Fund, China(Y2017PT26).
 Journal of Integrative Agriculture2018年11期
- Journal of Integrative Agriculture的其它文章
- First report of Athelia bombacina causing postharvest fruit rot on pear
- Sustainability assessment of potato fields using the DEXi decision support system in Hamadan Province, lran
- Effect of long-term continuous cropping of strawberry on soil bacterial community structure and diversity
- Alternate row mulching optimizes soil temperature and water conditions and improves wheat yield in dryland farming
- Mycoplasma leachii causes polyarthritis in calves via the blood route but is not associated with pneumonia
- Genome-wide detection of selective signatures in a Duroc pig population