
Genetic Function Approximation Based QSPR Models for Predicting the Wetting Ability of Lubricants onto Rolled Copper Foil Surface
2018-07-23 02:31XiongSangSunJianlin
中国炼油与石油化工 2018年2期
Xiong Sang ; Sun Jianlin
(1. College of Materials Engineering, Nanjing Institute of Technology, Nanjing 211167;2. Jiangsu Key Laboratory of Advanced Structural Materials and Application Technology, Nanjing 211167;3. School of Materials Science and Engineering, University of Science and Technology Beijing, Beijing 100083)
Abstract: The contact angle phenomena and wetting behavior of fatty acids, alcohols and ester used as additives in lubricants onto the rolled copper foil (RCF) surface were studied by the static sessile drop method. Semi-empirical quantum-chemical method studies on the contact angle of these compounds onto surface using several structural parameters were carried out. Molecular refractivity as well as several structural parameters were adopted in the development of quantitative structure-property relationships (QSPR) using genetic function approximation (GFA) statistical analysis method. The results show that quantum parameters are a better choice when predicting the contact angle and wettability of lubricants onto the RCF surface. Contact angle of the compounds serves as a function of their viscosity, interfacial tension, and physicochemical parameters. AlogP, molecular refractivity, molecular flexibility, total molecular mass, solvent surface area, element count, total energy and dipole are the most sensitive ones among the major contributing parameters. Notably, studies of lubricants on the RCF surfaces allow wetting theories to be tested down to the microcosmic scale, which can bring about new insight to predict wettability of lubricants onto RCF surface.
Key words: lubricants; wetting; contact angle; modelling; QSPR
1 Introduction
The structure–property relationship between the individual chemical property and its molecular structure parameters can be used to estimate the molecular properties according to the research of Zaifoglu[1]and Lee[2]. These molecular properties include molecular refractivity, molecular flexibility, total molecular mass,solvent surface area, element count, total energy, dipole,interfacial tension, electronic parameters (such as the lowest unoccupied molecular orbital), and thermodynamic parameters[3-5]. Typically, the construction of the optimized model is based on the fundamental equations which, in some way, can define wetting properties as a function of physical and chemical parameters of the molecules. This type of approach is not only useful for predicting the properties of the molecules under various conditions, but is also convenient for calculating the other performance of samples by this method[6]. Wettability is a very complex phenomenon, since it depends among others also on characteristics of the solid surface. Wettability describes the attempt of a solid to form a common interface with a liquid which comes into contact with it. Recently, many new experimental techniques such as the atomic force microscope and the confocal laser scanning microscopy,the chemical force microscopy, and the force volume technique have been applied to reveal the intrinsic nature of surface wettability[7-8]. An electrochemical model based on the augmented Young-Laplace equation is established,but it can provide little insight into the actual nature of wettability[9-10]. A more accurate and predictive wetting ability model of lubricants onto the rolled copper foil surface needs to be established in order to accelerate the design of additives. One measure of the wettability by a particular liquid is the contact angle. According to Asmussen[11], the smaller the viscosity of lubricants, the smaller the contact angles of lubricants onto the metal surface, which indicates the better wetting performance.Contact angle and viscosity are the main index of rolling oils to represent their wetting performance onto the metal surface. Molecular descriptors of inhibitors have been successfully used to characterize the inhibition of mild steel corrosion[6]. Therefore, using molecular structure parameters such as contact angle and viscosity to build the models of molecular activity for estimating the wetting properties are applicable.
Genetic function approximation (GFA) as a kind of statistical modeling algorithms is used to construct the functional model[12]. Several applications of GFA in the field of quantitative structure-property relationship(QSPR) models have been studied for a long time[13-14].Katritzky[14]has reported that the correlation and quantitative prediction of chemical and physical properties from structure are effective. In the present work we carried out detailed theoretical investigations of additives including fatty acids, alcohols and ester to estimate their viscosity, interfacial tension and the contact angles on rolled copper foil (RCF) surfaces at room temperature using GFA method. For such a large set of molecules, the collection of these data offered an unequaled opportunity for exploring the correlations between all possible models related with the wetting behavior and molecular properties.
2 Experimental
2.1 Raw materials
In this study, the general extreme pressure antiwear and anticorrosion additives, which have been widely applied in metal working recently, were used. Chemical reagents serving as additives such as 1-dodecanol, dodecyl dodecanoate, dodecan-1-amine, and their derivatives were used in experiments, with their properties shown in Table 1. The measured lubricants were studied by using 50% (mass fraction) of additives blended into mineral base oil. All additives were added into the base oil under stirring for 20 minutes at 70 °C, respectively. The rolled copper foil (RCF), 0.18 mm in thickness, was used. All chemical reagents used in the whole experiment were all analytically pure reagents (AR).

Table 1 Wetting properties of surfactants
2.2 Tests on the section of lubricants
Viscosity is an important indicator of lubricants on the wetting performance of the relevant material. The viscosity of a fluid is a measure of its resistance to gradual deformation by shear stress or tensile stress. The test viscometers with various diameters were chosen to measure the viscosity of lubricants both at 40 °C and at 100 °C, respectively, according to the national standard GB/T 265―1988 (similar to the test standard of ASTM D445-96[15]). Upon considering the viscosity values being inversely proportional to the temperature, the corresponding viscosity value at any temperature can be calculated according to the double-logarithmic formula[16]:

whereCandKare constants,Tis temperature in Kelvin andmis thev-Tline slope. Then we can calculate the viscosity values at 23 °C according to the above formula,with the results listed in Table 1.
The contact angle measurements were conducted on the same RCF surfaces. The treated copper samples were then dried with nitrogen gas, and the contact angle of a drop of lubricants on copper was measured by the static sessile drop method until the drops reached a static value in accordance with the ASTM D7334-2008 method. A goniometer (JC2000C4) with image processing software was used to calculate the mean contact angle of three measurements to comply with an accuracy of ±0.5°[17].Usually, it could take 3—5 s for each additive drop to reach this static value and all the lubricants could reach the static value when the time was nearly up. The volume of a drop of the sample was 0.125 mL. Duplicate experiments were carried out under each test condition at 23 °C, and different areas on each sample were profiled to ensure reproducibility of the measurements reported therewith. Figure 1 shows the schematic diagram of contact angle (θ) of the lubricant sample onto the RCF surface according to Young’s equation[17],
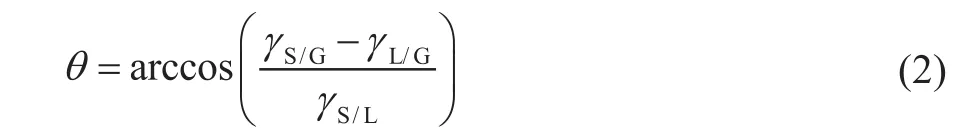
whereθis the contact angle (°),γL/Gis the interfacial tension of lubricant (mN/m),γS/Gis the interfacial tension of copper (mN/m) andγS/Lis the interfacial tension between the lubricant and copper (mN/m). Generally, if the contact angle is smaller than 90°, the solid surface is considered to have a high wettability and if the contact angle is larger than 90°, the solid surface is considered to have a low wettability. Interfacial tension is the elastic tendency of a fluid surface, which makes it acquire the least surface area possible. Interfacial tensions of lubricants were tested according to the test standard of ASTM D1331-14 using the du Noüy ring method.

Figure 1 Schematic diagram of contact angle
Upon supposing that a certain lubricant is spreading onto the RCF surface, the initial surficial area of lubricant before spreading can be ignored as compared to the area after spreading. Under a certain temperature and pressure conditions, the unit area of Gibbs free energy of lubricant during the spreading process is expressed as follows,

2.3 Semi-empirical quantum-chemical calculations
Semi-empirical quantum-chemical calculations of the molecules were carried out using the density functional theory (DFT) within the generalized gradient approximation (GGA) using the Perdew-Wang exchangecorrelation functional (PW91) as implemented in the Dmol3software package. The genetic function approximation (GFA) algorithm is used to build the quantitative structure-property relationship (QSPR)models and the detailed calculation information has been reported in previous studies[18]. It provides, through study of the evolving models, additional information which is not available from the standard regression analysis, such as the preferred model length and useful partitions of the data set[19]. These possible QSPR models are given using the lack-of-fit (LOF) score to estimate the fitness of each model[19]and this method for building model has proved to be beneficial to exploration of the highly predictive QSPRs[20].
3 Results and Discussion
The wetting performance of the lubricants onto the RCF surface measured by the goniometer tests and their experimental errors after a series of the same tests is given in Table 1. The contact angle is conventionally measured through the liquid, in which a liquid/vapor interface meets a solid surface. It quantifies the wettability of a solid surface by a liquid via the Young equation. It can be seen from Table 1 that various types of additives and polar groups of molecules exhibit markedly different properties arising from collisions between neighboring particles in a fluid. As for the same types of additives, it is observed that the viscosity increases with the hydrocarbon chain length and can thereby lead to the reduction of contact angle at the same time. The wetting behavior of lubricants onto the RCF surface is affected by interfacial tension as well as by viscosity. Droplets are formed when the viscous drag acting on the dispersed phase by the continuous phase overcomes the interfacial surface tension of the fluid pair, or when the dispersed fluid is able to fill and plug the continuous channel causing a pressure differential to occur, which then causes the plug to shear off and form a droplet[21].
The molecular structure of amino/mercapto-containing additives with higher interfacial tension can exert greater attractive force on liquid molecules between each other on the RCF surface, so that the molecules cannot easily spread out and the contact angles are larger than those of carboxyl-containing additives. Compared to the organic compound that contains a carboxyl group (C(=O)OH)serving as the lubricant, the use of lubricants having alcohol groups (OH) at the ends of lubricant molecules can increase the contact angles, and the addition of alkyl group to COOH groups can also increase the surface wettability.Therefore the interfacial tension increases substantially and the contact angle becomes greater when the polar group (Additive 2 in Table 1) is esterified.
Table 2 shows the structure parameters for the studied 18 additives as well as their predicted values of contact angle, viscosity, and interfacial tension. The structure parameters presented in Table 2 includeAlogP, H bond acceptors (D), dipolez(P), molecular refractivity (φ),molecular flexibility (β), structural information content(SIC), information content (IC), bond information content(BIC), atomic composition (A), total molecular mass (λ),solvent surface area (S), element count (N), highest occupied molecular orbital (EHOMO), lowest unoccupied molecular orbital (ELUMO), and total energy(E) of the studied molecules. The QSPR parameterAlogPand the molar refractivity are calculated using the method described by Ghose and Crippen[21]. TheAlogPis the octanol/water partition coefficient, which is related to the hydrophobic character of the molecule[21]. The H bond acceptors is the number of hydrogen-bond acceptors[22]. The molecular flexibility index (β) is based on the structural properties that can prevent a molecule from being “infinitely flexible”, the model for which is an endless chain of C(sp3)atoms[23]. The dipolezis the dipole moment about theZaxis[24]. The information content (IC) is the index corresponding directly to this partition[25]. The bonding information content (BIC) is the normalization of IC over the number of bonds counting bond orders, and the structural information content (SIC) is also the normalization of IC over the number of vertices[25]. The molecular refractivity index of a substituent is a combined measure of its size and polarizability[26]. In this atom-based approach, each atom in the molecule is assigned to a particular class,with additive contributions assigned to the total value ofAlogPand the molar refractivity[26]. The molecular area is the van der Waals area of a molecule that determines the extent to which a molecule exposes itself to the external environment[27]. The solvent surface area is the locus of the probe center as the probe rolls over the scaled van der Waals surface, and the element count is the total number of atoms of specified type in the structure[27]. The adhesion of the molecules on the RCF surfaces can occur due to the donor–acceptor interactions between a vacant d-orbital of metal surface atoms andπ-electrons of the molecules[28].EHOMOandELUMOare the electron-donating and electronaccepting ability of the molecule according to the frontier orbital theory, respectively[28]. And a low value ofELUMOshows the tendency to accept electrons to the donor molecules with empty high-energy molecular orbitals. LowerELUMOvalues indicate the enhanced adhesion ability and wetting properties[21]. The structural features, which are considered to be capable of preventing a molecule from attaining infinite flexibility, refer to: fewer atoms, the presence of rings, branching and the presence of atoms with covalent radii smaller than those of C(sp3)[29-30].It can be seen from the values of the structure parameters listed in Table 2 that the various polar groups of the molecules (such as additives 1, 5 and 8, additives 14 and 15) have different values of each structural parameter and stability of the molecules. As for the same types of molecules (such as additives 6 and 7, additives 12 and 13), it
is obvious that the molecular flexibility, dipole moment,molecular refractivity, surface area, total molecular mass,SIC, total energy, polarization, and electron-accepting ability of the molecules increase with an increasing carbon chain length of molecules. The variability in electron-donating ability and octanol/water partition coefficient of the molecules follow the opposite tendency, and the trend was not very obvious. By increasing the dipole moment and the polarity of molecular bond, their corresponding values of the molecules will increase[31-32]. The adsorption energy of the molecules onto the metal surface will most likely increase with the dipole moment and polarization of molecules, and the adsorption ability will also increase[33]. With the increase in carbon chain length of the molecules, the adsorption ability of the molecules has improved, so that the viscosity and the contact angle will decrease, and the interfacial tension will increase[34].The statistical analysis of molecular wetting properties was performed by GFA method in order to build the quantitative structure-property relationship (QSPR) models.First of all, a univariate analysis of the additives data was conducted on the contact angle, interfacial tension and viscosity and was listed in Table 3 to evaluate the reliability of these data and to verify whether they are suitable for next statistical analysis. Skewness presents the symmetry of the distribution and the results in Table 3 shows the distribution of data values within the column, which is ‘skewed’ toward positive values. If the kurtosis is positive, the distribution of data in the column is more sharply peaked than a normal distribution[18]. If the kurtosis is negative, the distribution is flatter than a normal distribution[22]. The kurtosis data in Table 3 indicate the profile of the column of data relative to a normal distribution.
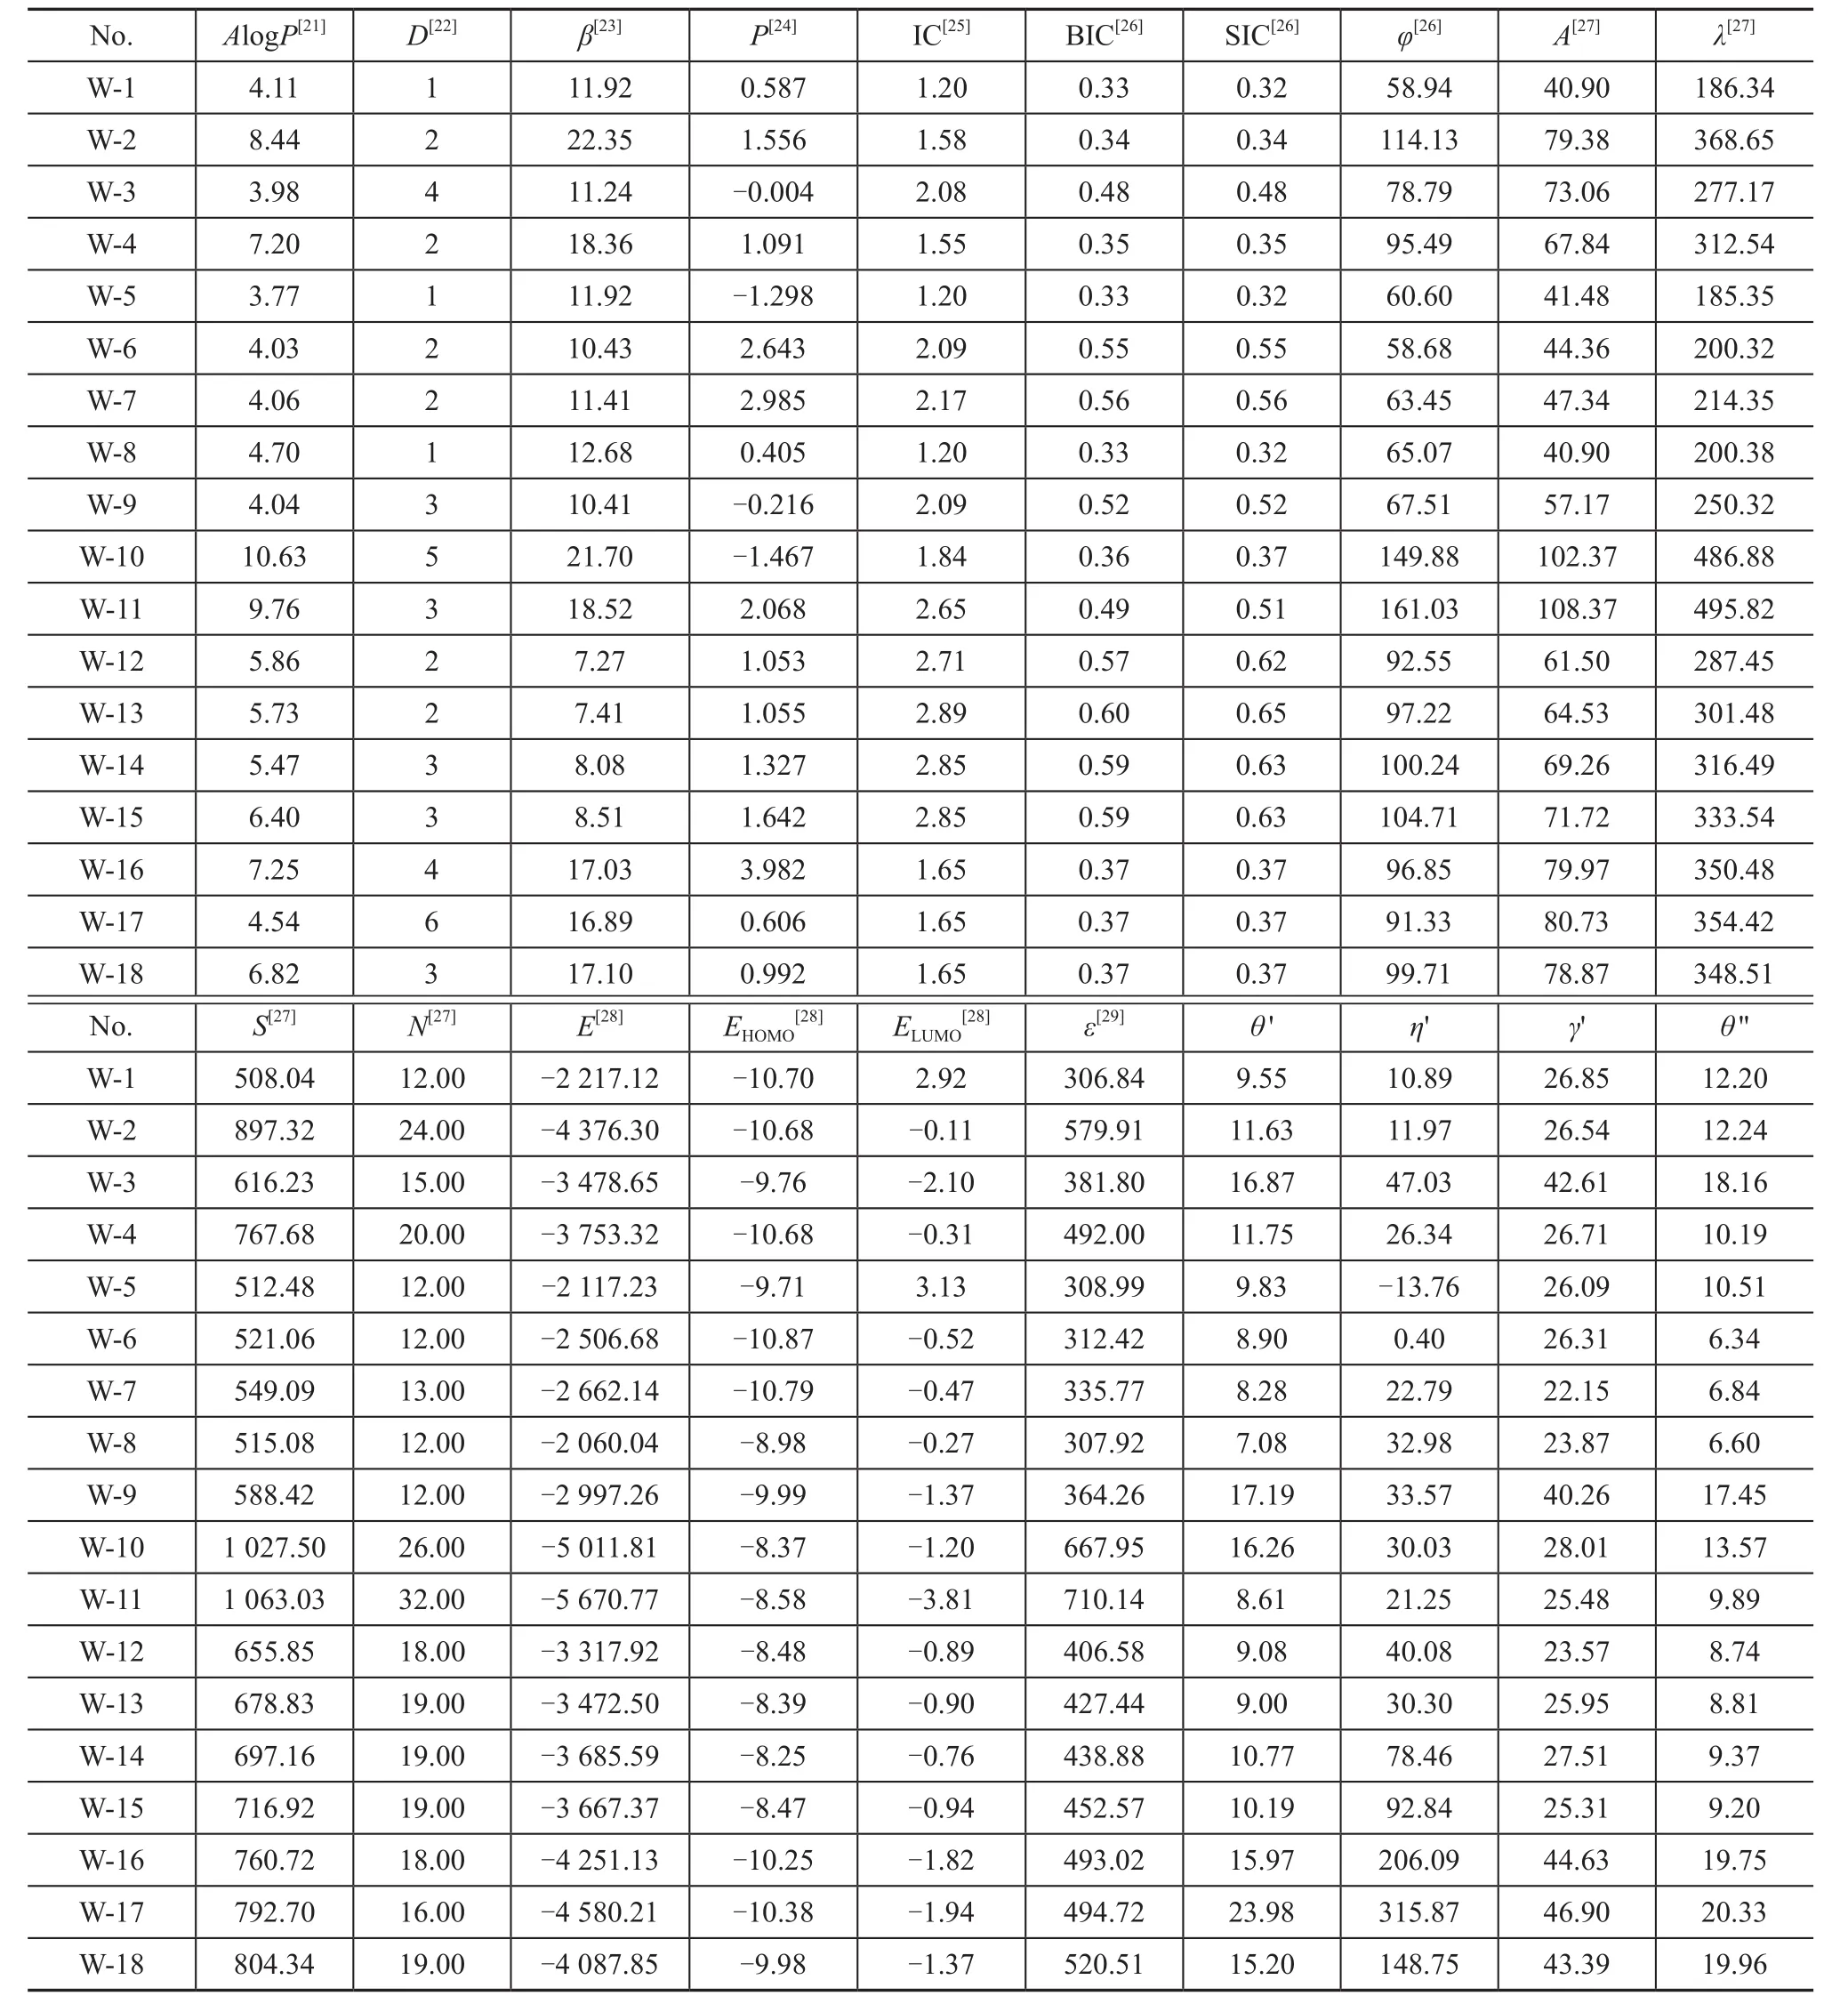
Table 2 Structure parameters for the studied 18 additives calculated using quantum-chemical methods
In addttion, a correlation matrix among seven molecular description variables and wetting property parameters was derived, as presented in Table 4. In the meantime,the correlation coefficients between two variables were obtained. A correlation coefficient of 1.0 or -1.0 indicates that two variables are perfectly correlated, whereas a coefficient of 0 shows no correlation[19]. An inverse relationship between variables is shown by a negative coefficient[19]. The values of the correlation coefficients are higher, and the relationship between the molecular descriptors is the highly correlated pairs of variables. Itcan be seen from Table 4 that the interfacial tension is most highly correlated with the contact angle.

Table 3 Univariate analysis of the lubricants data
Regression analysis must be performed after constructing the correlation matrix. The GFA algorithm itself can apply these ideas to the problem of function approximation to yield a large number of potential factors that can influence a response, including several powers and other functions of the raw inputs, to find the subset of terms that can best correlate with the response[14]. Three steps are executed iteratively in succession, viz.: selection, crossover, and mutation[19]. The scoring criteria for QSPR models are all associated with the reliability of the regression data by GFA algorithm according to a fitness criterion, with the detailed GFA analysis given in Table 5. The Friedman‘s LOF score as a evaluation criterion for assessing the accuracy of QSPR model andFvalue also gives the significant regression. The higher theFvalues are, the more accurate the GFA model would be.
Figure 2 shows the relationships between the measured contact angles (θ, molecular structure parameters), viscocity (η, molecular structure parameters), interfacial tension (γ, molecular structure parameters) and contact angles (θ‘, as a function of viscosity, interfacial tension and other molecular structure parameters) of the studied molecules in Table 2. The predicted values of QSPR models calculated by the GFA equations are described by the following expressions:


Table 4 Correlation martix of seven variables

Table 5 Validation table of the genetic function approximation

whereζis the octanol/water partition coefficient (AlogP),Cis the information content (IC),Bis the bond information content (BIC),Sis the solvent surface area (Å2),Nis the element count,Pis the dipole z (e Å),Eis the total energy (kcal/mol),φis the molecular refractivity (m3/mol),βis the molecular flexibility (m3/mol),εis the structural information content (SIC),λis the total molecular mass (g),εis the structural information content (SIC),Dis the hydrogen bond acceptor,Ais the atomic composition, andELUMOis the LUMO eigenvalue (eV).
Figure 2 also shows a scatter plot of the residual values and the measured contact angles, viscocity values and interfacial tension values of the studied molecules. In the GFA, the measured values of QSPR model minus the predicted values are the residual values. It can be seen from Figure 2 (b) and (c) that the viscocity values and interfacial tension values of lubricants are highly correlated with the molecular structure parameters, since the R-squared ones are all above 0.95. Therefore, the quantum structure parameters are a better choice for predicting the viscocity and interfacial tension of lubricants. Upon comparing Figure 2 (a) with (d), it is obvious that the contact angle as a function of viscosity and interfacial tension is more appropriate than other indicators.
The QSPR models generated by outlier analysis will give two kinds of plots: the first is a scatter plot of residual values plotted against the predicted values and the second is a plot of residual values against the row number of the observation, with the results presented in Figure 3. The left-hand plots (Figure 3 a, c, e, and g) contain the residual values plotted against the predicted contact angles, viscocity values, interfacial tension values, and contact angles(acting as a function of viscosity and interfacial tension),respectively. The right-hand plots (Figure 3 b, d, f, and h)show the residual values plotted against the row number,respectively. Optionally, a model is added to the study table to signify whether the observations are considered to be outliers according to the parameters specified in Figure 3.These plots and models are produced for each of the prediction variables selected thereby and they serve as a good test of the QSPR models to identify outliers[20]. In mathematical or statistical modelling, a critical threshold model is any model where a critical threshold value, or a set of critical threshold values, is used to distinguish the range of values where the behavior predicted by the model varies in some important way[20]. The critical threshold of the model is based on the literature reports and calculations[21,23]. Each chart contains a dotted line that indicates the critical threshold of two standard deviations beyond which a value may be considered to be an outlier. In general, all of the predicted values within the limits of critical threshold denote that the model is accurate[35]. Each graph in Figure 3 a, b,c, d, e, f, g, and h represents the critical threshold ranging from -2.5 to 2.0 with dashed lines, whereas an outlier is out of two critical thresholds of the average residual values. It can be seen from Figure 3 that there are no data that appear outside of the scope of the critical thresholds which indicate that the QSPR models are acceptable.

Figure 2 Plot of predicted contact angle as a function of molecular structure parameters (a), viscosity (b) and interfacial tension (c) as a function of molecular structure parameters, contact angle as a function of viscosity,interfacial tension and molecular structure parameters (d)and residuals versus measured lubricants

Figure 3 Outlier analysis for contact angle as a function of molecular structure parameters (a, b), viscosity (c, d)and interfacial tension (e, f) as a function of molecular structure parameters, and contact angle as a function of viscosity,interfacial tension and molecular structure parameters (g, h)
4 Conclusions
This paper uses the QSPR method to predict the wettability for lubricants by the contact angles, viscocity, and interfacial tension in dry laboratories. Compared with the experimental data, the calculation values of the contact angles, viscosity and interfacial tension from the QSPR models have demonstrated the effectiveness of the semiempirical quantum-chemical computational method. The mathematical models were adopted for GFA data fitting to process experimental data, and high correlation coefficients exceeding 0.97 were obtained. The forecast result indicated that the GFA method has a high forecast precision. It is also proved that the QSPR models estimations are extremely effective in evaluating the wetting properties of the lubricants and are helpful to predicting the wetting properties of the molecules, which have the similar structures onto the rolled copper foil surface. This work will provide a better understanding of the relationship among the different chemical structure parameters and propertites on wetting studies.
Acknowledgments:The authors gratefully acknowledge the financial assistance provided by the Introducing the Talent Research Start-up Fund (No.YKJ201706) and the National Natural Science Foundation of China (No. 51474025).Thanks are also extended to all individuals associated with the project.

- 中国炼油与石油化工的其它文章
- Denitrification of Coal Tar Diesel Fraction by Phosphate Imidazolium Based Polymeric Ionic Liquids
- Development and Application of Hydrocracking Catalysts RHC-1 /RHC-5 for Maximizing High Quality Chemical Raw Materials Yield
- Study of Isothermal Equilibrium, Kinetics and Thermodynamics of Adsorptive Desulfurization on Synthesized CuIYIIIY Zeolite
- Direct Conversion of Glucose to 5-Hydroxymethylfurfural over Zirconium Phosphate Catalyst in a Biphasic System
- Mass Transfer Characteristics of H2 and CO in Mimicked F-T Slurry Bubble Column Reactor
- An Approach for Preparation of Excellent Antiwear PTFE Nanocomposites by Filling As-prepared Carbon Nanotubes/Nanorods (CNT/CNR) Mixed Nano-Carbon Material