Effect of exclosure ages on woody plant structure,diversity and regeneration potential in the western Tigray region of Ethiopia
Tsegay Gebregerges•Zewdu K.Tessema•Emiru Birhane
Introduction
Ethiopia is endowed with a rich fauna and flora diversity due to its diverse agroecology,soils and topographic conditions andhasoneofthemostextensiveforestresourcesintheHorn of Africa.While high forest cover is only 3.5%,woodlands,shrublands and bush lands contribute about 45.0%of the landmasscover(FAO2010).Combretum–Terminalia,broadleaved deciduous dry forests,and Vachellia–Commiphora,small-leaved woodlands,are the two most prominent dry forest resources in the lowlands,both socioeconomically and ecologically(Eshete et al.2011;Groenendijk et al.2012).
These dryland forest formations are key ecological components of several major landscapes of Ethiopia,including the Blue Nile River Basin,and support unique native biodiversity(Teketay2005;Awas 2007),including those producing gums and resins(Eshete et al.2011;Lemenih and Kassa2011).Moreover,mostdrylandareasofEthiopiaserve as extensive grazing lands to large livestock populations.However,remnant vegetation resources in dryland parts of the country are facing intensive degradation triggered by deforestation,the expansion of agricultural lands,sustained heavy grazing(Mengistu et al.2005),and other anthropogenic factors(Lemenih and Bongers 2011;Worku et al.2012),leading to severe habitat degradation,declining soil and water resources,and loss of biodiversity.In arid and semi-arid woody grasslands,sustained heavy grazing and browsing are some of the most destructive factors of woody vegetation which can destroy the structure and composition of plant communities(Yayneshet et al.2009).
Rehabilitation of degraded woody grasslands through the establishment of grazing exclosures has become increasingly important in arid and semi-arid areas of the world.Exclosures are areas protected from human and domestic animal interferences,and allow the regeneration of native vegetation to reduce soil erosion,increase rain water in filtration and provide fodder and woody biomass on degraded communal grazing lands(Aerts et al.2009;Mekuria et al.2011;Seyoum et al.2015).Studies in the highlands of Ethiopia(Yayneshet et al.2009;Mekuria et al.2011)showed that putting degraded grazing lands under exclosures can be effective in enhancing the composition,diversity,height and cover of woody vegetation.However,these studies are insufficient to permit the extrapolation of the findings at large scales due to diverse agroecological,soil and topographic conditions.Moreover,information on woody vegetation structure,diversity and regeneration potentials of exclosures established in the semi-arid lowlands of Ethiopia is lacking,compared to the highland parts of the country.The grazing exclosures used in this study were established in 2005 and 2010 in the lowlands of the Tigray region in northern Ethiopia.The objectives were to:(1)assess woody plant diversity and abundance between the 5-and 10-year grazing exclosures compared with open grazed lands;(2)determine the density,frequency and importance value index of woody species;(3)determine the population structure and regeneration potentials of woody species in areas excluded from grazing and in open grazing lands.
Materials and methods
Study area
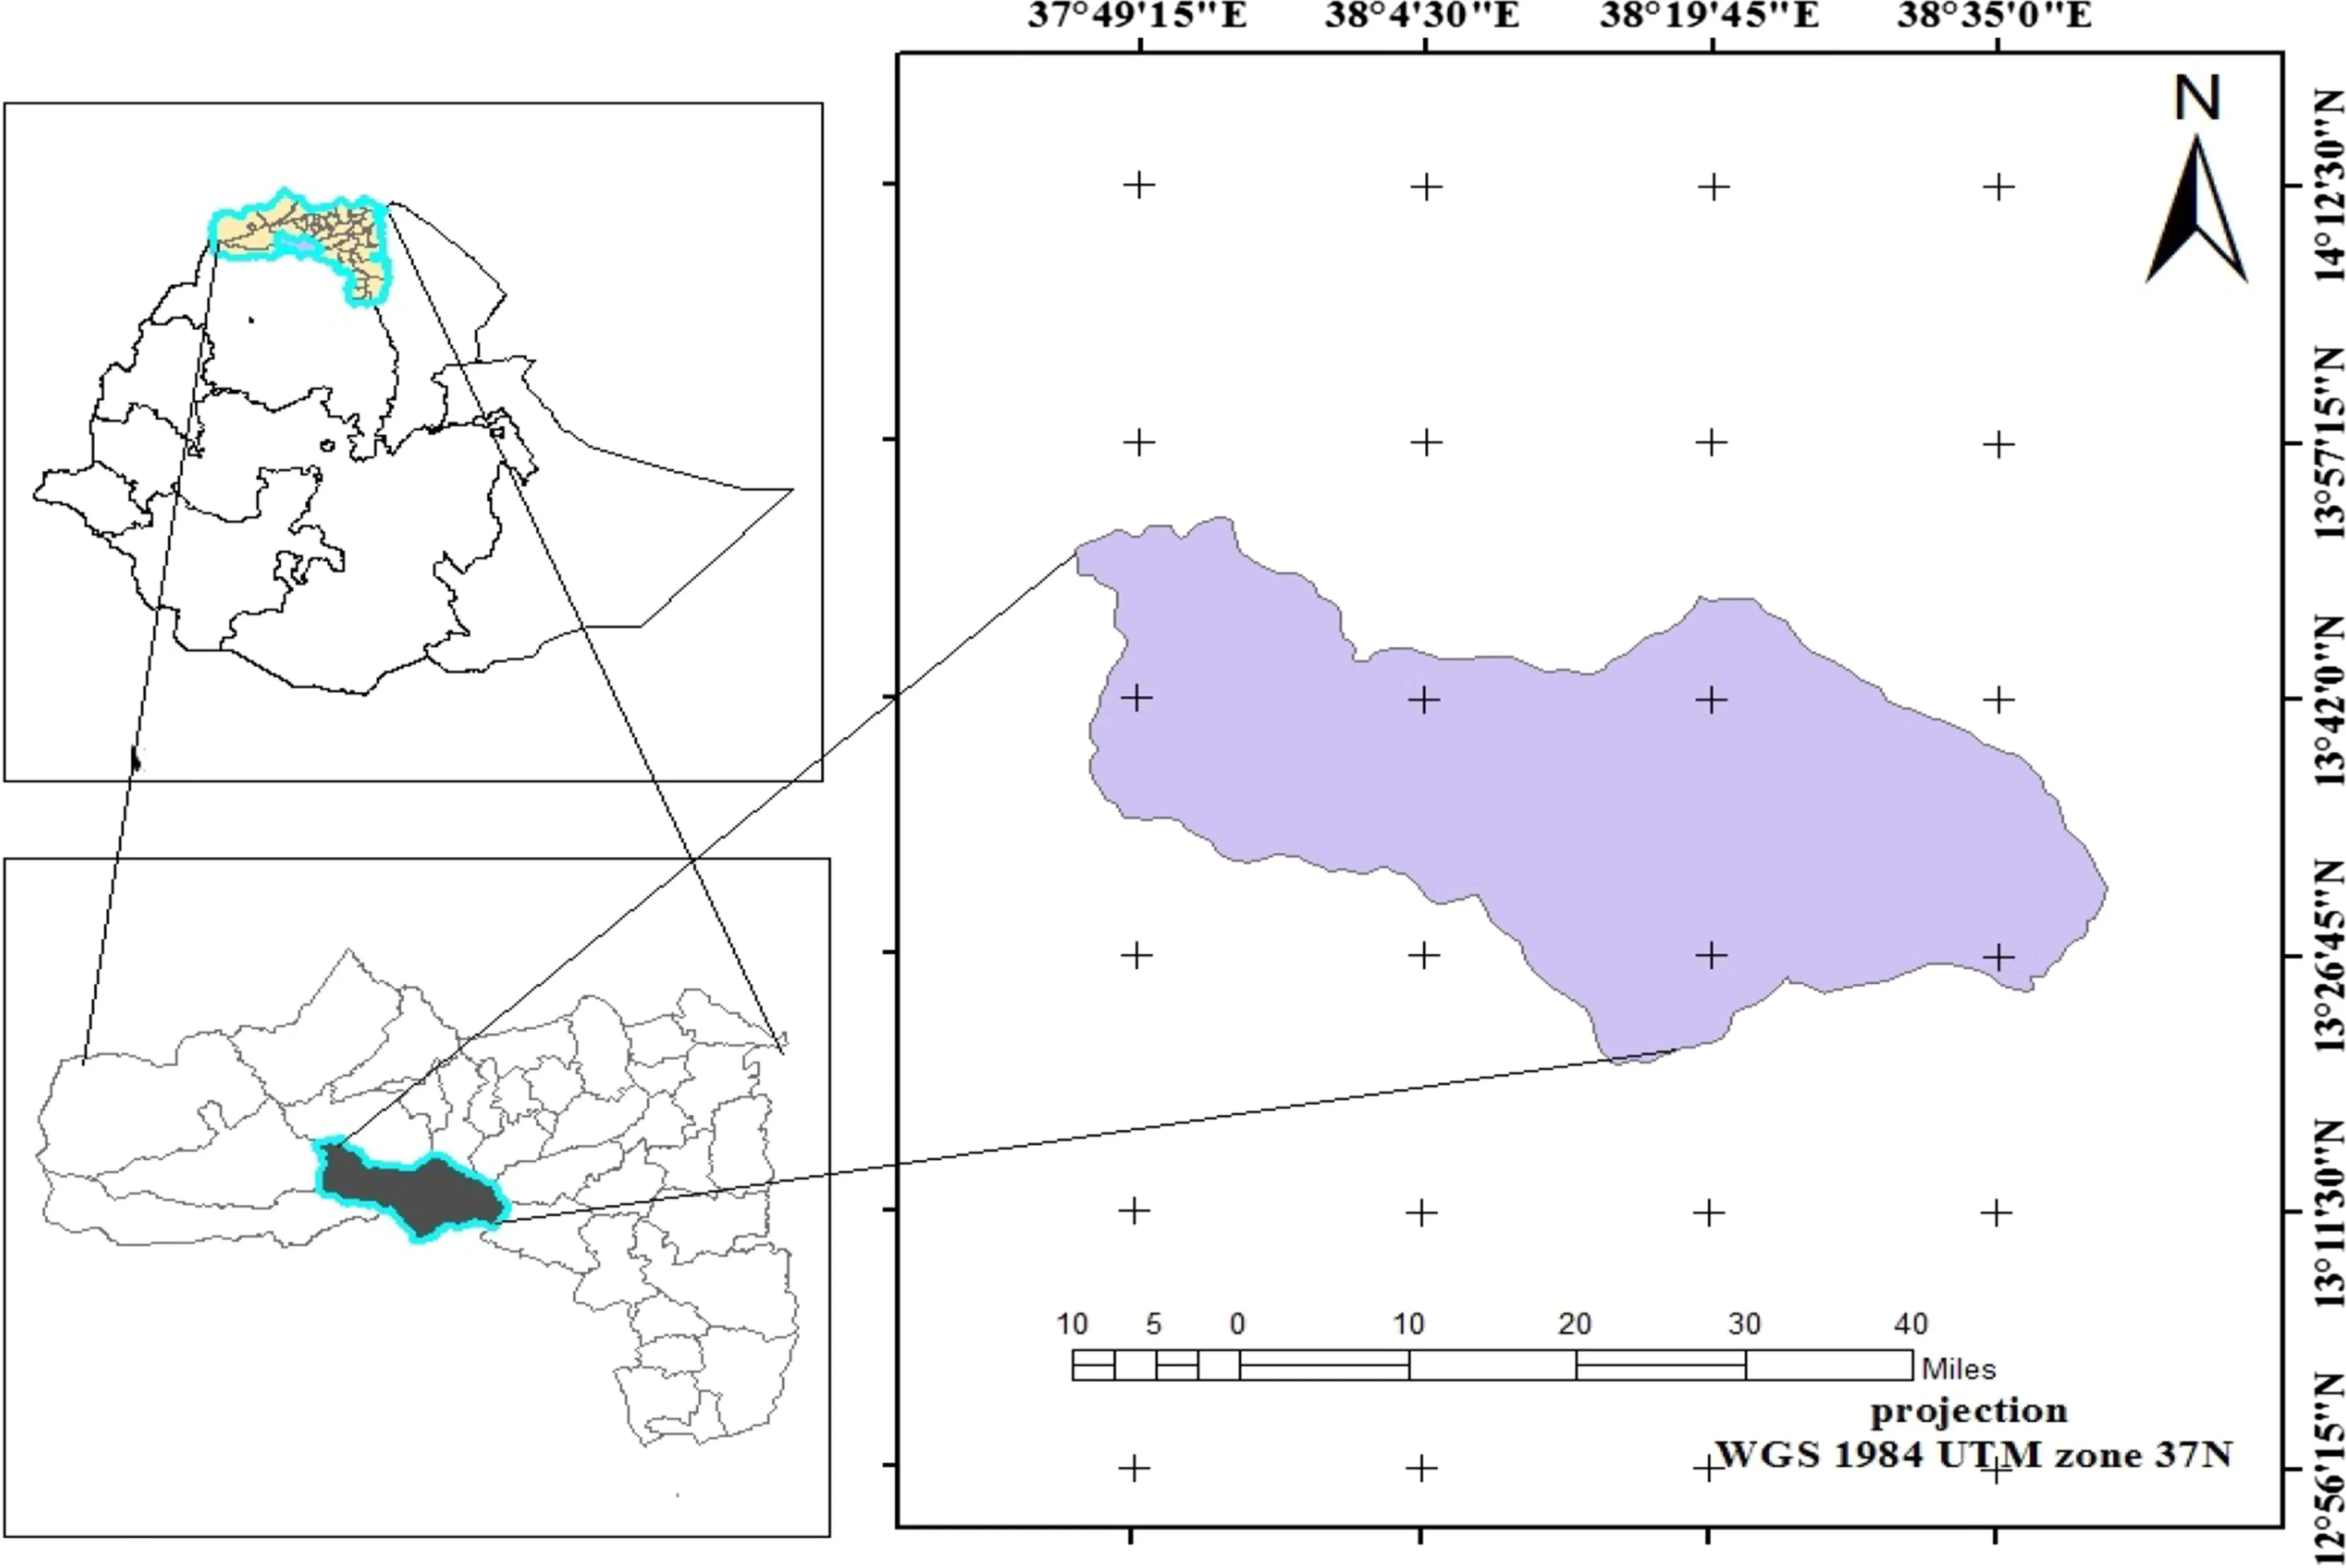
Fig.1 Study area in the Tselemti district of north western Tigray,Ethiopia
The study sites were located in the semi-arid areas of Tselemti district in the northwestern part of Tigray at 13°05′N Latitude and 38°08′E Longitude(Fig.1).The landscape is characterized by undulating hills, flat plateaus,mountains,valleys and some immediate break of slopes,with altitudes of 800–2870 m asl.Mean maximum temperatures vary from 33.0 °C in April to 41.7 °C in May,while mean minimum temperatures range from 15.8 to 21.7°C in December and May,respectively.The dry season occurs between November and May,the rainy season between June and September,and follows a unimodal rainfall pattern with mean annual rainfall of 1141.5 mm.The vegetation covered is Combretum–Terminalia and Vachellia–Commiphora woodlands,characterized by small to moderate-sized drought-resistant trees and shrubs with large deciduous leaves.Anogeissus leiocarpus(DC)Guill&Perri,Dichrostachys cinerea(L.)Wight&Am,Dovyalis abyssinica(A.Rich)Warb,Oxythenanthera abyssinica(A.Rich)Munro,Boswellia papyrifera(Del).Hochst,Erytherina abyssinica(DC)andBalanites aegyptiaca(L.Del)are some of the dominant woody species.
Vegetation data collection
A reconnaissance survey identi fied open grazing lands and 5-and 10-year-old grazing exclosures for vegetation data collection.The exclosures and open grazing lands were considered to have similar conditions before the establishment of the exclosures(Mekuria et al.2011).Variability in soil and topography were homogenized by replicating each sampling site three times.Systematic transect sampling was employed to collect data.Edge effects were controlled by laying the first and last transect lines 100 m inside the margin of the adjacent grazing land.The first sample plot was laid randomly,followed by the others systematically at 100 m intervals along the transect lines.At each site,three parallel lines transects,each 1000 m long at 200 m distances from each other.Sampling plots 10 m×10 m were examined for woody vegetation from each transect(Mannetje and Jones 2000;Hassan et al.2013;Dabasso et al.2014).Data were collected from 270 plots(3 exclosure land management×3 sampling sites×30 sample quadrats;Fig.2)from the end of August-October 2015.All woody species in each plot were recorded and identi fied with the help of a taxonomist and knowledgeable elder farmers living around the study area.For plant nomenclature,we followed previous taxonomic studies(Fromman and Pearson 1974;Philips 1995;Bekele 2007).Kyalangalilwa et al.(2013)was used for the recently revised genusAcacia(Fabaceae:Mimosoideae).
The names of each species and their relative abundance were recorded and individuals taller than 50 cm and≥2.5 cm DBH (diameter at breast height)were measured for height and diameter.A hypsometer was used to measure heights and a caliper for DBH.For trees with DBH≥the caliper size,the circumference was measured and converted to DBH.In cases where the bole branched at breast height or below,diameters were measured separately and considered individual trees.The DBH for buttressed species was measured from the point just above the bole where the buttress began.To determine regeneration status,seedlings and saplings were counted for each species in each plot.A seedling was considered as those with a DBH≤2.5 cm and a height≤50 cm;a sapling was an individual with a DBH≥2.5 cm and a height≥1 m.
Data analyses
Vegetation data
Species richness(the number of species)in each plot was determined by adding up the number identi fied in the field directly and with the help of herbarium samples when necessary and analyzed for relative abundance,frequency,the Shannon-Weiner index of diversity,and density.Relative abundance was calculated based on the total number of individuals recorded in each plot(i.e.Individuals/total area of sampling plot).The wood density was determinedby converting the total number of individuals of each species in each plot along the line transects to an equivalent number per hectare.The relative density was the percentage of each individual species to the total number of each individual woody species to an equivalent number per hectare.
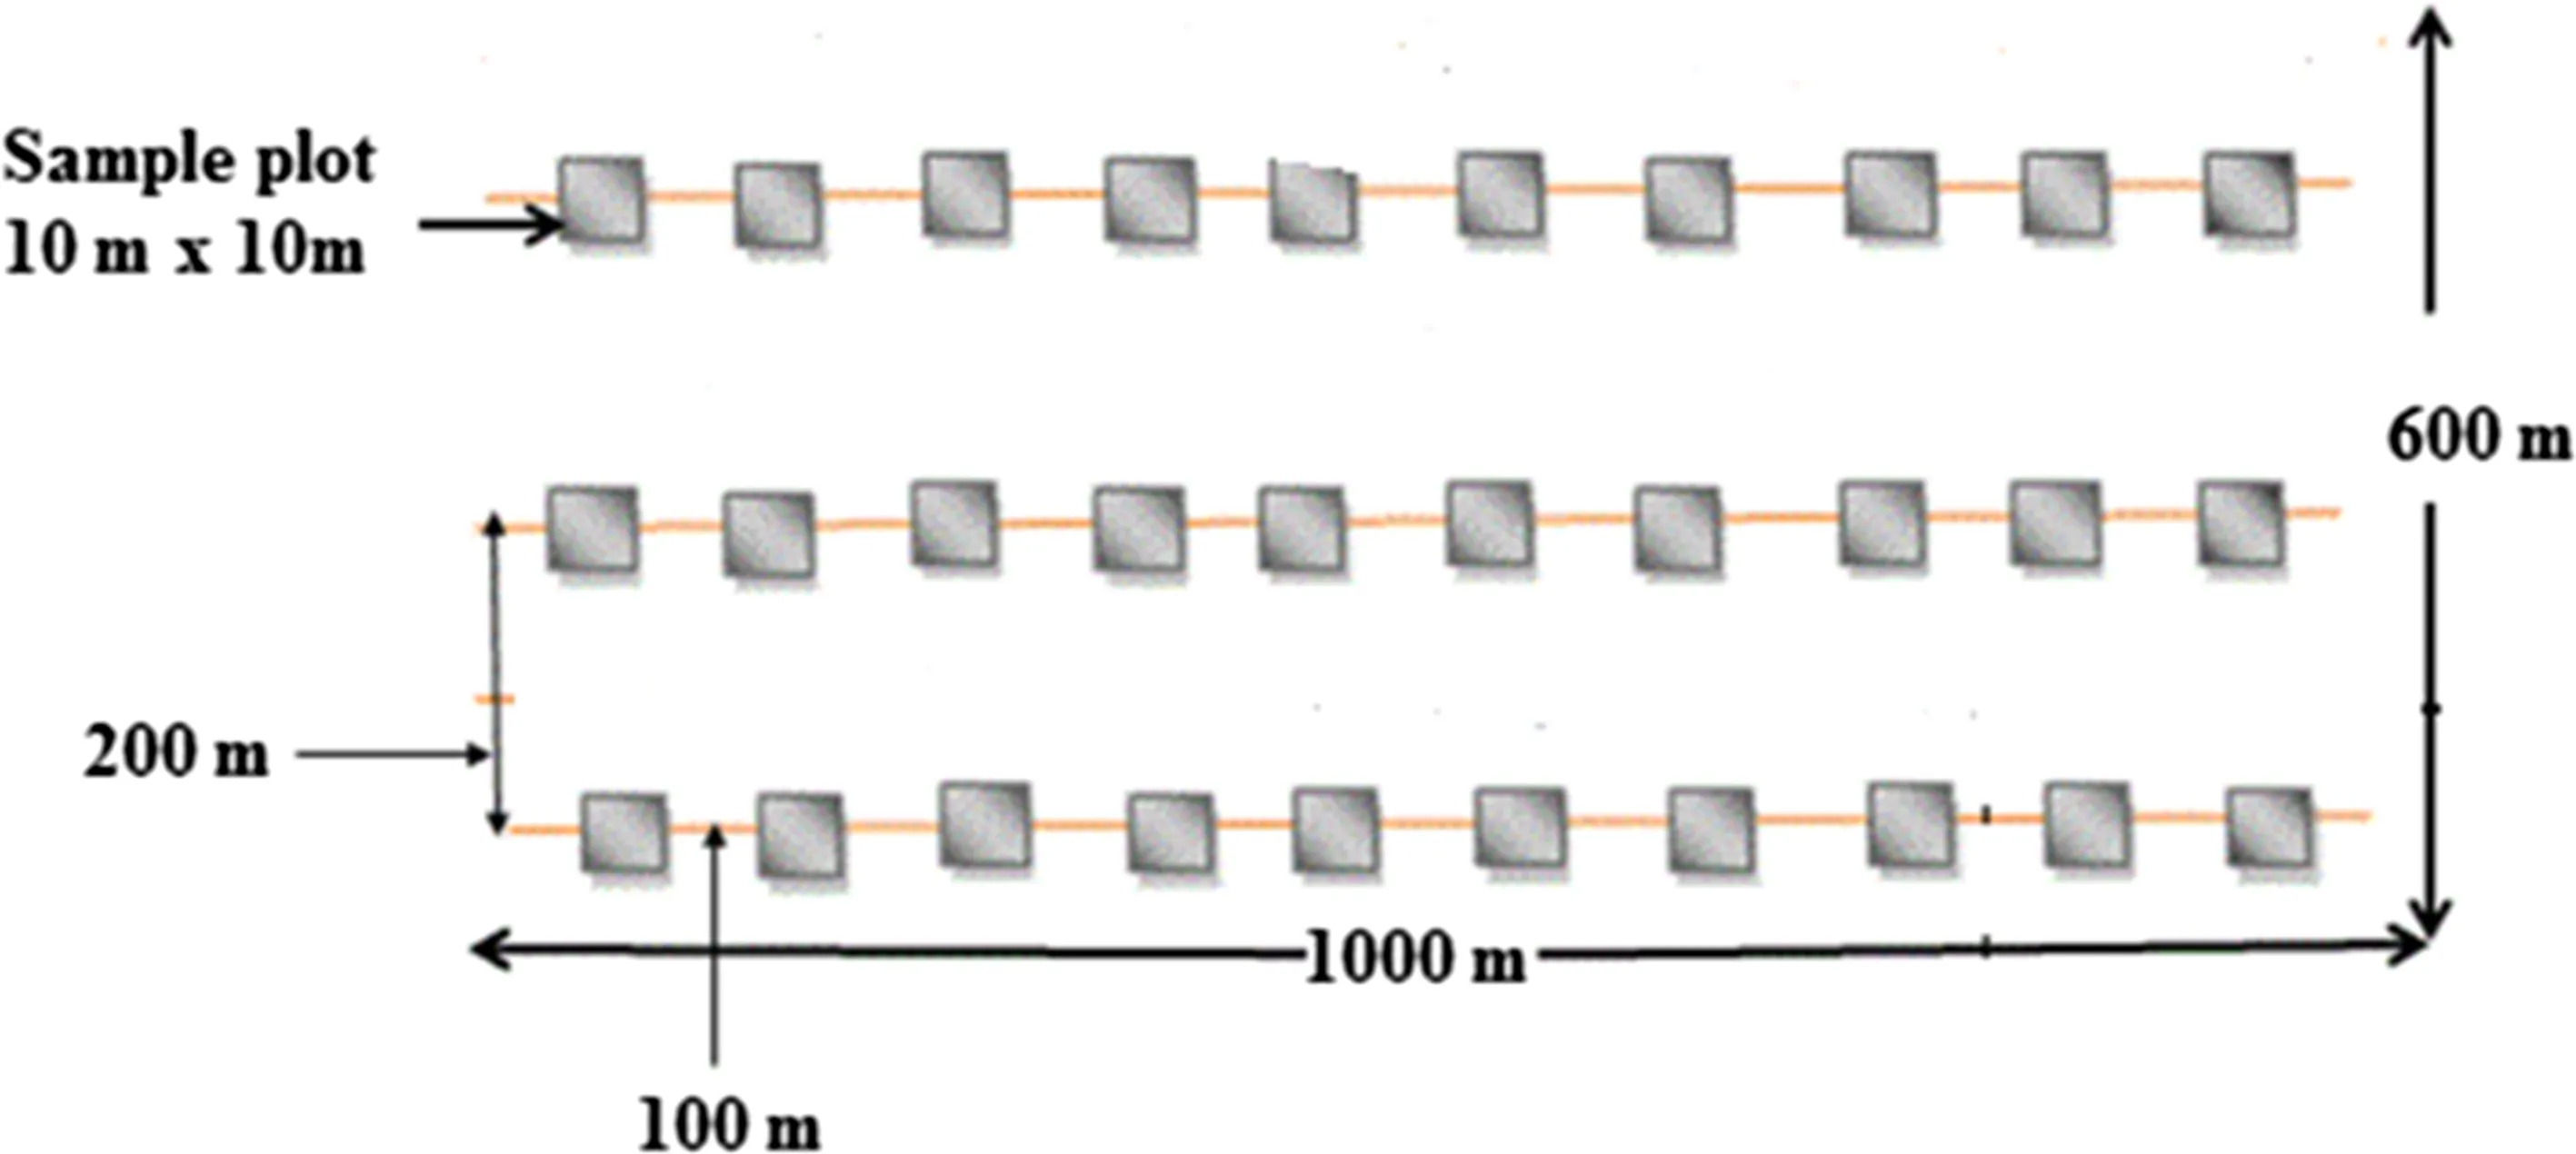
Fig.2 Diagram illustrating quadrat position in a 1000 m×600 m sampling site for recording seedlings,saplings and mature species(sampling sites were replicated three times within each exclosure with 30 sampling quadrats of 100 m2)
Frequency was calculated as the proportion(%)of the number of sampling plots in which each species was encountered from the total number of plots.The relative frequency of the individual species was computed relative to the total frequency of all species.Basal area(BA)of each species with DBH>2.5 cm was calculated according to Kent and Coker(1992).The absolute dominance of woody species with DBH>2.5 cm was determined from summing the BA of all individual species.Relative dominance was the percentage of the BA of one species divided by the total BA of all species.The relative ecological importance of each species,commonly referred to as important value index(IVI),was determined by summing its relative frequency,relative density and relative dominance of each species(Kent and Coker 1992).
Diversity,evenness and similarity analyses
Species diversity in 5-and 10-year grazing exclosures and on open grazing lands were calculated using the Shannon–Wiener(S–W)diversity Index(H′)according to Krebs(1994)and Magurran(2004):

wheresis the total number of species(species richness),Piis the proportional abundance of theith species isni/N,niis the number of individuals of the species,andNis the total number of all individuals.
The evenness(J)or equitability,a measure of similarity of the abundance of different species was analyzed using Shannon’s Evenness or Equitability Index(Krebs 1994;Magurran 2004):

where,Jis Evenness;H′is Shannon–Wiener(S–W)Diversity Index,andSis total number of species.
Evenness or equitability assumes a value between 0 and 1,with 1 representing a situation in which all species were equally abundance evenly distributed,and 0 represents complete absence of the species.To determine the similarity of species composition between exclosures and open grazing areas,the So˜rensen coefficient of similarity index(Sc)was used(Magurran 2004):

where,ais the number of species common to both sites,bis the number of species present in the first site and absent from the second,andcis the number of species present in the second site and absent from the first.The values ofScranged between 0 and 1,where 0 indicates complete dissimilarity and 1 complete similarity.
Population structure and regeneration status
The population structure and regeneration of the woody vegetation were assessed by measuring diameters and heights of species encountered in the sample quadrats.DBH and height data were placed into twelve and six classes,respectively.Population structure was determined through histograms constructed by using the average height and diameter classes of all species(cumulative data).The number of seedlings,saplings and mature species were compared to assess the regeneration potential of open grazing lands and grazing exclosures(Dhaulkhandi et al.2008;Tiwari et al.2010).
Finally,to test for differences in vegetation data,a General Linear Model(GLM)of SAS version 9.1(SAS 2002)was applied using age of exclosures as independent factors and sampling plots as random factors.The data were transformed with appropriate techniques to meet the assumptions of normality and homogeneity of variance prior to statistical analyses.
Results and discussion
Floristic composition
A total of 41 woody species belonging to 20 families were recorded;18 species represented 11 families,28 represented 14 families,and 38 species 17 families in open grazing lands,5-year and 10-year exclosures,respectively(Table 1).The Fabaceae was the most diverse family,composed of the highest number of species(31.7%),followed by the Combretaceae(9.8%).However,Anacardiaceae, Bignoniaceae, Celastraceae, Moraceae,Rhamnaceae and Rubiaceae families had equal numbers of species(4.9%).The remaining twelve families were each represented by only one species(Table 1).From all species recorded,25 were trees(61.0%)and 16 were shrubs(39.0%).In the open grazed areas,5 species were shrubs(27.8%)and 13 were trees(72.2%).In the 5-year exclosures,9 species were shrubs(32.0%)and 19 trees(68.0%).In the 10-year grazing exclosures,24 species were trees(63.0%)and 14 were shrubs(37.0%;Table 1).According to Mastewal et al.(2006),anthropogenic interferences such as grazing and deforestation may reduce the number of pioneer trees on the open grazing lands compared to the exclosures.The 10-year grazing exclosures had a higher species composition compared to the 5-year grazing exclosure and open grazing lands(Table 1).This variation in species composition among the exclosure land management practices could be as a result of differences in duration of protection from human and animal interferences.
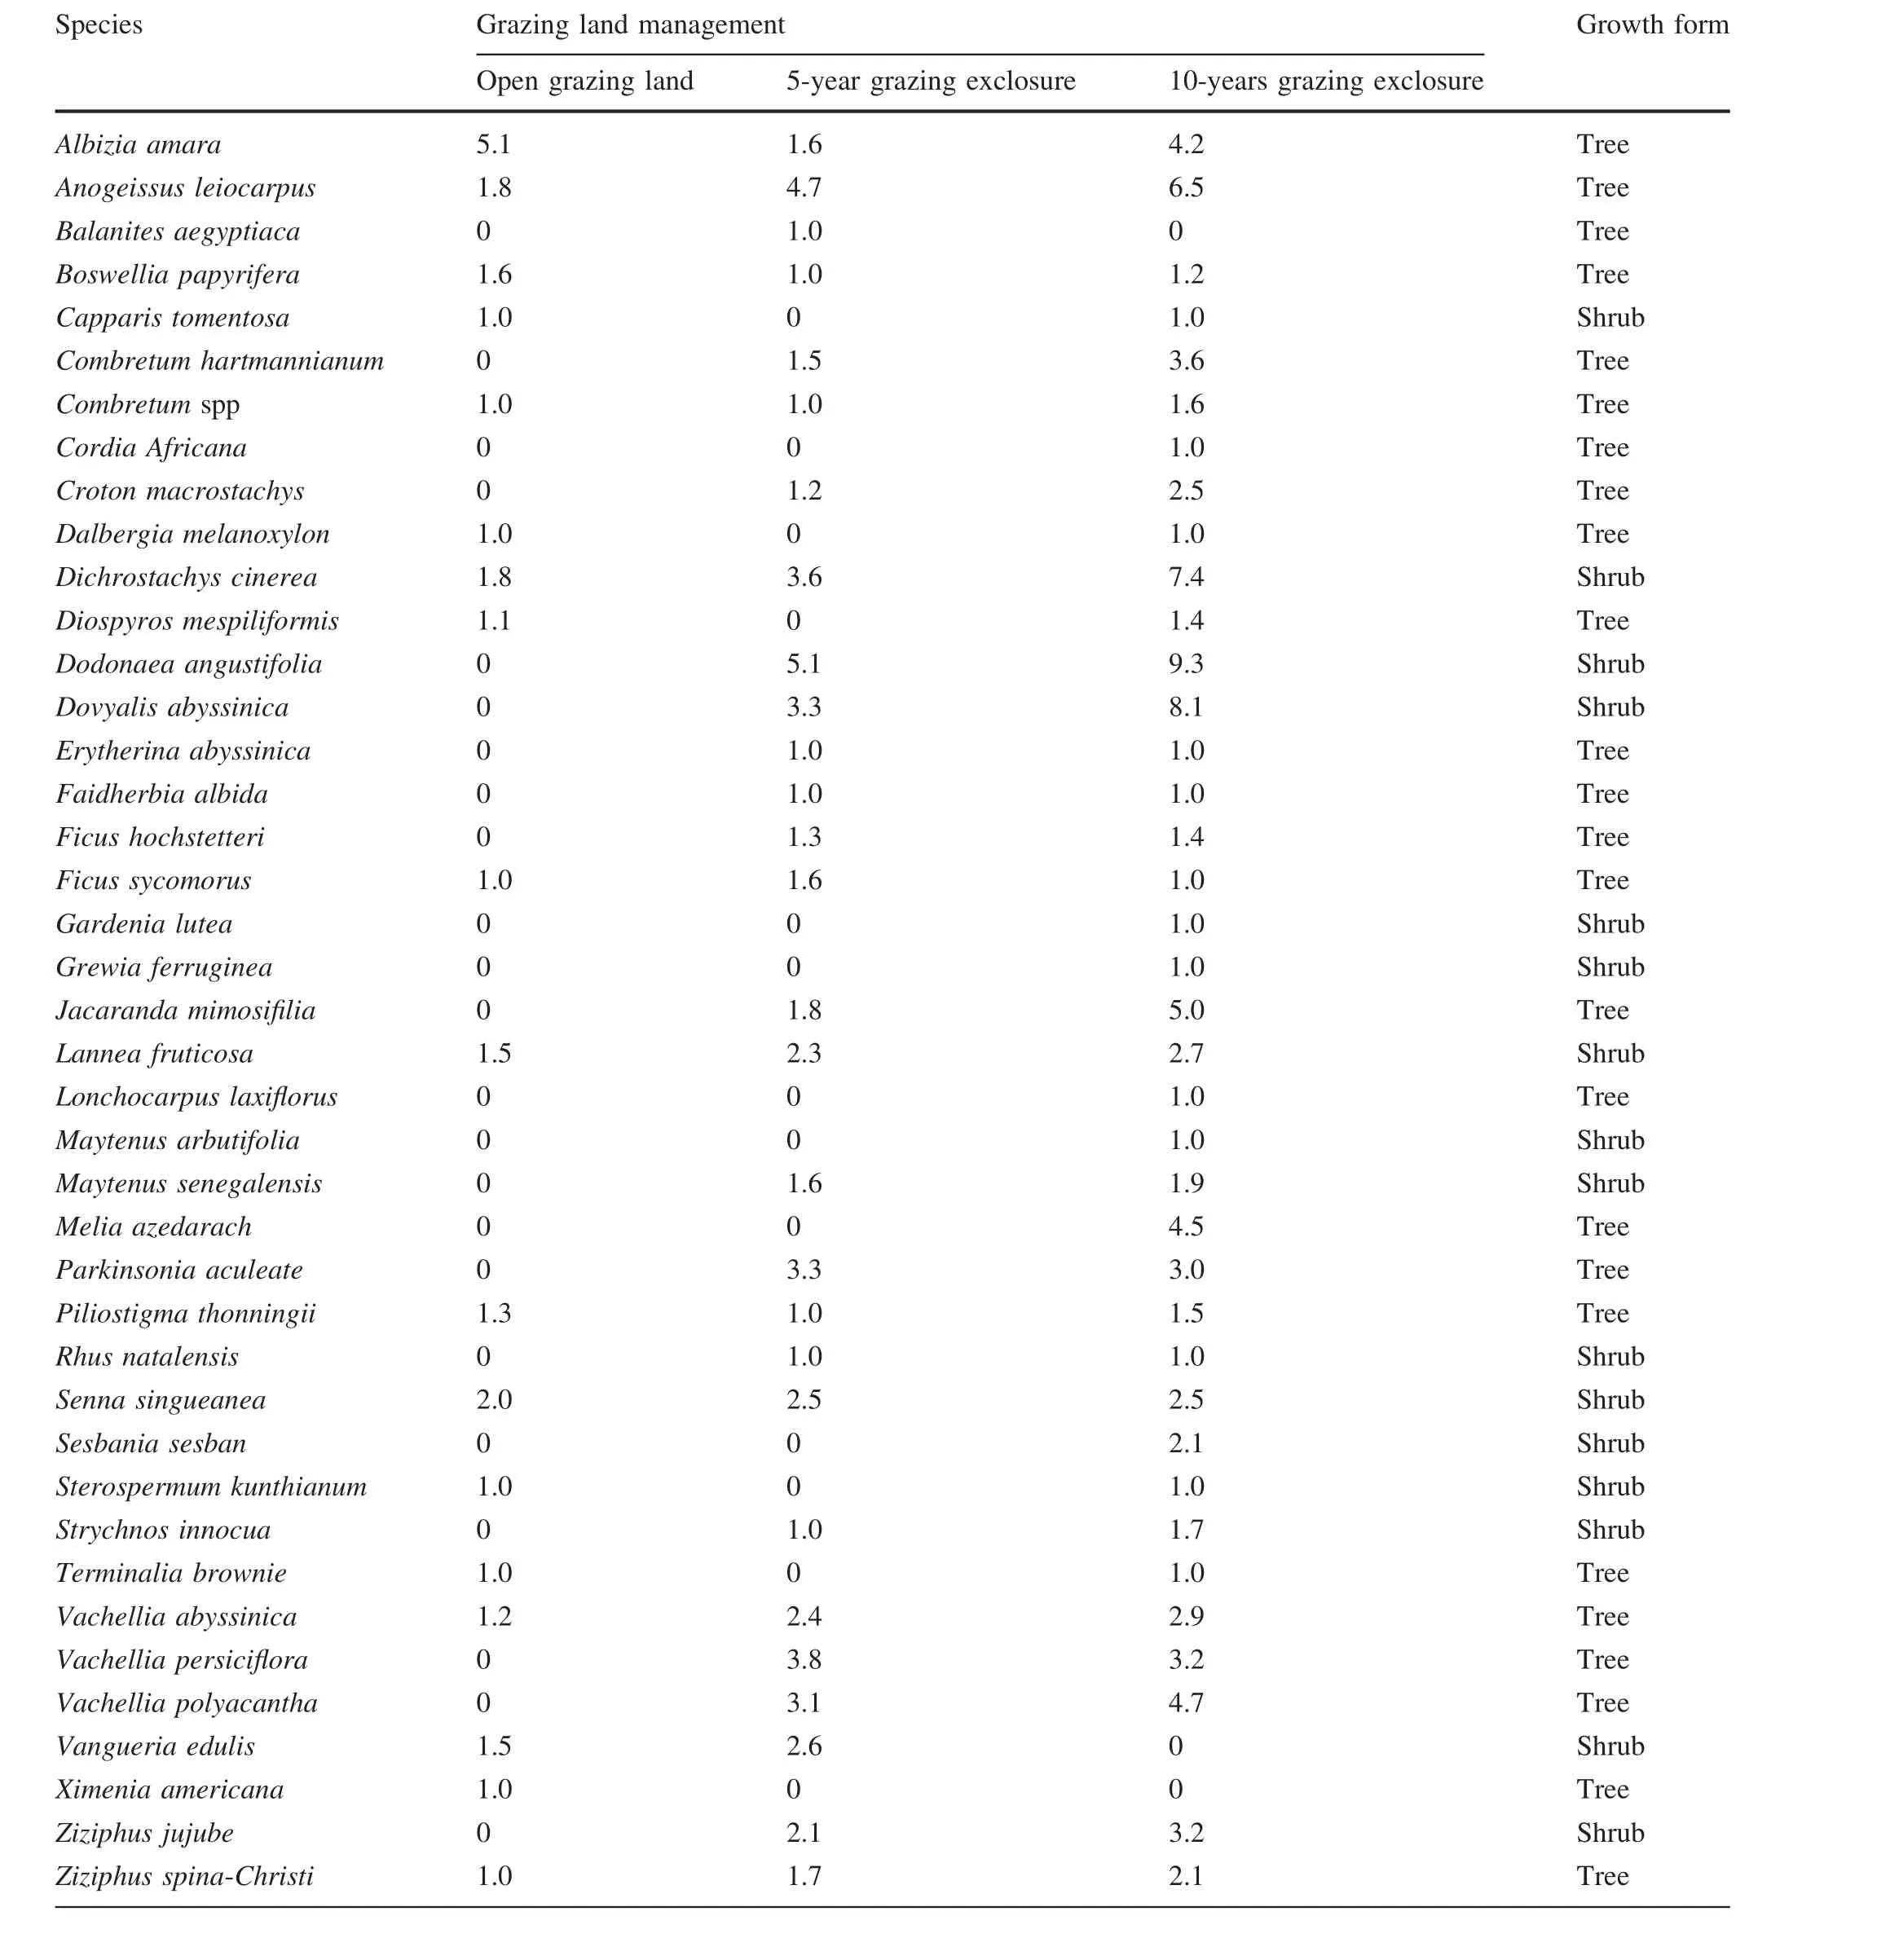
Table 1 Relative plant abundance(100 ind.·m-2)and growth forms of woody species under exclosure and open grazing lands
Species diversity,evenness and similarity
There was a signi ficant variation(P<0.001)in species diversity between the exclosure land management plots.The 10-year grazing exclosures had significantly higher species diversity compared to the 5-year exclosures and open grazing lands(Table 2).Previous studies(Yayneshet et al.2009;Mekuria and Mastewal 2013)also showed similar diversity values for woody species in the highland parts of Ethiopia.The S–W species diversity index is considered high when greater than 3.0,medium between 2.0 and 3.0,low between 1.0 and 2.0,and very low when it is smaller than 1.0(Krebs 1994;Magurran 2004).The diversity of species in the grazing exclosures was high.Species richness was significantly higher(P<0.05)as the age of grazing exclosure increases(Table 2).The open grazing lands shared 12 and 16 of the woody species with those of the 5-and 10-year exclosures,respectively,while 5-year exclosures shared 26 of the woody species with the 10-year exclosures(Table 1).So˜rensen index of similarity was highest between the 5-and 10-year grazing exclosures(79.0%),and the lowest between the 5-year grazing exclosures and open grazing lands(52.0%).
Vegetation structure
The density and frequency of species recorded in this study varied considerably(P<0.001)between exclosures and open grazing lands(Table 2).Mean densities of species encountered in open grazing lands and in the 5-and10-year exclosures were 391,1449 and 2431 ind.ha-1,respectively.Birhane et al.(2007)and Yayneshet et al.(2009)for the highlands of Ethiopia,and Ayana and Oba(2010)in southern Ethiopia,reported similar findings in that total density of woody species was higher in grazing exclosures than in open grazing lands.The 10-year grazing exclosures had higher basal areas of woody species compared to the 5-year exclosures and open grazing lands,indicating that the extended duration of exclusion from animal and human interference contributes significantly to higher basal areas.Woody species,particularly,in the 10-year grazing exclosures have longer periods of protection from cutting or logging.This indicates the contribution of exclosure land management to promote the rehabilitation and/or restoration of woody species.

Table 2 Species richness,Shannon–Weiner(S–W)diversity index,species evenness and density(ind.·ha-1)under exclosure and open grazing lands

Table 3 Species composition,abundance(AB),density(D,ind.·ha-1),relative density(RD,%),frequency(FR,%),relative frequency(RF,%),basal area(BA,m2ha-1),relative dominance(RDO,%)and Importance Value Index(IVI)of woody plants in open grazing lands
The dominant species with the highest densities wereA.amara(132 ind.ha-1),A.leiocarpus(50 ind.ha-1)andS.singueanea(42 ind.ha-1)in open grazing lands(Table 3),A.leiocarpus(256 ind.·ha-1),D.cinerea(185 ind.·ha-1)andD.angustifolia(173 ind.·ha-1)in 5-year exclosures(Table 4)andD.cinerea(454 ind.ha-1),D.abyssinica(423 ind.ha-1)andA.leiocarpus(330 ind.ha-1)in 10-year exclosures(Table 5).In open grazing lands,the three most frequent species wereA.amara(36.0%),A.leiocarpus(31.0%)andS.singueanea(23.0%).The most frequent species in the 5-year-old exclosures wereA.leiocarpus(61.0%),D.cinerea(58.0%)andS.singueanea(46.0%),whereas for the 10-year-old exclosures,D.cinerea(69.0%),D.abyssinica(58.0%)andA.leiocarpus(57.0%)were the most frequent species(Table 5).

Table 4 Species composition,abundance(AB),density(D,ind.·ha-1),relative density(RD,%),frequency(FR,%),relative frequency(RF,%),basal area(BA,m2ha-1),relative dominance(RDO,%)and Importance Value Index(IVI)of plants sampled in the 5-year grazing exclosures
The IVI values of all species ranged between 2.7(S.kunthianum)and 57.7(A.amara)in the open grazing lands(Table 3).In the 5-year exclosures,IVI values ranged from 2.9(A.amara)and 34.0(A.leiocarpus)(Table 4).In the 10-year exclosures,A.leiocarpus,D.abyssinicaandD.cinereahad a higher IVI values compared to other woody species.The IVI value is directly related to abundance,basal area,density and frequency distribution,and is an important parameter indicating the ecological signi ficance of a species in a given ecosystem(Worku et al.2012).Species with high IVI values are considered more important than those with low IVI values(Haileab et al.2011).IVI values are also important in conservation programs where species with low IVI values are prioritized forconservation and those with high IVIs need monitoring management(Fekadu et al.2012).Species with high IVI values under grazing exclosures and open grazing areas may be considered as the most ecologically important species while species with lower values require further conservation and management by the local communities and other stakeholders before they disappear.
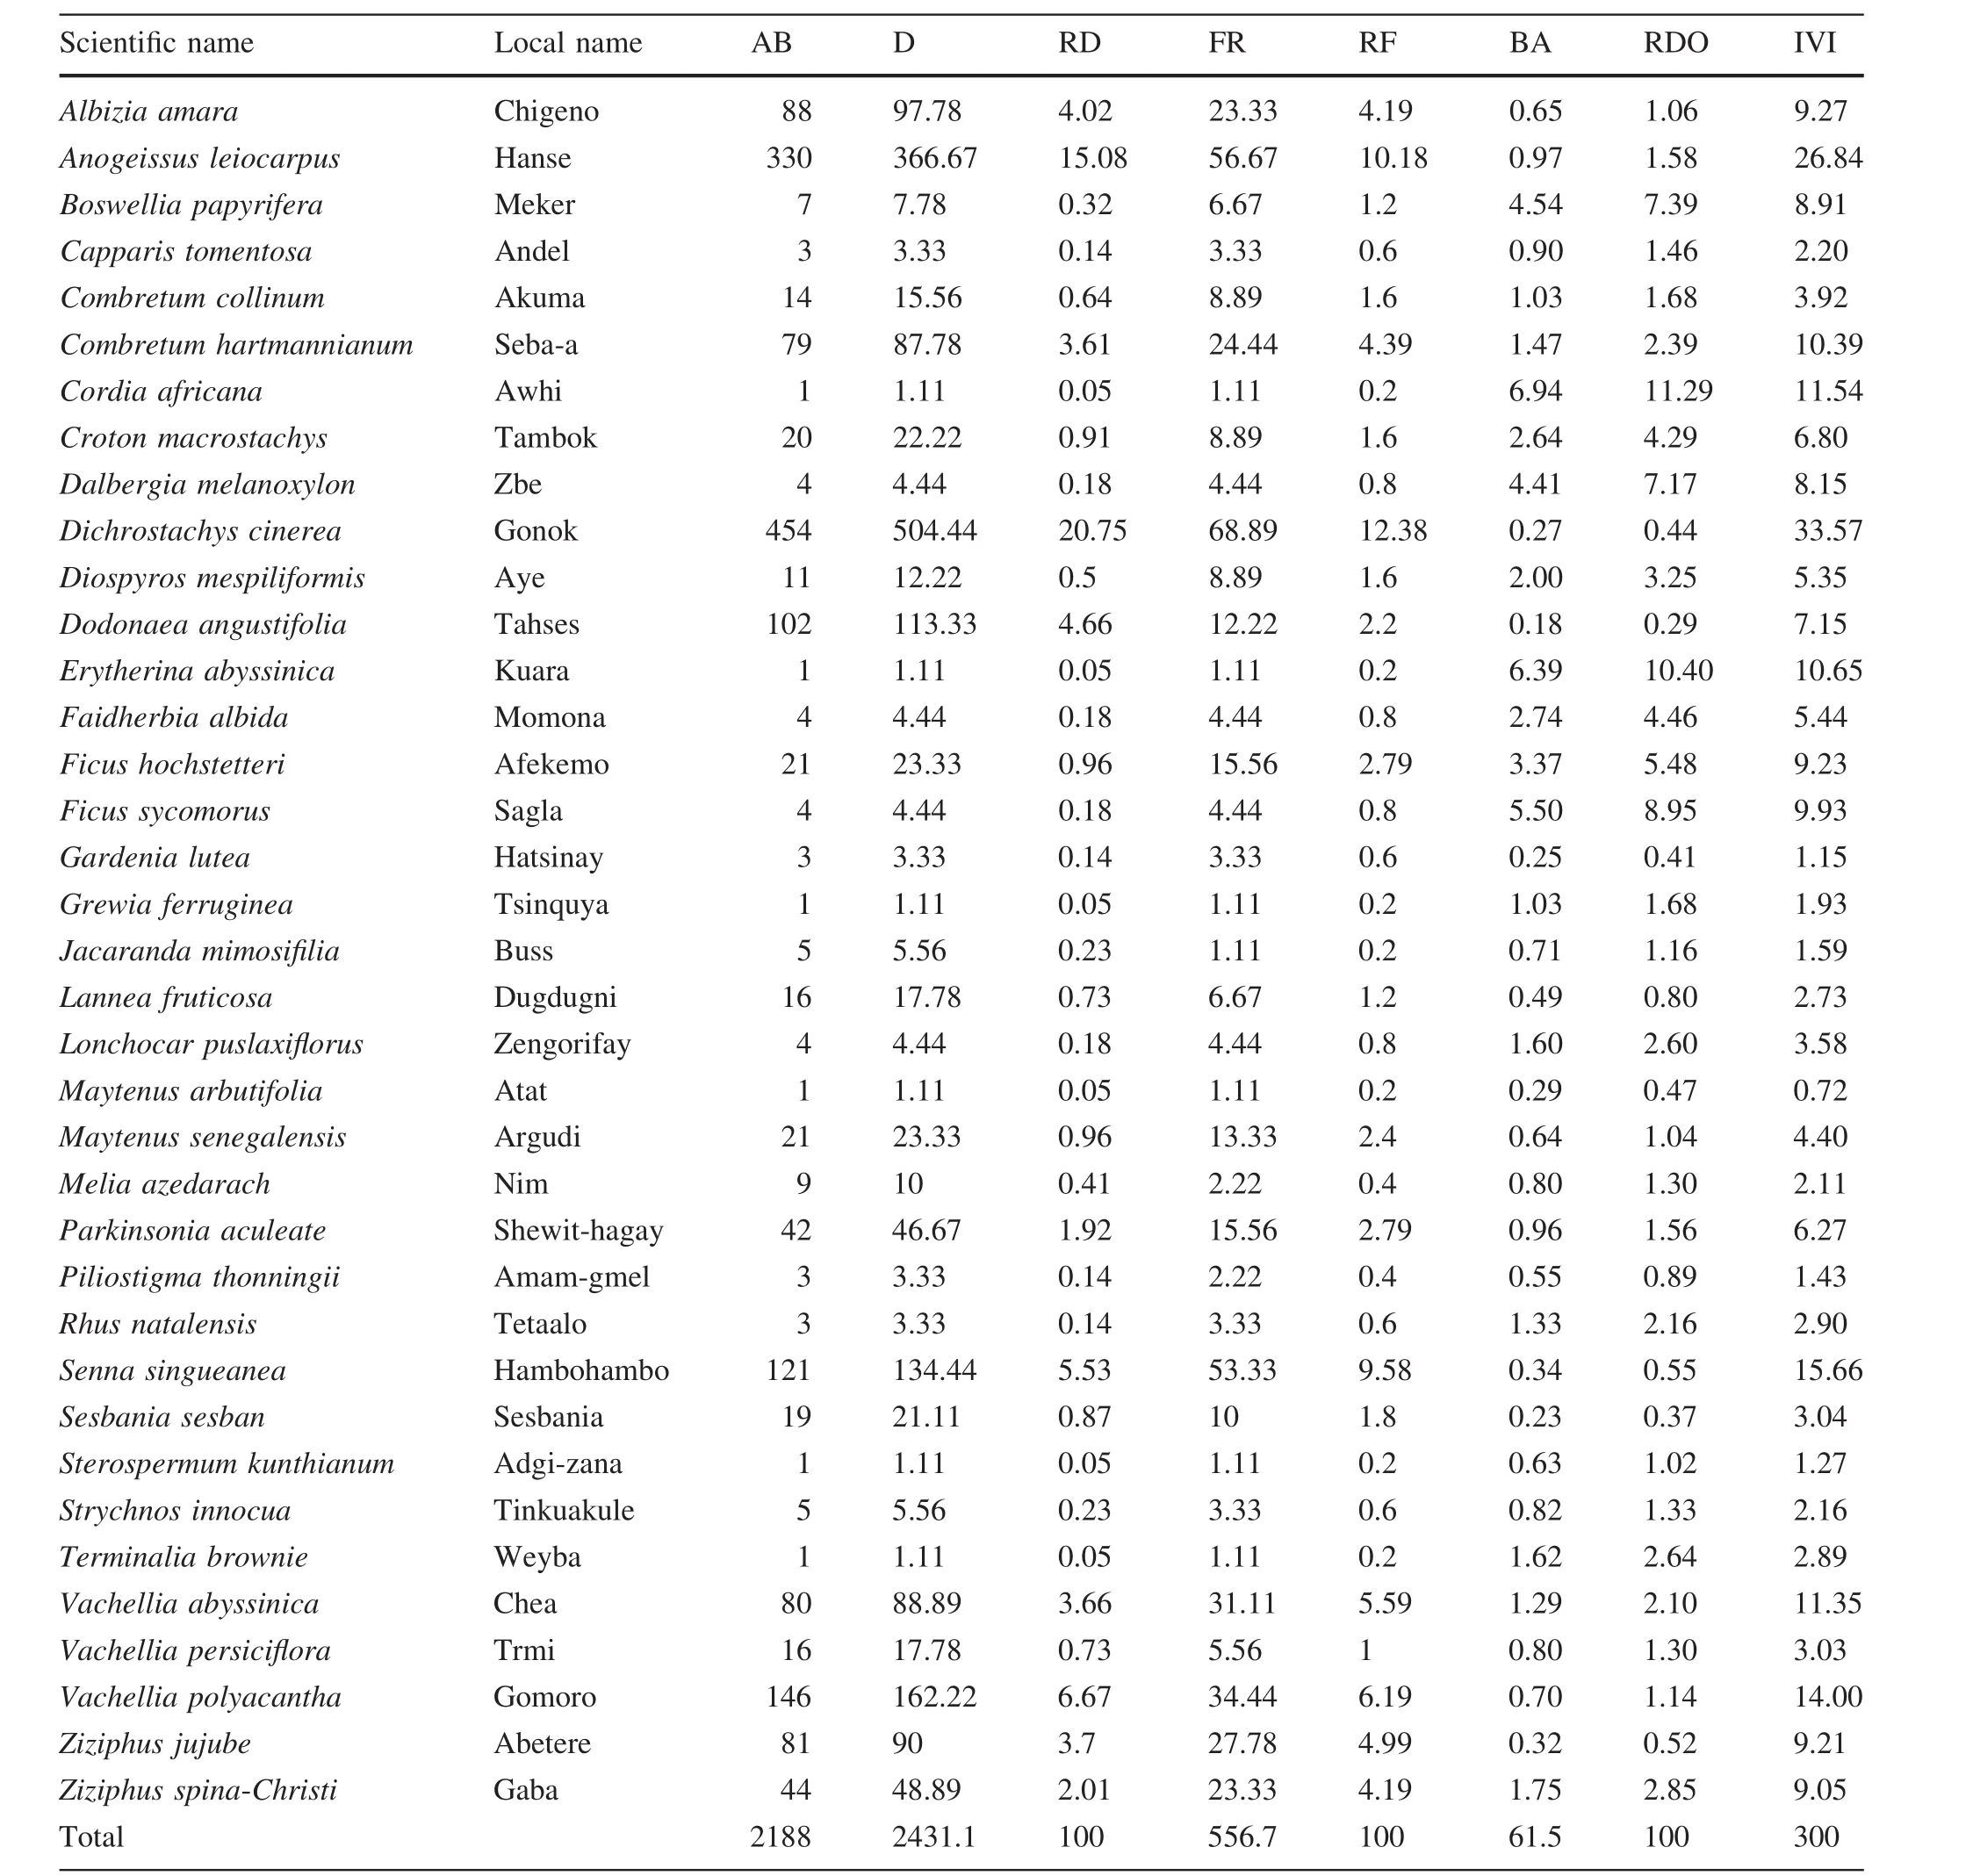
Table 5 Species composition,abundance(AB),density(D,ind.·ha-1),relative density(RD,%),frequency(FR,%),relative frequency(RF,%),basal area(BA,m2ha-1),relative dominance(RDO,%)and Importance Value Index(IVI)plants sampled in the 10-year exclosures
Population structure and regeneration status
The height class distribution indicated that the population structure in both grazing exclosures showed a reversed J-shape,whereas an interrupted reversed J-shape was characteristic of the open grazing lands(Fig.3),indicating that the majority of woody species had the highest number of individuals in relatively low height classes with a gradual decrease towards the highest height classes.A reversed J-shape distribution of height classes in our study indicates a continuous regeneration and/or a stable population of woody species.In contrast,the interrupted reversed J-shape of species in the open grazing lands indicates a hampered regeneration status due to several disturbance factors,including deforestation and frequent browsing by livestock.A higher number of individuals in the lower height class do not indicate a healthy regeneration status compared to the 5-and 10-year grazing exclosures.Accordingly,knowledge of the population structure can help to understand the status of the woody vegetation of a given site(Getachew et al.2010;Worku et al.2012),

Fig.3 Cumulative height class distribution of all species(ha-1)in 5-and 10-years of grazing exclosures and open grazing lands.Height class:1=<1.5 m;2=1.5-3 m;3=3–4.5 m;4=4.5–6 m;5=6–7.5 m;6=>7.5 m

Fig.4 Diameter class distributions in the 5-and 10-year grazing exclosures, and the open grazing lands. Diameter class:1=<2.5 cm; 2=2.5–5 cm; 3=5–7.5 cm; 4=7.5–10 cm; 5=10–12.5 cm; 6=12.5–15 cm; 7=15–17.5 cm;8=17.5–20 cm; 9=20–22.5 cm; 10=22.5–25 cm;11=25–27.5 cm;12 ≥ 27.5 cm

Fig.5 Number of seedlings,saplings and mature trees in the 5-and 10-year enclosures,and open grazing lands
In this study,the population structures of woody species in grazing exclosures showed an inverted J-shaped,where a higher number of individuals were observed in the lowest diameter classes and progressively declined in abundance with increasing diameter(Fig.4).All species under the open grazing lands showed a hampered-shaped diameter class distribution(Fig.4).Anteneh and Sebsibe(2011)similarly reported an inverted J-shape diameter and height class distribution for woody species in the Babile Elephant Sanctuary in eastern Ethiopia.According to Betru et al.(2005)and Mekuria and Mastewal(2013),inverted J-shape curves for diameter and height class distribution was observed under the exclosure land management system,whereas there was a hampered(skewed)distribution of diameter and height classes in the open grazing lands in the highlands of Ethiopia.
Average seedling densities of woody species in the open grazing lands,and in the 5-and 10-year exclosures were 44,630 and 858 ind.·ha-1,respectively.The average densities of saplings were 100,431 and 821 ind.ha-1for the open grazing lands,5-and 10-year exclosures,and mature trees were 247,388 and 752 ind.ha-1,respectively(Fig.5).The population structure of species with suf ficient numbers of seedlings,saplings and mature trees indicates a successful regeneration status.The availability of seedlings and saplings beneath mature canopies indicates good regeneration potential predicted on age structure of the population at a given site.
The regeneration status of a certain species is considered poor if the numbers of seedlings and saplings are lower than the mature trees(Dhaulkhandi et al.2008;Tiwari et al.2010)since good regeneration levels indicate the stability of woody species to the environmental conditions of a given site.In this study,the number of seedlings is less than the number of saplings,which is less than the number of mature trees,indicating a poor and hampered(slow down)regeneration of species in open grazing lands.However,exclosures showed a greater number of mature trees than seedlings and saplings,indicating a healthy regeneration status of the species(Fig.5).This suggests the need to develop an effective exclosure land management system to promote regeneration.
Conclusion
The 10-year grazing exclosures had higher species diversity,greater abundance,density and basal area than the 5-year exclosures and open grazing lands.Moreover,the population structure and regeneration status in both exclosures showed a healthy regeneration status,9339 whereas the open grazing lands showed a hampered regeneration status.Accordingly,the establishment of area exclosures on open grazing lands had a positive effect on improving the structure,diversity and regeneration of woody species.Implementation of exclosure land management is crucial to promote regeneration and the sustainable use of woody species in degraded grazed areas.Therefore,it is recommended that exclosure land management on degraded communal grazing lands needs to be widely practiced in order to restore the loss of plant diversity and to improve the structure and regeneration of plant communities in semiarid environments of Ethiopia.
References
Aerts R,Nyssen J,Haile M(2009)On the difference between‘‘exclosures’’and ‘‘enclosures’’in ecology and the environment.J Arid Environ 73:762–763
Anteneh B,Sebsibe D(2011)Diversity and population structure of woody species browsed by elephants in Babile Elephant Sanctuary,eastern Ethiopia:an implication for conservation.Ee-JRIF Agric For 3(1):20–32
Awas T (2007)Plant diversity in Western Ethiopia:ecology,ethnobotany and conservation.PhD thesis,University of Oslo,Oslo
Ayana A,Oba G(2010)Effects of grazing pressure,age of enclosures and seasonality on bush cover dynamics and vegetation composition in southern Ethiopia.J Arid Environ 74(1):111–120
Bekele A(2007)Useful trees of Ethiopia:identi fication,propagation and management in 17 agro ecological zones.RELMA in ICRAF Project,Nairobi
Betru N,Jawad A.Ingrid N(2005)Exploring ecological and socioeconomic issues for the improvement of area enclosure management:a case study from Ethiopia.Drylands Coordination Group,Report No.38
Birhane E,Teketay D,Barklund P(2007)Enclosures to enhance woody species diversity in the drylands of eastern Tigray.East Afr J Sci 1(2):136–147
Dabasso BH,Zerihun T,Dana H(2014)Carbon stock in semi-arid pastoral ecosystems of Northern Kenya.Pastor Res Policy Pract 4(5):1–8
Dhaulkhandi M,Dobhal A,Bhatt S,Kumar M(2008)Community structure and regeneration potential of natural forest site in Gangotri,India.J Basic Appl Sci 4:49–52
Eshete A,Sterck F,Bongers F(2011)Diversity and production of Ethiopian dry woodlands explained by climate-and soil-stress gradients.For Ecol Manage 261:1499–1509
FAO(2010)Guideline on sustainable forest management in drylands of Sub-Saharan Africa.Arid Zone Forest and Forestry Working Paper No.1.Food and Agriculture Organization of the United Nations(FAO),Rome
Fekadu G,Teshome S,Ensermu K(2012)Structure and regeneration status of Komoto Afromontane moist forest,east Wollega zone,west Ethiopia.J For Res 23(2):205–216
Fromman B,Pearson S(1974)An illustrated guide to the grass of Ethiopia.Chilalo Agricultural Development Unit,Asella
Getachew T,Teketay D,Masresha F,Beck E(2010)Regeneration of seven indigenous tree species in a dry Afromontane forest,southern Ethiopia.Flora 205:135–143
Groenendijk P,Eshete A,Sterck FJ(2012)Limitations to sustainable frankincense production:blocked regeneration,high adult mortality and declining populations.J Appl Ecol 49:164–173
Haileab Z,Teketay D,Ensermu K(2011)Diversity and regeneration status of woody species in Taragedam and Abebaye forests,northwestern Ethiopia.J For Res 22:315–328
Hassan Y,Treydte MAC,Abule E,Sauerborn J(2013)Predicting aboveground biomass of woody encroacher species in semi-arid rangelands,Ethiopia.J Arid Environ 96:64–72
Kent M,Coker P(1992)Vegetation description and analysis:a practical approach.Wiley,England
Krebs CJ(1994)Ecological methodology.Harper and Row Publishers,New York
Kyalangalilwa B,Boatwright JS,Daru BH,Maurin O,van der Bank M(2013)Phylogenetic position and revised classi fication of Acacia s.l.(Fabaceae:Mimosoideae)in Africa,including new combinations in Vachellia and Senegalia.Bot J Linn Soc 172:500–523
Lemenih M,Bongers F(2011)Dry forests of Ethiopia and their silviculture.In:Gunter S,Weber M,Stimm B,Mosandi R(eds)Silviculture in the tropics,tropical forestry.Springer,Berlin
Lemenih M,Kassa H(2011)Opportunities and challenges for sustainable production and marketing of gums and resins in Ethiopia.CIFOR,Bogor
Magurran AE(2004)Measuring of biological diversity.Blackwell Publishing,London
Mannetje L,Jones RM(2000)Field and laboratory methods for grassland and animal production research.CABI,Wallingford
Mastewal Y,Kindeya G,Stein M,Mekuria W(2006)Impact of area enclosures on density,diversity,and population structure of woody species:the case of May Ba’ati-DougaTembien,Tigray,Ethiopia.Ethiop J Nat Resour 8(1):85–123
Mekuria W,Mastewal Y(2013)Changes in woody species composition following establishing exclosures on grazing lands in the lowlands of northern Ethiopia.Afr J Environ Sci Technol 7(1):30–40
Mekuria W,Veldkamp E,Corre MD,Mitiku H(2011)Restoration of ecosystem carbon stocks following exclosure establishment in communal grazing lands in Tigray,Ethiopia.J Soil Sci Soc Am 75:246–256
Mengistu T,Teketay D,Hoaka H,Yemshaw Y(2005)The role of exclosures in the recovery of woody vegetation in degraded dryland hillsides of central and northern Ethiopia.J Arid Environ 60:259–281
Philips S(1995)Poaceae(Gramineae).In:Hedberg I,Edwads S(eds)Flora of Ethiopia.The National Herbarium Addis Ababa University,Addis Ababa and University of systematic botany,vol 7.Uppsala University,Sweden
SAS(Statistical Analysis System)(2002)Statistical analysis system.Users’guide:statistics version 9.1.SAS Institute Inc.,Cary
Seyoum Y,Birhane E,Mengistu T,Esmael N,Hagazi N,Kassa H(2015)Enhancing the role of the forestry sector in building climate resilient green economy in Ethiopia:scaling up effective forest management practices in Tigray National Regional state with emphasis on area exclosure.Center for International Forestry Research,Ethiopia Of fics,Addis Ababa
Teketay D(2005)Causes and consequences of dryland forest degradation in Sub-Saharan Africa.Walia 24:3–20
Tiwari GPK,Tadele K,Aramde F,Tewari SC(2010)Community structure and regeneration potential ofShorearobustaforest in subtropical sub-montane zone of Garhwal Himalaya,India.Nature and Science 8(1):70–74
Worku A,Teketay D,Mulugeta L,Masresha F(2012)Diversity,regeneration status,and population structures of gum and resin producing woody species in Borana,southern Ethiopia.Forests,Trees and Livelihoods 21:85
Yayneshet T,Eik LO,Moe SR(2009)The effects of exclosures in restoring degraded semi-arid vegetation in communal grazing lands in northern Ethiopia.J Arid Environ 73(4):542–549
 Journal of Forestry Research2018年3期
- Journal of Forestry Research的其它文章
- In vitro propagation of conifers using mature shoots
- ‘Relationships between relationships’in forest stands:intercepts and exponents analyses
- Effects of application date and rate of foliar-applied glyphosate on pine seedlings in Turkey
- Assaying the allelopathic effects of Eucalyptus camaldulensis in a nursery bed incorporated with leaf litter
- Effects of soil compaction on growth variables in Cappadocian maple(Acer cappadocicum)seedlings
- Variation and selection analysis of Pinus koraiensis clones in northeast China
