Variation and selection analysis of Pinus koraiensis clones in northeast China
Deyang Liang•Changjun Ding•Guanghao Zhao•Weiwei Leng•Min Zhang•Xiyang Zhao•Guanzheng Qu
Introduction
Korean pine(Pinus koraiensisSieb.et Zucc)is distributed fromnortheast Chinathroughthe Koreanpeninsula tocentral Japan(Xu and Yan 2001).P.koraiensishas been intensively studiedbecauseofitshigh-qualitywood,higheconomicvalue of its seeds(Isidorov et al.2003)and medicinal value(Asset etal.1999;Golietal.2005;Yangetal.2005).Previousstudies have concentrated mainly on provenance selection(Wang et al.2002),chemical composition(Su et al.2009),seed orchards(Han et al.2008),and molecular breeding(Zhang et al.2015).However,because of its slow growth(Son et al.2001),family selections have been the main methods used inP.koraiensisresearch.
Multiple-trait comprehensive evaluations have great utility for the selection of excellent families and clones(Dean et al.1983).There are several methods for these evaluations and different methods have advantages and drawbacks(Han and Jiang 2014;Lai et al.2001;Luo et al.2010).Multiple-trait comprehensive evaluations involve mainly traits which include diameter at breast height,volume(Guo 2013),tree height(Li et al.2007),and wood characteristics(Chen 2012).Three excellent provenances were selected from sixEucalyptusprovenances by a multiple-trait comprehensive evaluation,and their volumes were 0.0897 m3,which was 85.87%higher than that of other provenances(Lu et al.2004).To increase economic bene fits, five excellentJuglans regiaclones were selected from 21 clones based on several different fruit traits(Guo 2014).ForP.koraiensis,wood products were the most important breeding objective over the past several years,with elite materials selected based on height,diameter at breast height or volume.In this study,16 growth traits of 50P.koraiensisclones were investigated.The objectives were to analyze the differences in genetics and variations of the traits among different clones;several excellent clones were selected by a comprehensive evaluation which could provide a theoretical basis for improving the genetics ofP.koraiensis.
Materials and methods
Experimental site
The experiment was conducted at aP.koraiensisseed orchard in Kaishan village(E129°45′,N42°40′)located on the east side of the Changbai Mountain in Longjing,northeast China.The area has a temperate monsoon climate and the average frost-free season is 139 days.Mean annual precipitation and temperature are 493.6 mm and 5.3°C,respectively.
Materials
Fifty clones(PK01-PK50)were selected based on their growth traits from the natural distribution ofP.koraiensisin Longjing,Jilin province in 1982.The materials were grafted and plantations established with 1-year-old plants in the spring of 1985.The experimental design consisted of four blocks and each clone was planted using a randomized complete block design(Marron and Ceulemans 2006)in rows containing 10 trees at 5.0 m×6.0 m.

Table 1 Investigation criteria and scores of stem straightness degree
Growth trait measurement
The following traits were measured in September 2016:tree height(Ht),basal diameter(BD),diameter at breast height(DBH),diameter at 3-m height(DIAM3),diameter at 5-m height(DIAM5),stem straightness degree(SSD),average crown breadth(AC),branch angle(BA),average branch wheel distance(ABWD),crown height(CH),bark thickness at the base(BTB),and bark thickness at breast height(BTBH).Ht and CH were measured with a meter ruler;BD,DBH,DIAM3,and DIAM5measured with a caliper;SSD estimated(Table 1)based on the method of Zhao et al.(2014)in which SSD values are the square root before calculation.AC was calculated by averaging the values of the north–south and east–west crown width.BA was measured with a protractor 3 m from the trees.Ten rotating branch distances of the upper stem(wheel branch at 1.3 m height as the first one,the wheel branch above the first was the second one,and until the eleventh wheel branch)were measured.The ABWD was calculated using the tenth distance of the first one to the eleventh wheel branch.Pieces of bark(1×1 cm)at ground level and 1.3 m height of the stem were removed and the BTB and BTBH measured.Ten leaves of each tree were collected and leaf length(LL)and leaf width(LW)were measured.The stem volume(Vol)of each tree was calculated according to Zhao et al.(2016),and the average taper(AT)as described by Ren(2010).
Statistical analysis
All data were analyzed using Statistical Product and Service Solutions(SPSS),version 19.0(IBM Corp.,Armonk,NY,USA)(Shi 2012).The signi ficance of fixed effects was tested by ANOVAFtests.The following linear model was used for joint analysis of clones and blocks of growth traits(Hansen and Roulund 1997):

where Xijkis the performance of an individual treekin cloneigrowing in blockj,μ is the overall mean,αiis the effect of clonei,bjis the effect of blockj,αbijis the interactive effect of cloneiand blockj,andeijkis the random error.The coefficient of phenotypic variation(PCV)was calculated using the formula(Hai et al.2008):


where σA2is the additive genetic variance component among clones;σb2is the block variance;and σe2is the error variance component.
The phenotypic correlation,rA(xy),of traitsxandywas calculated according to Bi et al.(2000)as:

where covp(x,y)is the covariance between traitxandy;σp(x)is the variance component for traitx,and σp(y)the variance component for traity.
The genetic correlation,rg(xy),of traitsxandywas calculated according to Xu(2006)as:

whereCovfxyis the genetic covariance between traitxan
dy;σp(x)is the variance component for traitx;and σp(y)the variance component for traity.Comprehensive evaluations of different clones were calculated as described by Zhao et al.(2016):

whereai=Xij/Xjmax;theQivalue is a comprehensive evaluation value for each clone;Xijis the average value of one trait;Xjmaxis the maximum value of the trait;andnis the number of traits.Genetic gain was estimated using the formula of Francisco et al.(2008):

whereWis the selection difference,and¯Xandh2are the mean value and heritability of a given trait,respectively.
Results
ANOVA and variation parameters of each character
The ANOVA of different traits of 50P.koraiensisclones is shown in Table 2.The results reveal that there are significant differences(p≤0.01)for traits Ht,BD,DBH,DIAM3,Vol,AC,AT,CH,LL and LW between the clones.However,there was no signi ficant difference in the other traits among the clones.The averages,ranges and variation parameters of different traits are shown in Table 3.The trait with the highest R was BD and the lowest was AID,which values were 0.900 and 0.013,respectively.For PCVs,the highest value of the different traits was BTBH,which was up to 48.03%and the lowest was SSD,at only 4.37%.
Average values of each trait in different clones
Average values of different traits of all clones are shown in Table 4.PK29 showed the largest Ht(12.80±1.04 m)and CH (10.53±0.88 m),and PK30 the lowest(7.57±0.40 m,5.12±0.43 m).PK11 showed the largest BD(33.41±0.32 cm)and Vol(0.22±0.02 m3)values;the lowest BD was PK12(18.68±0.76 cm)and the lowest Vol was PK16(0.08±0.01 m3).PK24 showed the lowest DBH (15.83±1.31 cm), DIAM3(13.23±2.12 cm)and DIAM5(9.77±0.11 cm).As well as,PK04 showed the largest DBH(26.25±0.42 cm),DIAM3(21.10±2.62 cm),and the largest DIAM5was PK26(16.06±2.03 cm).PK02(4.62±0.31 m)was the lowestin AC,and the largestAC was PK45(6.71±1.24 m).There are four clones(PK03,PK06,PK19 and PK35)that showed the lowest SSD values which were only 1.91±0.16,but the highest value of SSD was PK01 at2.16±0.14.The largestAT value was 5.76±0.52(PK10)and the smallest 1.68±0.24(PK12).PK30 and PK48 showed the largest and smallest BA values,which were(93.33 ± 14.43)°and(56.67 ± 10.41)°,respectively.PK36 and PK03 showed the largest and the smallest LL values,which were 132.69±12.82 and 95.95±4.55 mm,respectively.PK15 and PK13 showed the largest and the smallest LW values,which were 1.04±0.07 and 0.73±0.02 mm,respectively.PK34 and PK03 showed the highest and the lowest AID values,which were 49.20±2.99 and 28.27±4.15 cm,respectively.PK41(5.50±2.66 mm)showed the largest BTB and PK13 showed the smallest(2.36±0.71 mm)value.In BTBH,PK21(2.83±3.42 mm)showed the largest value,and PK46(0.90±0.31 mm)the smallest.
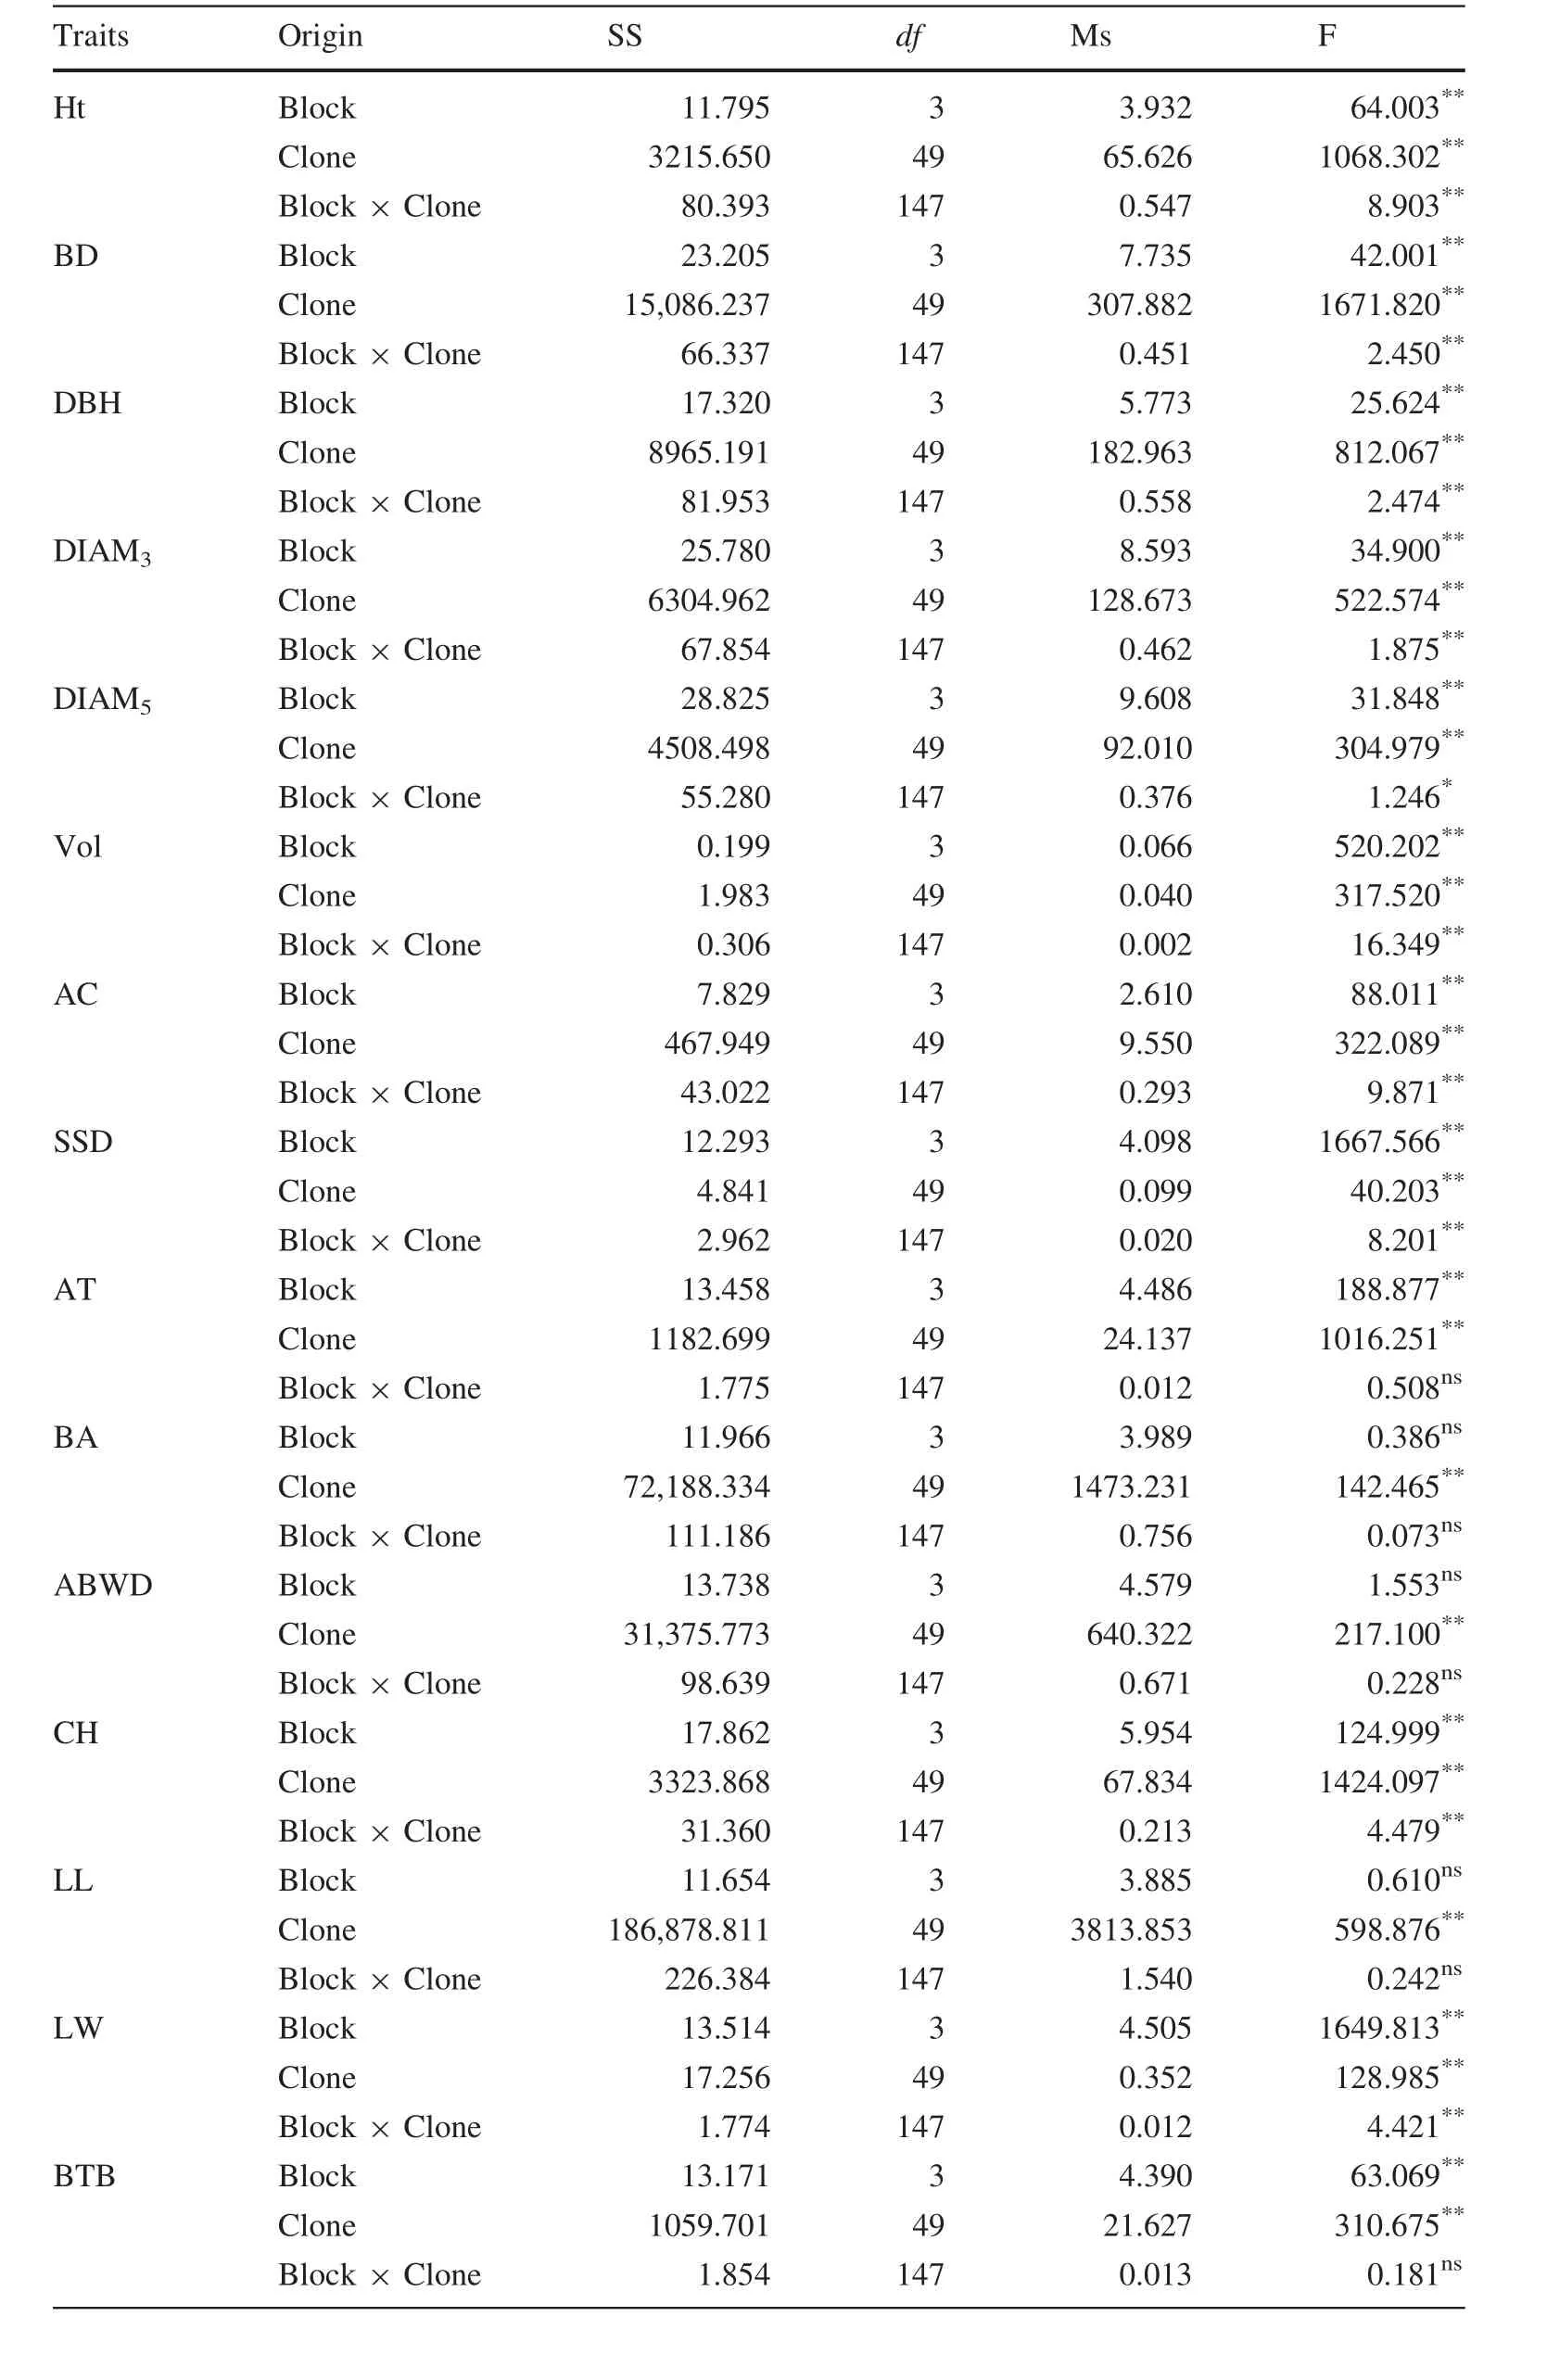
Table 2 ANOVA analysis of different traits

Table 2 continued

Table 3 Genetic and variation parameters of different traits
Correlation analysis
Correlation coefficients between different traits are shown in Table 5.There exists a signi ficant positive correlation among traits Ht,BD,DBH,DIAM3,DIAM5and Vol(0.456–0.899).AC was significantly positive with traits BD,DBH,DIAM3,DIAM5and Vol(0.317–0.362).BA was significantly positive with AC(0.423)and BTB with BTBH(0.333).There was no signi ficant correlation among other traits.Genetic correlation coefficients of different traits are also shown in Table 5;all the coefficients were close to phenotypic correlation coefficients.
Comprehensive evaluation
Based on ANOVA and correlation analysis,Ht,DBH,Vol and AC were chosen as evaluation indexes(Table 6).The Qi values of 50 clones are shown in Table 6.PK11 showed the highest Qi value(1.95),followed by PK19,PK04,PK14 which were 1.94,1.92 and 1.89 respectively.PK12 showed the lowest Qi value which was only 1.59.According to the values of Qi in Table 6,with a selection rate of 10%,PK11,PK19,PK04,PK14 and PK28 are excellent clones.The genetic gains of different traits of these selected clones are shown in Table 7.It was obvious that the trait Vol obtained the highest genetic gain of 32.72%,followed by traits DBH and Ht,for which genetic gains were 13.02 and 8.58%,respectively.
Discussion
ANOVAs
Heredity and variation are the main factors in forest tree breeding(Mwase et al.2008).To understand and select genetic resources for breeding research,ANOVAs have been applied widely(Safavi et al.2010;Zhao et al.2014).In the present study,there were signi ficant(p<0.01)differences in all growth traits,indicating that these traits varied among the different clones and that they could be used for a multiple-trait comprehensive evaluation.These results are in agreement with a previous study(Isik et al.2003)that used ANOVAs to identify traits that differed significantly among different clones and which enabled the reliable and effective selection of superior clones.
Average values of different traits of different clones
Plant growth is in fluenced by the genotype×environment interaction;different clones may show different phenotypes in the same environment and the same clone may show different phenotypes in a different environment(Hortensia et al.2011).In the present study,16 growth traits(most of which re flect plant growth status)of 50P.koraiensisclones were investigated and the results show that various traits are not identical in different clones.Based on these results,Ht,BD,DBH,DIAM3,Vol,AC,AT,CH,LL,and LW were traits more suitable for excellent clones selected in this study.This is supported by
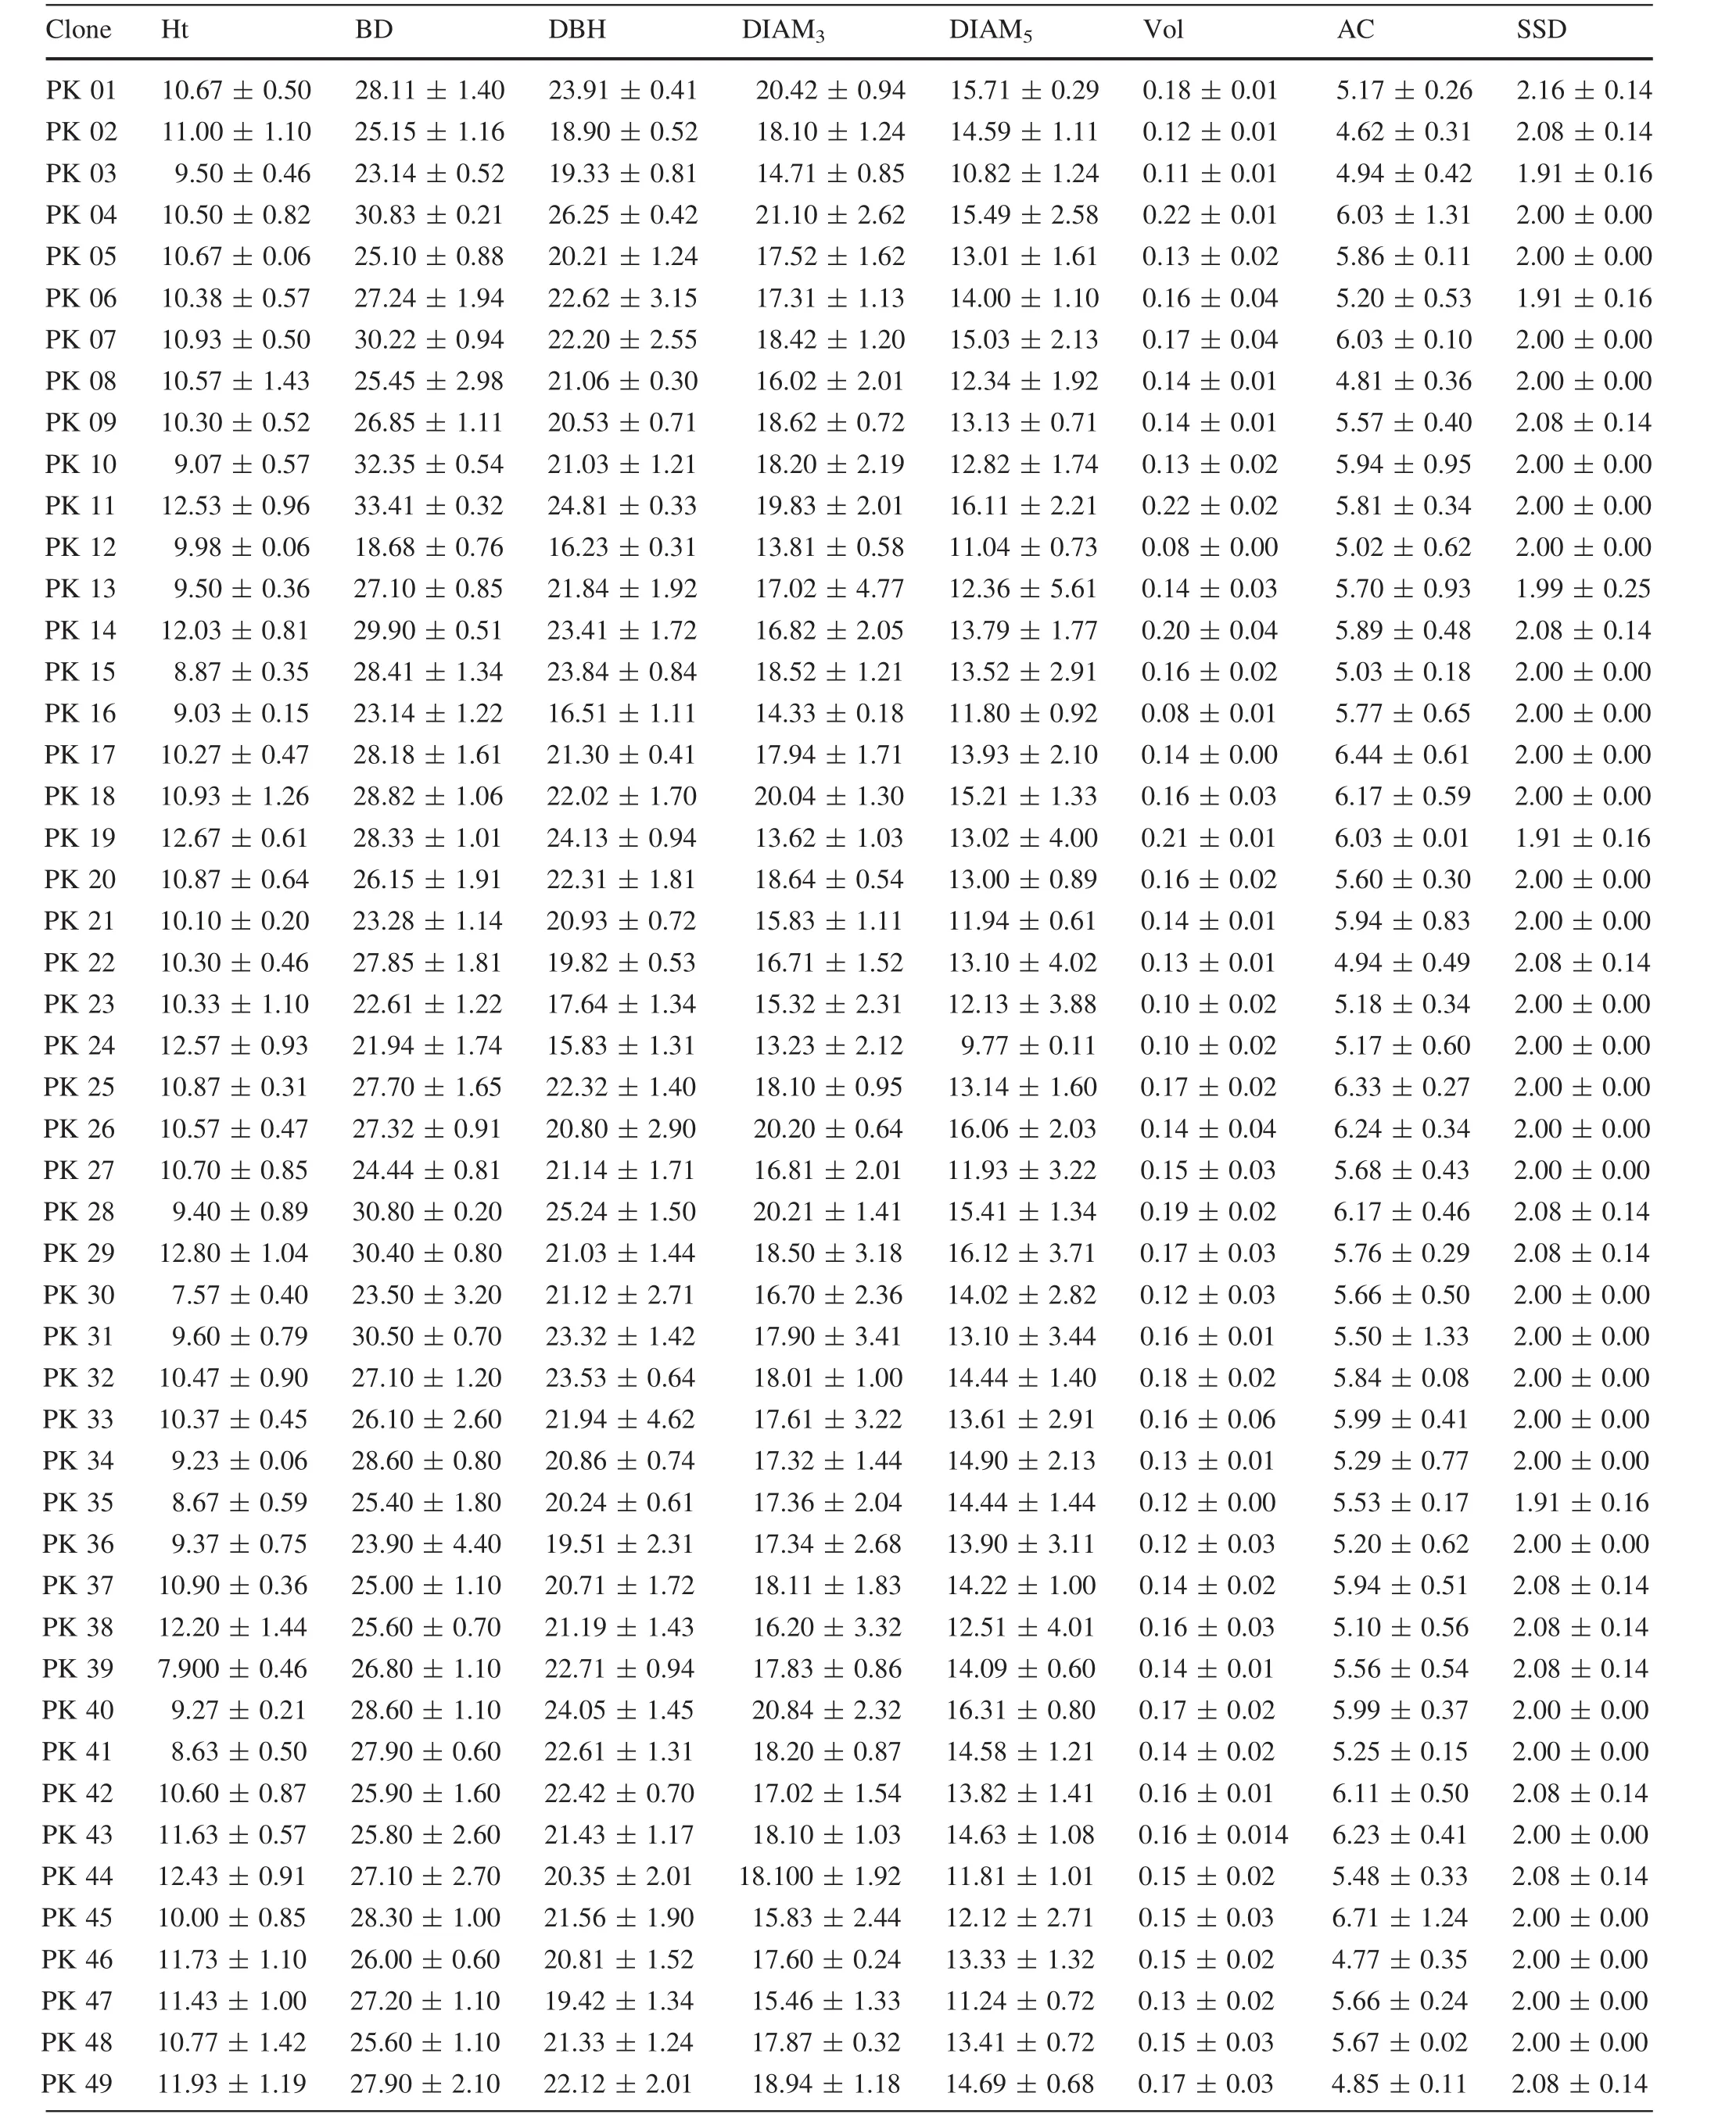
Table 4 Average values of different traits of different clones

Table 4 continued
observations from a SwedishPinus sylvestrisbreeding program which demonstrated that Vol was one of the most important selection criteria(Fries 2012).In addition,other studies showed that BA was strongly affected by plant genotype(Gort et al.2010;Vestol et al.1999).The AC size plays an important role in landscaping and afforestation projects.In this study,average AC of the 50P.koraiensisclones varied from 4.62 to 6.71 m.Clone PK45 showed the highest average AC,while clone PK2 the lowest,which demonstrates that clone PK45 is adapted to landscaping projects and that clone PK2 is suitable for afforestation.The outturn percentage was affected by bark thickness(Jeremy et al.2016),which increased,leading to outturn percentage decreasing.The average BTBH values of clones PK30 and PK35 were lower than those of the other clones,suggesting thatthey would have a higheroutturn percentage.
Analysis of the genetic variation parameters of the different traits
Genetic variation studies are some of the most important programs in forestry breeding research(Mwase et al.2008)to identify traits for the selection and evaluation of excellent clones.In this study,the PCVs of most traits,including Ht,DBH,Vol,AC,AT,CH,LL,and BTBH,were all higher than 10%,especially the PCV of BTBH at 48.03%,indicating that BTBH varied widely among all of the clones.Moreover,the PCVs of Ht,DBH,and Vol were relatively higher compared with studies ofPinus taeda(Wood et al.2015),Jatropha curcas(Kaushik et al.2015),andPinus pinaster(Camille et al.2011),which all suggest that higher PCVs are useful for selecting these traits.Repeatability(R)is a measure of the reliability with which a genotype can be recognized by its phenotypic expression among clones,and it can be in fluenced by the environment(Yang and Ji 2004).The R values of Ht,DBH,Vol,AC,AT,CH,and LL were 0.878,0.819,0.822,0.574,0.829,0.88 and 0.661,respectively.Moderate or high R values(R>0.600)suggest that these traits are controlled more strongly by genotype.Similar results were found in poplars(Liu et al.1994)andEucalyptus urophylla(Sanchez-Vargas et al.2004),and these studies also showed that genetic control of growth traits(Ht,DBH,and Vol)was relatively strong or stable.Higher R values for these traits indicate that they are less in fluenced by environmental effects(Maniee et al.2009),and thus it will be bene ficial to use traits with higher R values when selecting clones.
Correlation analysis
The phenotype of a plant is in fluenced by different growth characteristics and there is a complicated correlation among them(El-Soda et al.2014).Thus,having knowledge of these correlations is conducive to comprehensively evaluating and selecting different clones.In our study,there were different correlation coefficients among all of the traits.The correlation coefficients among Ht,BD,DBH,DIAM3,DIAM5and Vol ranged from 0.456 to 0.899 and were all significantly positive,especially between DBH and Vol at 0.899.These findings are in agreement with studies ofJ.curcasL.(Kaushik et al.2015),E.urophylla(Sanchez-Vargas et al.2004),Fagus orientalisLipsky,andCarpinus betulusLipsky(Vahedi et al.2014).The signi ficant correlation coefficient between Vol and AC was also high,which suggests that trees with higher AC may also exhibit higher timber yields.In contrast,Vol showed a larger phenotypic correlation with DBH(0.899)than with Ht(0.459),AC(0.333),BD(0.688),DIAM3(0.526),and DIAM5(0.520).This trend indicates that there was a strong correlation between Vol and DBH,and that plants with a higher DBH may produce more timber.In practical terms,if one wished to use DBH to indirectly select Vol,there would not be much difference in phenotypic gains(Sanchez-Vargas et al.2004),and these traits could also be used as an important index for evaluating and selecting growth properties.I In this research,all the genetic correlation coefficients were similar with phenotypes which indicates that they were strong controlled by genetic factors,which is bene ficial for excellent clones selection.
Comprehensive evaluation using the Qi value
Comprehensive evaluation is an important method for selecting excellent clones or families when analyzing different traits.Selecting for a single trait not only couldin fluence the genetic variance of the selected and correlated traits,but could also change genetic gains and selection ef ficiency(Bulmer 1971).There are many different comprehensive evaluation methods,including the index selection(Jiang et al.1996),the optimal linear breeding value prediction method(White and Hodge 1988),and the fuzzy comprehensive evaluation method(Zadeh 1965).These methods all attach importance to weighted values,and they take all traits into consideration which could simultaneously enhance the ef ficiency of improving many traits.Different comprehensive evaluation methods have distinct advantages and disadvantages,and they use different mathematical methods of discrimination(Luo et al.2010).Regarding multiple-trait comprehensive evaluations,it is convenient and effective to use theQivalue.Furthermore,if too many traits are selected during the evaluation,they may adversely affect the genetic gain and reduce the ef ficiency of a single trait(Guan et al.2005).Therefore,it is necessary to select an appropriate number of traits.In our study,four major growth traits(Ht,DBH,Vol,AC),were selected as evaluation index in conjunction with theQivalue,which proved to be an effective selection method.Finally, five clones(PK11,PK19,PK04,PK14,and PK28)were selected as excellent clones with the best values for the aforementioned traits.

Table 4 continued

?
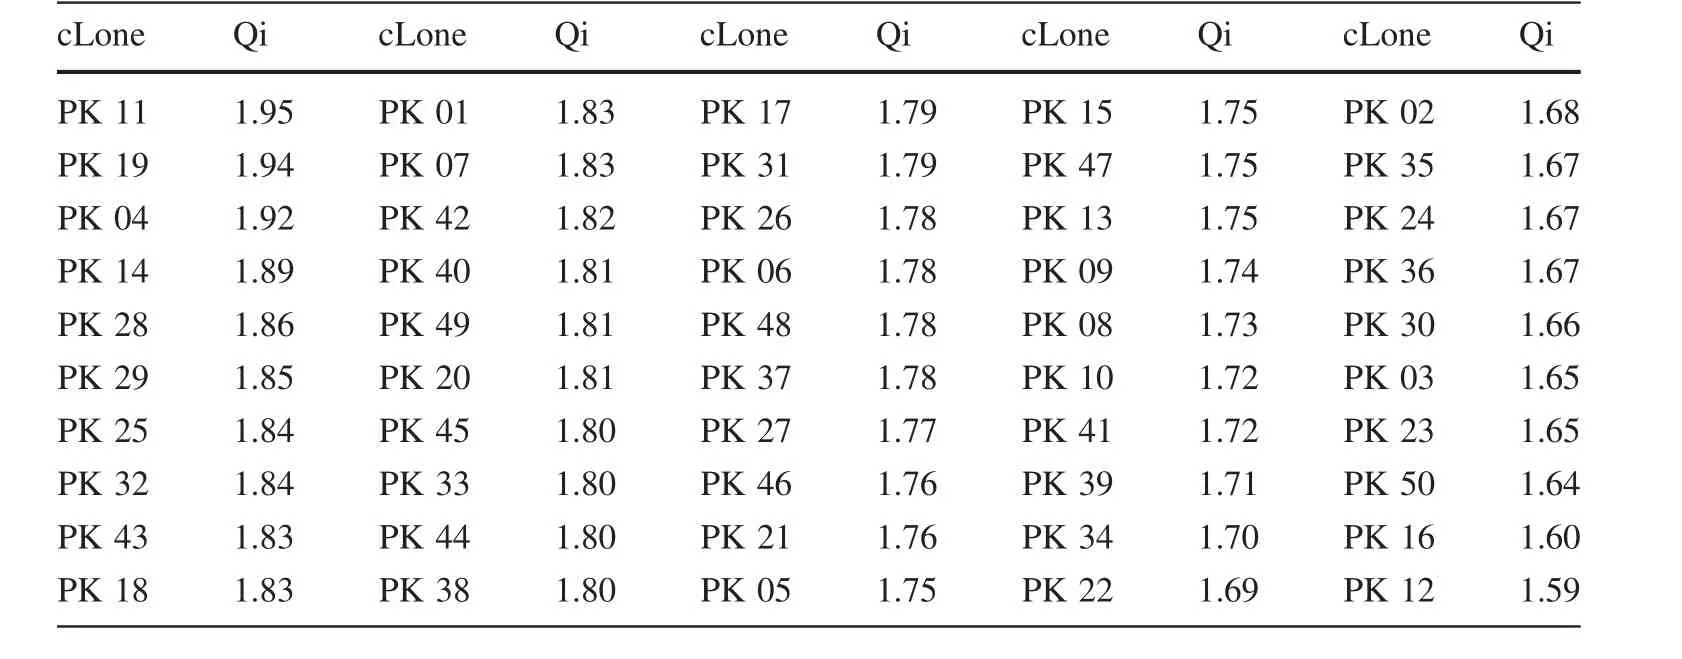
Table 6 Qi values of different clones
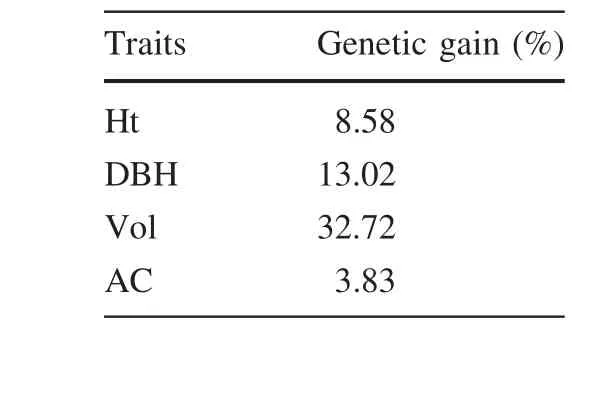
Table 7 Genetic gain of different traits
Genetic gain
Determining the genetic gain delivered by breeding programs is of great importance.Even a small gain in growth rate may often support the expense of such programs for major commercial forestry species.It is of considerable interest to tree breeders,forest owners,and managers to be able to measure genetic gain(Hannrup et al.2000;Kimberley et al.2015).By assessing the resulting genetic gains forP.koraiensis,we observed a higher(32.72%)gain for Vol compared with that of the other traits(Table 7).An analysis based on an year 8 measurement of a 1987 silvicultural breeding trial series found an increase of 16%for Vol(Kimberley et al.2015).Moreover,in a study ofP.halepensis,Matziris(2000)reported that the genetic gains in Ht,DBH,Vol,and CH were 7.9,10.38,21.25,and 3.1%,respectively.Comparable values forP.radiataandP.halepensisfrom previous studies were lower than those in this study(the values for Ht,DBH,Vol,AC were 8.58,13.02,32.72 and 3.83%respectively).These results illustrate the critical importance of large-scale genetic trials.However,such trials are exceedingly expensive and they only serve a limited purpose.The strength of the second stage of selection(the top 10%of the clones)was rather low and increasing the selection strength should result in greater gains.Nevertheless,these data are the best source of information for evaluating the genetic gain forP.koraiensisunder conditions that are comparable to those used in the commercial forestry industry.
Conclusions
In conclusion,there were signi ficant variations in growth traits among different clones.Additionally,there were signi ficant correlations among the most important traits which indicated that some traits together promoted plant growth.High variation and repeatability values indicated that the evaluation and selection ofP.koraiensisclones was effective.Using the four most important growth traits as indices in the comprehensive evaluation,clones PK11,PK19,PK04,PK14,and PK28 were selected as excellent clones,and serious consideration should be given to using them in afforestation programs.A multisite experiment should be conducted,and breeding objectives should combine growth traits,stress resistance,and seed characteristics.With additionaltechnologicaldevelopments,future investigations are also needed to determine the transcriptomic,proteomic,metabolomic,and structural differences among differentP.koraiensisclones,families,and provenances,as well as to improve the genetic manipulation ofP.koraiensis.
References
Asset G,Staels B,Wolff RL,Bauge E,Madj Z,Fruchart JC,Dallongeville J(1999)Effects ofPinus pinasterandPinus koraiensisseed oil supplementation on lipoprotein metabolism in the rat.Lipids 34(1):39–44
Bi CX,Guo JZ,Wang HW,Shu QY(2000)The correlation and path analysis on the quantity characters of Chinese pine.J Northwest For Univ 15(2):7–12
Bulmer M(1971)The effect of selection on genetic variability.Am Nat 105(943):201–211
Camille L,Jean-Pierre R,Audrey G,Christophe G,Franc¸ois B,Franc¸ois H,Denilson Luc H,Christophe P(2011)Genetic parameters of growth,straightness and wood chemistry traits inPinus pinaster.Ann For Sci 68(4):873–884
Chen MG(2012)Research on seedling fast propagation and multitraits comprehensive selection inAlnus formosanaclones.Doctor’s Theses of Central South University of Forestry and Technology
Dean CA,Cotterill PP,Cameron JN(1983)Genetic parameters and gains expected from multiple trait selection of radiata pine in eastern Victoria.Aust For Res 13:271–278
El-Soda M,Malosetti M,Zwaan BJ,Koorneef M,Aarts MG(2014)Genotype×environment interaction QTL mapping in plants:lessons from Arabidopsis.Trends Plant Sci 19(6):390–398
Francisco F,Messias G,Helaine C,Pedro C,Telma N,Ana P,Alexandre P,Geraldo A(2008)Selection and estimation of the genetic gain in segregating generations of papaya(Carica papayaL.).Crop Breed Appl Biotechnol 8:1–8
Fries A(2012)Genetic parameters,genetic gain and correlated responses in growth, fiber dimensions and wood density in a Scots pine breeding population.Ann For Sci 69:783–794
Goli AH,Barzegar M,Sahari MA(2005)Antioxidant activity and total phenolic compounds of pistachio(Pistachia vera)putamina extracts.Food Chem 92:521–525
Gort J,Zubizarreta-Gerendiain A,Peltola H,Kilpelainen A,Pulkkinen P,Jaatinen R,Kellomaki S(2010)Differences in branch characteristics of Scots pine(Pinus sylvestrisL.)genetic entries grown at different spacing.Ann For Sci 67(701–705):708
Guan LH,Pan HX,Huang MR,Shi JS(2005)Research on growth and wood properties joint genetic improvement of new clones ofPoplus deltoides(I-69)×P.euramericana(I-45).J Nanjing For Univ 29(2):6–10
Guo RD(2013)Study on pedigree breeding for the superior families ofFraxinus mandshuricaon the base of multi-trait.Master’s Thesis of Theses Northeast Forestry University
Guo LX(2014)Optimal selection and comprehensive characteristic evaluation of walnut(Juglans regia)in Shangluo from Shanxi province.Master’s Thesis of Northwest Agriculture and Forestry University
Hai PH,Jansson G,Harwood C,Hannrup B,Thinh HH(2008)Genetic variation in growth,stem straightness and branch thickness in clonal trials ofAcacia auriculiformisat three contrasting sites in Vietnam.For Ecol Manage 255:156–167
Han ZQ,Jiang B(2014)A study on comprehensive evaluation of the processing tomato varieties multiple traits.Sci Agric Sin 47(2):357–365
Han SU,Kang KS,Kim TS,Song JH(2008)Effect of top-pruning in a clonal seed orchard ofPinus koraiensis.Ann For Res 51:155–156
Hannrup B,Ekberg I,Persson A(2000)Genetic correlations among wood,growth capacity and stem traits inPinus sylvestris.Scand J For Res 15:161–170
Hansen J,Roulund H(1997)Genetic parameters for spiral grain,stem form,pilodyn and growth in 13 years old clones of Sitka Spruce(Picea sitchensis(Bong.)Carr.).Silvae Genet 46:107–113
Hortensia S,Jordi S,Marcos B,Ma PC,Isabel C(2011)Genetic variation and genotype-environment interactions in short rotationPopulusplantations in southern Europe.New Forest 42:163–177
Isidorov VA,Vinogorova VT,Rafaowski K(2003)HS-SPME analysis of volatile organic compounds of coniferous needle litter.Atmos Environ 37:4645–4650
Isik F,Li B,Frampton J(2003)Estimates of additive,dominance and epistatic genetic variances from a clonally replicated test of loblolly pine.For Sci 49(1):77–88
Jiang JM,Sun HQ,Liu ZX(1996)Multitraits selection ofloblolly pinefamilies for pulpwood.For Res 9(5):455–460
Kaushik N,Deswal R,Suman M,Krishan K(2015)Genetic variation and heritability estimation inJatropha curcasL.progenies for seed yield and vegetative traits.J Appl Nat Sci 7(2):567–573
Kimberley MO,Moore JR,Dungey HS(2015)Quanti fication of realised genetic gain in radiata pine and its incorporation into growth and yield modeling systems.Can J ForRes 45(12):1676–1687
Lai MF,Cui FH,Zeng XP(2001)Peanut variety characteristics of comprehensive evaluation method is discussed in this paper.Chin J Oil Crop Sci 23(1):17–21,26
Li Y,Dong Y,Niu SZ,Cui DQ(2007)The genetic relationship among plant-height traits found using multiple-trait QTL mapping of a dent corn and popcorn cross.Genome 50:357–364
Liu HE,Tong ZK,Liu L,Mao YC,Han YF(1994)Genetic variation and selection for wood properties in pulpwood hybrid poplar.J Zhejiang For College 11(1):1–6
Lu ZH,Xu JM,Lu GH,Zhao RY,Li YW,Li GY(2004)Comprehensive evaluation and evaluation of multiple traits and estimation of breeding value of Eucalyptus.For Res 17(2):220–225
Luo JR,Hu ZQ,Song W(2010)A rank-sum-difference testing method for multi-trait comprehensive ranking.Sci Agric Sin 43(10):2008–2015
Maniee MD,Kahrizi MD,Mohammadi R(2009)Genetic variability of some morphophysiological traits in durum wheat(Triticum turgidumvar.durum).J Appl Sci 9:1383–1387
Marron N,Ceulemans R(2006)Genetic variation of leaf traits related to productivity in aPopulus deltoides×Populus nigrafamily.Can J For Res 36:390–400
Matziris D(2000)Genetic variation and realized genetic gain from Aleppo pine tree improvement.Silvae Genet 49(1):5–9
Midgley JJ,Lawes MJ(2016)Relative bark thickness:towards standardised measurement and analysis.Plant Ecol 217:677–681
Mwase WF,Savill PS,Hemery G(2008)Genetic parameter estimates for growth and form traits in common ash(Fraxinus excelsiorL.)in a breeding seedling orchard at Little Wittenham in England.New Forest 36:225–238
Ren SQ(2010)Study onEucalyptclones for plywood superior variate selection.Master Degree Thesis of Chinese Academy of Forestry
Safavi SA,Pourdad SA,Mohmmad T,Mahmoud K(2010)Assessment of genetic variation among saf flower(Carthamus tinctoriusL.)accessions using agro-morphological traits and molecular markers.J Food Agric Environ 8:616–625
Sanchez-VargasNM,Vargas-HernandezJJ,Ruiz-PosadasLD,Lopez-Upton J(2004)Repeatability of genetic parameters in a clonal test ofEucalyptus urophyllaS.T.Blake in southeastern Mexico.Agrociencia 38(4):465–475
Shi LW(2012)Statistical analysis from entry to the master of SPSS 19.0.Tsinghua University Press,Beijing,p 105
Son Y,Hwang JW,Kim ZS,Lee WK,Kim JS(2001)Allometry and biomass of Korean pine(Pinus koraiensis)in central Korea.Biores Technol 78:251–255
Su XY,Wang ZY,Liu JR(2009)In virto and in vivo antioxidant activity ofPinus koraiensisseed extract containing phenolic compounds.Food Chem 117:681–686
Vahedi AA,Mataji A,Babayi-kafaki S,Eshaghi-rad J,Hodjati SM,Djomo A(2014)Allometric equations for predicting aboveground biomass of beech-hornbeam stands in the Hyrcanian forests of Iran.J For Sci 60(6):236–247
Vestol GI,Colin F,Loubere M(1999)In fluence of progeny and initial stand density on the relationship between diameter at breast height and knot diameter ofPicea abies.Scand J For Res 14:470–480
Wang HM,Xia DA,Wang WJ,Yang SW(2002)Genetic variations of wood properties and growth characters of Korean pines from different provenances.J For Res 13(4):277–280
White TL,Hodge GR(1988)Best linear prediction of breeding values in forest tree improvement program,vol 76(5).Kluwer Academic Publishers,Dordrecht,pp 719–727
Wood ER,Bullock BP,Isik F,Mckeand SE(2015)Variation in stem taper and growth traits in a clonal trial ofloblolly pine.For Sci 61(1):76–82
Xu JR (2006)Quantitative genetics of forest.China Forestry Publishing,Beijing,pp 17–18
Xu DY,Yan H(2001)A study of the impacts of climate change on the geographic distribution ofPinus koraiensisin China.Environ Int 27:201–205
Yang XY,Ji KS(2004)Early selection in forest tree improvement.World For Res 17(2):6–8
Yang X,Ding Y,Sun Z,Zhang D(2005)Studies on chemical constituents ofPinus armandii.Acta Pharm Sin 40:435
Zadeh LA(1965)Fuzzy sets.Inf Control 8:338–353
Zhang Z,Zhang HG,Zhou Y(2015)Variation of seed characters in Korean pine(Pinus koraiensis)multi-clonal populations.J Beijing For Univ 37(2):67–78
Zhao XY,Bian XY,Liu MR,Li ZX,Li Y,Zheng M,Teng WH,Jiang J,Liu GF(2014)Analysis of genetic effects on a complete diallel cross test ofBetula platyphylla.Euphytica 200:221–229
Zhao XY,Xia H,Wang XW,Wang C,Liang DY,Li KL,Liu GF(2016)Variance and stability analyses of growth characters in halfsibBetula platyphyllafamilies at three different sites in China.Euphtyica 208:173–186
 Journal of Forestry Research2018年3期
- Journal of Forestry Research的其它文章
- In vitro propagation of conifers using mature shoots
- ‘Relationships between relationships’in forest stands:intercepts and exponents analyses
- Effects of application date and rate of foliar-applied glyphosate on pine seedlings in Turkey
- Assaying the allelopathic effects of Eucalyptus camaldulensis in a nursery bed incorporated with leaf litter
- Effects of soil compaction on growth variables in Cappadocian maple(Acer cappadocicum)seedlings
- Non-aerated liquid culture promotes shoot organogenesis in Eucalyptus globulus Labill
