
Investigation of active vibration drilling using acoustic emission and cutting size analysis
2018-04-24 00:55YingjinXioChrlesHurichJohnMolgrdStephenButt
Yingjin Xio,Chrles Hurich,John Molgrd,Stephen D.Butt
aFaculty of Engineering and Applied Science,Memorial University of Newfoundland,230 Elizabeth Ave,St.John’s,NL A1B 3X9,Canada
bDepartment of Earth Sciences,Memorial University of Newfoundland,230 Elizabeth Ave,St.John’s,NL A1B 3X9,Canada
1.Introduction
Two major types of drillings are commonly used in the mineral,oil and gas,and construction industries:(i)rotary drilling,where a static thrust or weight-on-bit(WOB)is applied to the bit,and(ii)rotary-percussion drilling,where percussive hammer impacts are applied to the bit in addition to a static WOB.It is well known that the rotary drilling performance,as measured by drilling rate-of penetration(ROP),and the nature and rate of bit wear,are strongly influenced by bit motions and bit-rock interaction.This has been studied using roller cone and polycrystalline-diamondcompact(PDC)drag bits,which are widely used for oil and gas drilling.Theoretical models have been developed to study the forces applied to roller cone bits as well as the correlation with ROP and drilling conditions(Biggs and Cheatham,1969;Sheppard and Lesage,1988).Empirical relations have been proposed to correlate the drag forces on a single-cutter PDC bit with rock type,depth-ofcut(DOC)and bit wear state(Glowka,1989).Some researchers have reported on bit-rock interactions through measurement and evaluation of the three modes of drill string vibrations(i.e.axial,lateral and torsional),recognizing that these drill string vibrations are excited by bit-rock interactions(Richard et al.,2004;Reyes,2016).
At the Drilling Technology Laboratory at Memorial University of Newfoundland,several investigations have focused on using bit vibrations to improve rotary drilling performance.One study used compliant elastomers beneath rock specimens to enhance the oscillatory motions generated by bit-rock interaction while drilling with PDC bits,which resulted in improved cutting efficiency and overall drilling ROP(Babapour and Butt,2014).Thereafter,this idea was further developed and incorporated into a drilling tool,called the passive Vibration-Assisted-Rotary-Drilling(pVARD)tool,which demonstrated improved ROP under both laboratory and field drilling conditions(Rana et al.,2015;Xiao et al.,2015).Another study investigated the influence of active vibration on drilling performance for diamond drilling with coring bits and full-face drag bits using an electromagnetic vibrating table to vibrate the rock specimen while drilling.These studies varied both the amplitude and frequency of the vibration applied,and demonstrated that ROP was generally increased at a rate proportional to the amplitude of vibration,regardless of the vibration frequency(Li et al.,2010;Babatunde et al.,2011).
One major challenge for investigating rotary drilling is the difficulty to visualize the bit-rock interaction and bit penetration process.Cutting analysis has been used to evaluate the penetration mechanisms by relating the size and shape of cuttings to the fracturing mechanisms(Reyes et al.,2015;Xiao et al.,2015),keepingin mind the potential in fl uence of the mineral fabric of the rock(Abugharara et al.,2016).Acoustic emission(AE)technology provides an indirect way of studying these fracturing processes,in which AE signals are generated by the fracturing and are remotely recorded.This technology has been frequently reported in the early studies on investigating microcrack nucleation and crack propagation processes in core specimens under standard strength tests in the laboratory(Lockner,1993).In the drilling area,the bit wear states were distinguished by studying frequency contents of AE signals using carbide rotary bits(Sun,1999)and a single-cutter bit(Hardyet al.,1995;Shen et al.,1997),and by studying the amplitude using twist drill bits(Ferrari and Gómez,2015).Energy related parameters of AE signals were commonly used to study the bit penetration mechanisms such as the root mean square(RMS)of amplitude and the AE event energy.Some researchers have reported that the RMS of an AE signal is an effective measure of its magnitude(Jung et al.,1994).For the drilling with an impregnated diamond bit,the dominant bit action consisted of cutting and friction processes(Most of i,2014),and the processes were investigated by monitoring AE signals.In a diamond coring bit drilling,a variation of RMS levels in AE signals was correlated with varying DOC(Karakus and Perez,2014).In a PDC bit drilling,an average AE energy was calculated to investigate bit penetration mechanisms and drilling performances(Xiao et al.,2015).Related studies at the seismic scale(Brune,1970;Madariaga,1976;Atkinson,1993)have related the frequency content of seismic waves to the length of the generated fractures,with longer fractures generating lower seismic frequencies and vice versa.
Diamond core drilling is the primary form of rotary drilling used for mineral exploration and ore body evaluation.The paper outlines an investigation using AE and drill cuttings characterization to evaluate the penetration mechanisms for drilling with impregnated diamond coring bits while applying passive and active bit vibrations.The experiments comprise a series of DOTs where the WOB is increased in a step-wise manner while maintaining a constant bit vibration condition as provided by compliant specimen mountings and an external vibrating table.These drilling vibration experiments were carried out at the same vibration frequency but with incrementally increasing vibration displacements.AE data were recorded for all of the DOTs to provide information about bit-rock interaction during the DOTs.Based on previous studies,we expected to observe an increase in ROP associated with active vibration.However,these experiments provided further data on the effect of the bit-rock interactions and penetration mechanisms that can influence the ROP.
2.Methodology
2.1.Experimental method
Fig. 1 shows the schematic diagram of the experimental setup for conducting DOTs and monitoring of AEs.A small drilling simulator(SDS)was used to conduct DOTs.With the SDS,a suspended mass provides a known WOB(Khorshidian et al.,2014).A Husqvarna coring bit with the outer diameter of 25.4 mm was mounted to the rig swivel.A constant f l ow rate and pressure of tap water f l ushed the cuttings between the bit and rock away to create space for a new round of penetration.The rotary speed was nominally set as 300 revolutions per minute(RPM)for all DOTs,but this measurement slightly decreased with increasing friction and torque from the increasing WOB(Xiao et al.,2015).However,a detailed calibration of the drilling system showed that the rotary speed was approximately constant for any given value of WOB up to the drilling founder point,where the drilling motor had insufficient torque to turn the bit(Reyes,2016).All DOTs conducted for this investigation were at WOBs less than the founder point.A linear variable differential transformer(LVDT)was used to monitor bit penetration depths that the drill bit actually penetrated,and the depths were measured in unit of mm or m.Cylindrical drilling samples measuring approximately 100 mm in both diameter and length were made from a fine-grained concrete cast using fine aggregate,water and Portland cement.Previous studies conducted using this fine-grained concrete material confirm that it behaves similar for drilling to the low-permeability sedimentary rock with the same unconfined compressive strength(UCS)(Zhang,2017).Table 1 lists the geotechnical properties of this material measured using a standard ASTM strength test(ASTM D7012-14,2014)and a standard ASTM ultrasonic test(ASTM D2845,2008).
Active bit vibration was indirectly provided by one external electromagnetic vibrating table for the purpose of studying the effect on ROP(Fig. 1).The vibration was con figured to be 60 Hz with two varying amplitudes:0.044 mm and 0.055 mm at the lowest WOB,referred to asL1 andL2,respectively.A rock cylinder was firmly mounted on the vibrating table surface,thus they vibrated axially under controlled settings.Fig. 2 is a schematic diagram showing the penetration process of a six-segment diamond coring bit(Karakus and Perez,2014)along with the laboratory two segment diamond coring bit.Drilling parameters include WOB and rotary speed,which is equivalently expressed as angular velocityΩ.The drill bit penetrates downwards perpendicular toX-X′in Fig. 2a and a segment moves rightwards from applied to rque-onbit(TOB)in Fig. 2b.DOC is defined as the penetration depth of drill bit per revolution(mm/rev).DOC numerically equals ROP divided by the rotary speed.Based on the indentation mechanism of diamonds,DOC tends to decrease with increasing diamond size under the same drilling conditions of a single diamond.Fig. 2c shows the two-segment diamond coring bit used in this research with an outer diameter of 25.4 mm.The resultant WOB is then comprised of a combination of a static and a varying weight due to periodical vibrations.Vibration displacements of the rock cylinder were measured by a laser sensor,which was attached to the stationary rig frame of the SDS(Fig. 3).
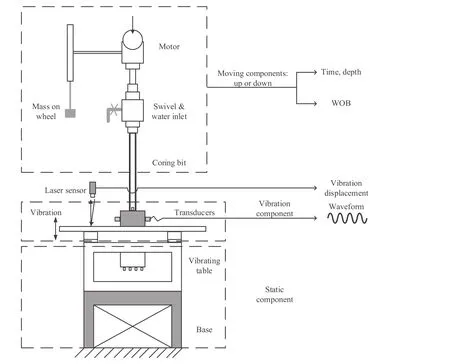
Fig. 1.Schematic diagram for conducting DOTs using a small drilling simulator at the Memorial University of Newfoundland.A DOT is conducted on a concrete cylinder,which is firmly mounted to the vibration table.The vibration levels L1 and L2 are displacement amplitudes of the surface of vibration table measured by a laser sensor.

Table 1Geomechanics and ultrasonic properties of the drilling sample material(Rana et al.,2015).
In all of the tests,four Panametrics P-wave sensors were placed symmetrically around a rock cylinder to monitor AEs.Locations of these sensors were set identical in reference to the top surface of this cylinder and the location of the sensors was the same for all of the tests to ensure a confident comparison of AE signals between varying WOBs as well as different drilling settings.These sensors were calibrated with a central frequency of 1.14 MHz,and a working bandwidth range from 0.65 MHz to 1.63 MHz at-6 dB attenuation.Four preamplifiers,manufactured by Physical Acoustics Corporation,were used to amplify AE signals at a 20 dB gain.A GaGe CompuScope 8280 A/D board sampled these analogue signals at a sampling frequency of 10 MHz.The measurement of AE signals was synchronized to the drilling test.
2.2.Testing scheme
For the DOT experiments,a water f l ow rate of 3.78 L/min and a total of bit-penetration depths of approximately 15 mm were confirmed at each WOB.A group of four increasing WOBs were confirmed:84.1 kg,95.3 kg,106.5 kg and 117.7 kg.In each DOT,the four increasing WOBs were applied on a rock cylinder,and a drilling vibration setting was assigned to this test.Those rock cylinders were cast with the same proportions of materials and their geomechanical properties are shown in Table 1.Table 2 lists the inputs for monitoring AE signals.These configurations were used for the following DOTs.
The first series of DOTs was conducted without active vibration for a range if incrementally increasing WOB.Simultaneously,AE signals were monitored and cuttings were collected,providing data for frequency content and event energy analysis and a particle size distribution(PSD)analysis.The second phase of the experiment consisted of two series of active vibration drillings.All other drilling parameters remained the same with the exception of vibration displacement.The two axial displacement settings had been previously described asL1 andL2(L1<L2).
3.Data acquisition and processing
For each DOT,drilling related data are obtained,i.e.WOB,bit penetration depth-time,and vibration displacement-time.Synchronized AE signals are recorded as well.
Fig. 4 shows an example of the analysis processes for ROP based on bit-penetration depth-time,and of bit vibration from vibration displacement-time.The bit-penetration depth was measured to be 10 mm approximately when the vibration setting ofL1 and the WOB of 95.3 kg were chosen.The bit-penetration depth was determined by moving the average of the time-depth data,resulting in a smooth average depth curve.This curve is quasilinear and the slope of this curve was then taken as the ROP.Bit vibration data were first processed by removing the trends of original vibration displacement.Spectral analysis using a fast Fourier transform(FFT)method was used to study a window of vibration displacement(the black square),indicating a dominant frequency of 60 Hz which is consistent with the working frequency of the vibrating table.The magnitude of vibration displacement,within the linear portion of the bit-penetration depth-time curve,was studied using the RMS method(Eq.(1)),which was an effective parameter for evaluating the vibration magnitude as reported by other researchers(Karakus and Perez,2014).The above data processing was facilitated by a routine in MATLAB.

Fig. 2.Schematic view of a diamond coring bit drilling:(a)drilling parameters for a six-segment diamond bit,(b)penetration process of a single segment,and(c)two-segment diamond bit used in this paper.Ωis the angular velocity,R is the radius of a segment,and V is the linear speed of a segment.This is modified after Karakus and Perez(2014).

Fig. 3.Overview of the DOT setup(a)with a concrete cylinder for mounting AE transducers,and(b)the laser sensor attached to the stationary rig frame.Diamond bit of Fig. 2c is used to be here.
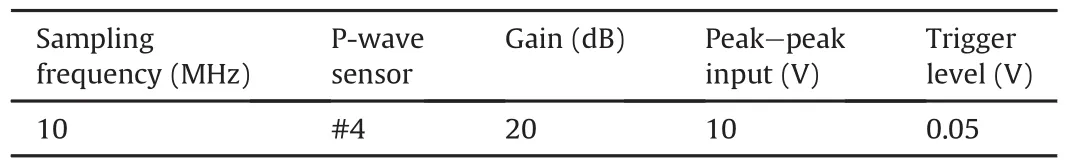
Table 2Inputs for monitoring acoustic emission.

whereVRMSis the RMS level of data,Tis the time period of waveform,andViis the instantaneous value.
Fig. 5 shows a sample AE signal with 16,384 points at a sampling frequency of 10 MHz.By an FFT analysis of the whole signal,the resultant frequency spectrum shows a considerable peak frequency of 133 kHz.Fig. 6 shows four waveforms of a single AE event recorded at four sensors.For the four waveform characteristics,peak frequencies and spectral centroids remain approximately the same;whilst the waveform energy is significantly different for the four channels due to the distance to AE sources and coupling issue.In this way,one channel of signals is selected for further analysis.With this method,multiple AE signals were analyzed and similar frequency peaks were found.In this manner,this peak frequency was picked as a means of characterizing the AE signal.In each DOT,fifteen AE signals were randomly selected for spectral analysis and corresponding peak frequencies were further characterized by the arithmetic average peak frequency and the standard deviation.In addition,the spectral centroid of 264 kHz was obtained based on the frequency spectrum at a frequency range of 0-1 MHz.This range was chosen to filter out most of the high frequency noise.The arithmetic average and standard deviation of spectral centroids were calculated from over eighty consecutive AE signals.

Fig. 4.A sample DOT synchronized with the displacement of the vibrating table(a)at vibration L1 and WOB of 95.3 kg,from which an analysis window of vibration(b)and the corresponding frequency spectrum(c)are obtained.The peak frequency of 60 Hz represents the working frequency of the vibrating table.
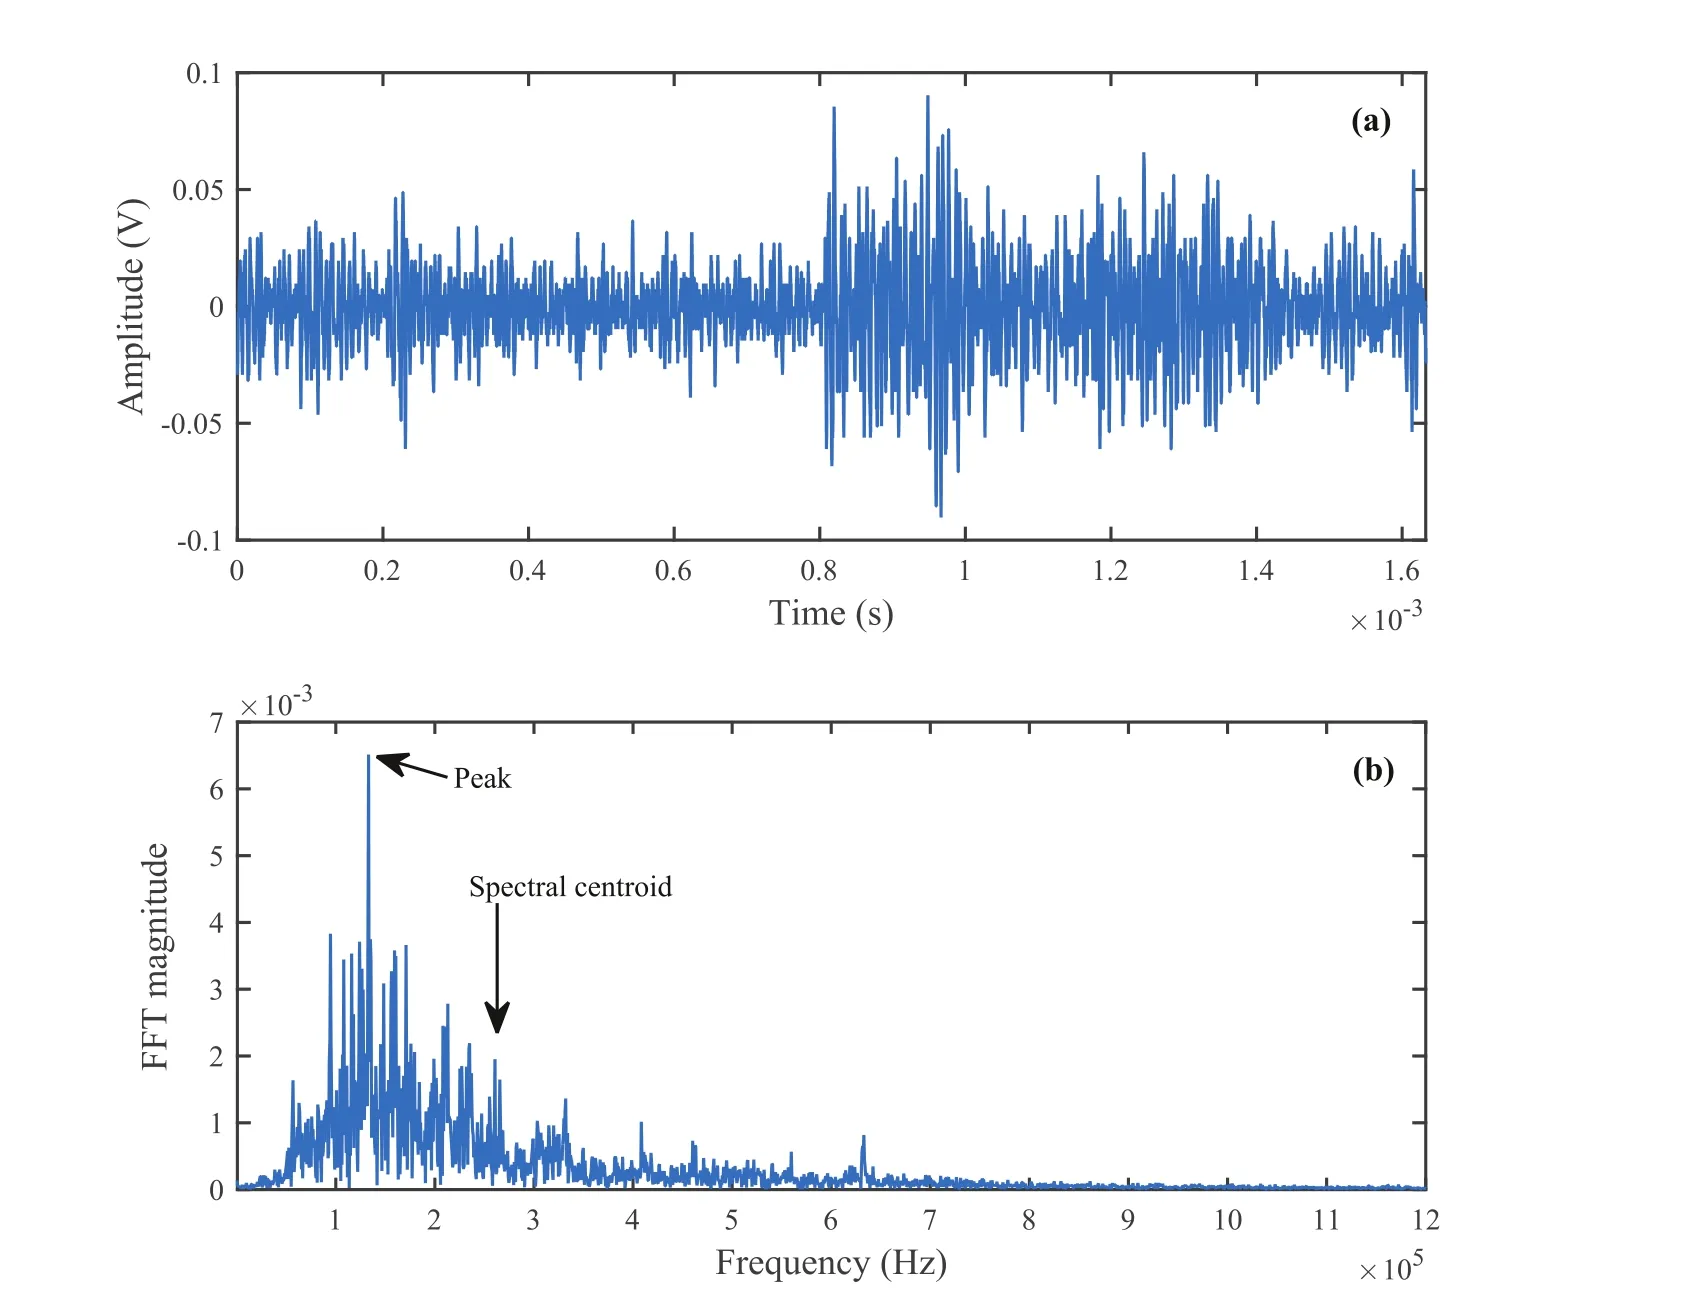
Fig. 5.A sample AE signal(a)with its frequency spectrum(b)indicating a peak frequency of 133 kHz and a spectral centroid of 264 kHz at vibration L1 and WOB of 95.3 kg.The spectral centroid is calculated based on a frequency range of 0-1 MHz.
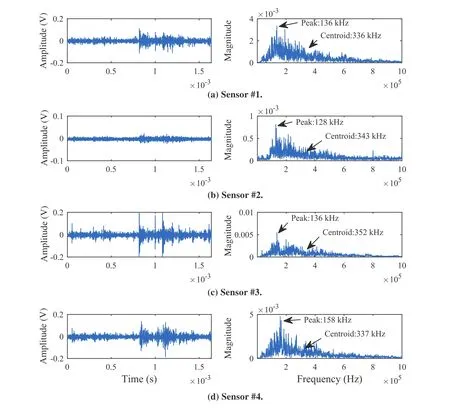
Fig. 6.Four waveforms of a single event recorded by four AE sensors from passive drilling at WOB of 106.5 kg.Each waveform is shown in left panel,and the peak frequency and spectral centroid are shown in right panel.
Fig. 7 shows the event count and the average event energy of AEs recorded during a DOT.Every AE signal was grouped by its triggered time and synchronized with the drilling test.Multiple AE signals were continuously triggered and they were recorded at every 2 s according to the data acquisition system.In this figure,an effective drilling penetration process was marked within the time range of 0-20 s and corresponding AE signals were included for further analysis.By integration of a rectified AE waveform,the event energy was obtained on the time domain based on the method developed by other researchers(e.g.Butt and Calder,1998).In this way,this energy has the unit of volt by second or Vs.It is approximately the same as the area under waveform FFT.At a specific time,average event energy was then calculated by an arithmetic mean method on multiple AE event energies.In an effective drilling time window,e.g.from 0 to 20 s herein,the average event energy was then calculated and taken as the AE energy level for this DOT.
4.Data analysis and interpretation
4.1.Drilling performance and vibration
Fig. 8 shows the experimental results demonstrating the relationship between ROP and the corresponding vibration level with respect to WOB for the three drilling settings.
In Fig. 8a,the results show an increase in ROP with increasing WOB.At the same WOB,ROP is positively correlated with vibration level.In particular,under a higher WOB,the differences in ROP between three vibration settings are greater than that under a lower WOB.This indicates that axial bit vibration functions to improve ROP at a higher WOB under these experimental conditions.
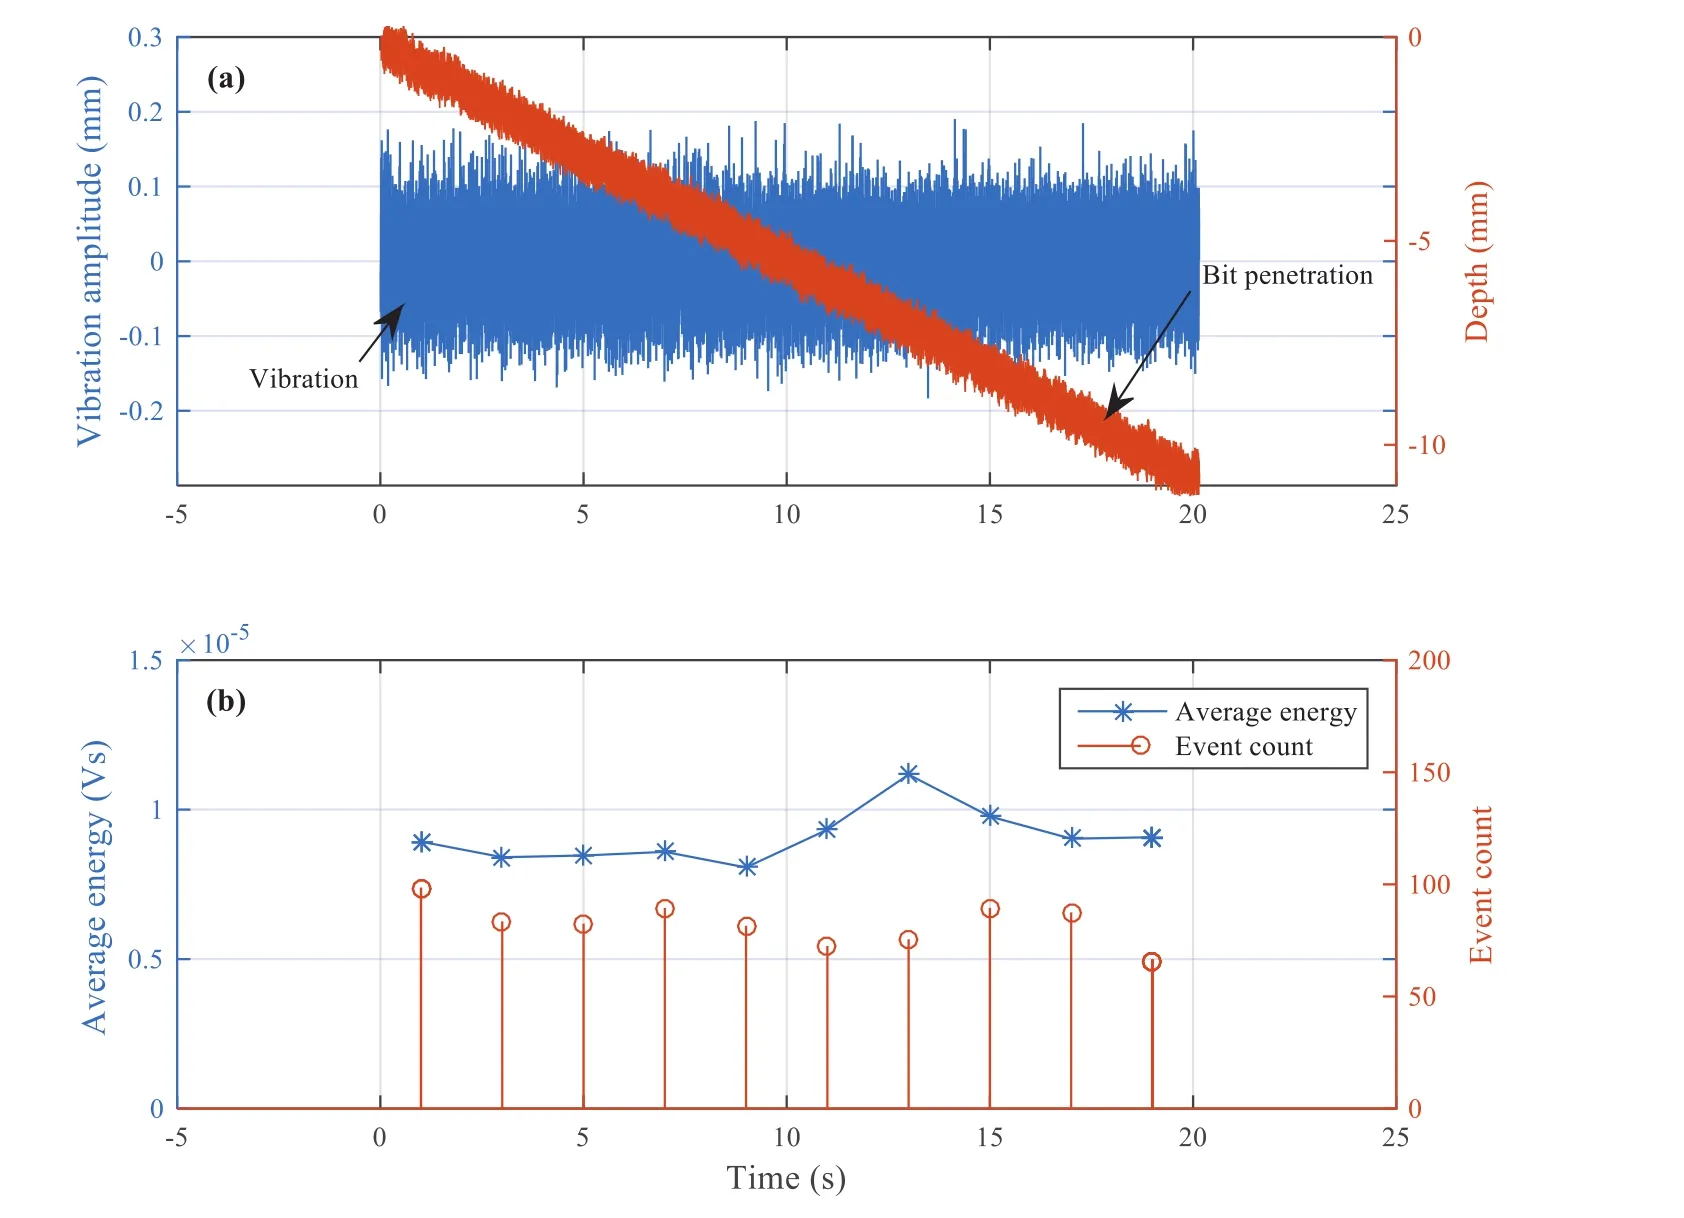
Fig. 7.A sample DOT with synchronized vibration(a)and synchronized AE count and average energy(b)at vibration L1 and WOB of 95.3 kg.The time at 0 shows the start of the DOT.
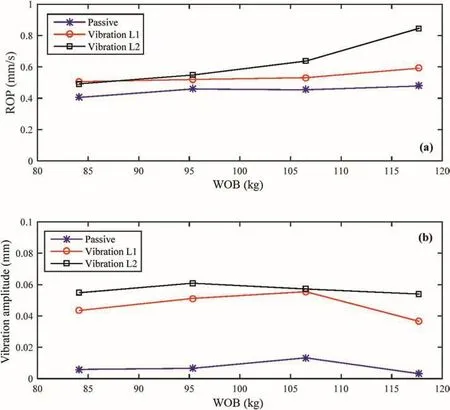
Fig. 8.An assembly of both ROP(a)and the corresponding vibration level(b)in correlation with WOB.ROP is positively correlated with WOB.
In Fig. 8b,the vibration levels for both vibration settings increase at the beginning due to the decrease of vibrating system compliance with increasing WOB.In this way,the vibrating system vibrates more effectively at the rated vibration setting.Then,the vibration levels decrease slightly with increasing WOB due to the depression of vibration from high WOBs,confirming the results of this system reported by other researchers(e.g.Li,2011).At different WOBs,vibration displacements vary and variations of 10%and 14%are shown for vibration drilling settingL1 andL2,respectively.This indicates a relatively stable change of vibration displacement with respect to WOB.The passive vibrations are not zero due to the existence of compliance of the vibration table.The two active vibration levels are provided here as the first stage of evaluating the drilling performance with respect to the active vibration levels.
4.2.Acoustic emission analysis
Figs.9 and 10 show the frequency distributions in correlation with WOB for the three drilling settings.For every DOT,Fig. 9 shows the peak frequency calculated by the arithmetic average method based on the fifteen peak frequencies.While Fig. 10 shows the spectral centroid with respect to WOB.The results show that the peak frequency decreases with increasing WOB.Research on seismology has shown a reverse relation between a corner frequency to a crack size(Brune,1970;Madariaga,1976;Atkinson,1993).In this manner,the decrease in the peak frequency here indicates an increase in the crack size from a diamond bit penetration process when WOBs are increased.In addition,under the same WOB,a decrease in peak frequency is observed,which indicates an increase in the crack size with the increasing vibration level.This decrease is more apparent at a higher WOB than that at a lower WOB,which confirms that bit vibration functions more efficiently at a higher WOB.
Fig. 11 plots the average energy with respect to WOB and ROP.In Fig. 11a,the average energy of AE is elevated with the increase in WOB,when the corresponding ROP increases.Under the same WOB,the average energy is greater with a higher level of vibration(L2>L1>Passive).These results indicate that AE average energy is positively correlated with the ROP as shown in Fig. 11b.This phenomenon is consistent with the results obtained by previous research,i.e.the higher RMS of an AE signal correlates with a higher DOC(Karakus and Perez,2014),or a higher AE energy comes from a higher ROP(Xiao et al.,2015).In summary,diamonds cut more aggressively with a higher level of ROP,resulting in a greater magnitude of AE energy from rock cracking.
From the previous analyses,a summary is given here based on AE parameters(peak frequency and average energy)in response to WOB.An increase in WOB causes increases in the size of crack and corresponding average energy of AE signals recorded from the diamond bit penetration process.In this way,an elevation of ROP is obtained from increasing WOB.In addition,an increase in vibration levels functions similarly.As a result,bit vibration improves the bit rock interaction conditions thereafter enhances the diamond bit penetration.
4.3.Cutting size distribution
4.3.1.Particle size distribution(PSD)
The analysis of cutting PSD was conducted using two standard particle size analysis methods:sieving analysis for grain sizes greater than 75μm and hydrometer analysis for smaller particles.The sieving analysis involved using different sizes of meshes to retain cutting particles,and the weight percentages of each size of particles were assembled according to ASTM D6913(2009).The hydrometer analysis involved quantitative determination of PSD by sedimentation process using a floating hydrometer following ASTM D422-63(2007).Based on all particle size and corresponding passed weight percentage,the cumulative passed weight percentage-mesh size curve is plotted in normal-logarithmic coordinates,i.e.the PSD chart.

Fig. 9.Peak frequency distribution in correlation with WOB at drilling with settings of passive,vibrations L1 and L2.An arithmetic average of the peak frequencies is obtained based on fifteen events at each WOB.Peak frequency is found to decrease with increasing WOB.

Fig. 10.Spectral centroid with respect to WOB for the three drilling settings.Spectral centroids decrease with increasing WOB.

Fig. 11.Average energy of AEs in positive correlation to(a)WOB and(b)ROP for all DOTs using three settings of passive,vibrations L1 and L2.Bit vibration enhances the AE average energy.

Fig. 12.PSD charts for all DOTs using the three settings,i.e.passive,vibrations L1 and L2.Cutting is coarser when the PSD curve shifts to the right for each drilling setting.
Fig. 12 shows the PSD charts for drilling using three settings.A PSD curve corresponds to a drilling.The charts show that the maximum particle size from the three drillings is less than 1 mm.When a single PSD curve shifts to the right for each drilling setting,the particle size tends to be larger with the increase in WOB which is also correlated with the increasing ROP.This scenario has been reported by other researchers,i.e.a higher DOC causes a higher percentage of coarser cuttings(Hardy et al.,1995).PSD curves are barely distinguishable when the mesh size is over 0.4 mm.This is because a minor portion of cuttings(size over 0.4 mm)was obtained from the overall cuttings for each DOT.
4.3.2.Mean particle size
Mean particle size is commonly used to quantitatively characterize the PSD.In 1933,a PSD function was first proposed from a sieving analysis on powdered coal,known as the Rosin-Rammler(RR)model(Rosin and Rammler,1933),or Rosin-Rammler-Sperling-Bennett(RRSB)model(Merkus,2009).Later,this model is widely used to describe the PSD of powders of various types and sizes,and is specifically suited to representing powders from operations such as grinding,milling,and crushing(Djamarani and Clark,1997).This two-parameter function is described in Eq.(2),from which the mean particle size can be obtained.

whereR(d)is the retained weight fraction or cumulative weight percentage(%),dis the particle size or mesh size(μm),dmis the mean particle size(μm),andnis the measure of the spread of particle sizes distribution parameter.
Both mean particle sizedmand distribution parameterncan be estimated by equation fitting on experimental data.Calculations of the two parameters are commonly done by linear regression of data represented as log[-log(cumulative weight percentage)]versus log(retaining powder sieve size).In this method,36.79%of the cumulative weight corresponds to the theoretical mean particle size calculated using a MATLAB routine(Brezani and Zelenak,2010).Fig. 13 shows three samples of PSD and corresponding linear regression fittings using this routine.Mean particle sizes for the three incremental WOBs are found to be 0.026 mm,0.049 mm and 0.069 mm,respectively.
Fig. 14 shows the mean particle sizes for DOTs using the three settings.Mean particle sizes increase with increasing WOB,which corresponds to the visual understanding from the previous PSD charts.Under the same WOB,the mean particle size is increased when the vibration level is elevated.Based on the positive correlation of ROP with the bit vibration level previously reported,it confirms that a higher level of vibration helps the diamond bit cut in a larger depth per revolution and coarser cuttings are obtained.
4.4.Correlation of ROP to AE energy and cutting size

Fig. 13.Demonstration of mean particle sizes for three increasing WOBs using the RR diagram,modified from Brezani and Zelenak(2010).Mean particle size is obtained as the mesh size at 36.79%retained.
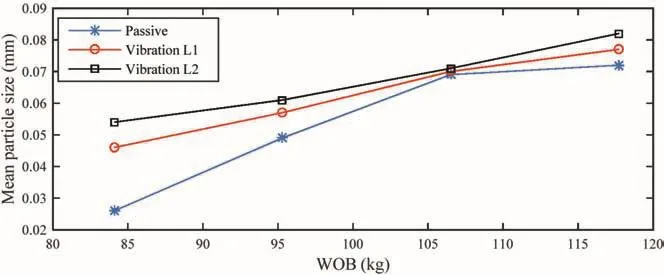
Fig. 14.Mean particle size positively correlated with WOB for DOTs using the three settings.Coarser cutting is obtained with the increase in WOB.
The response of cutting size distribution or mean particle size to WOB can be related to the previously described AE parameters.The average energy of AEs shows a positive correlation to the crack size,in terms of ROP,which is positively correlated with cutting size.In this manner,the increase in ROP comes from the increase in the average energy of AEs resulting from larger cracks during the diamond bit penetration process,causing coarser cuttings.
5.Conclusions
(1)For an increase in WOB and also an increase in vibration level,the ROP is in a positive correlation with AE energy,crack size,cutting size distribution and mean particle size.
(2)Diamond bit penetration mechanism is indirectly characterized by AE parameters,i.e.peak frequency,spectral centroid and average energy.They are successfully correlated with crack size,confirming the results reported by other researchers.
(3)A higher level of bit vibration improves the diamond bit-rock interaction,thus helps a diamond bit cut more aggressively,resulting in a better drilling performance.
Conflicts of interest
The authors wish to confirm that there are no known Conflicts of interest associated with this publication and there has been no significant financial support for this work that could have influenced its outcome.
Acknowledgements
The research was conducted at the Drilling Technology Laboratory of Memorial University of Newfoundland and funded by Atlantic Canada Opportunity Agency(AIF contract number:781-2636-1920044),involving Husky Energy,Suncor Energy and Research and Development Corporation(RDC)of Newfoundland and Labrador.
Abugharara AN,Alwaar MA,Hurich C,Butt SD.Laboratory investigation on directional drilling performance in isotropic and anisotropic rocks.In:The 50th U.S.Rock mechanics/geomechanics symposium,2016,Houston.vol.3.Alexandria:American Rock Mechanics Association;2016.p.1776-84.
ASTMD422-63.Standard test method for particle-size analysis of soils.West Conshohocken PA:ASTM International;2007.
ASTM D2845.Standard test method for laboratory determination of pulse velocities and ultrasonic elastic constants of Rock.West Conshohocken,PA:ASTM International;2008.
ASTM D6913.Standard test methods for particle-size distribution(gradation)of soils using sieve analysis.West Conshohocken,PA:ASTM International;2009.https://doi.org/10.1520/D6913-04R09E01.
ASTM D7012-14.Standard test method for compressive strength and elastic moduli of intact rock core specimens under varying states of stress and temperatures.West Conshohocken,PA:ASTM International;2014.
Atkinson GM.Earthquake source spectra in eastern North America.Bulletin of the Seismological Society of America 1993;83(6):1778-98.
Babapour S,Butt SD.Investigation of enhancing drill cuttings cleaning and penetration rate using cavitating pressure pulses.In:The 48th U.S.Rock mechanics/geomechanics symposium,2014,Minneapolis.vol.1.Alexandria:American Rock Mechanics Association;2014.p.362-7.
Babatunde Y,Butt SD,Molgaard J,Arvani F.Investigation of the effects of vibration frequency on rotary drilling penetration rate using diamond drag bit.In:45th U.S.Rock mechanics/geomechanics symposium,2011.San Francisco.Alexandria:American Rock Mechanics Association;2011.p.11-527.ARMA.
Biggs MD,Cheatham JB.Theoretical forces for prescribed motion of a roller bit.Society of Petroleum Engineers Journal 1969;9(4):473-81.
Brezani I,Zelenak F.Improving the effectivity of work with Rosin-Rammler diagram by using MATLAB GUI tool.Acta Montanistica Slovaca 2010;15:152-7.
Brune JN.Tectonic stress and the spectra of seismic shear waves from earthquakes.Journal of Geophysical Research 1970;75:4997-5009.
Butt SD,Calder PN.Experimental procedures to measure volumetric changes and microseismic activity during triaxial compression tests.International Journal of Rock Mechanics and Mining Sciences 1998;35(2):249-54.
Djamarani KM,Clark IM.Characterization of particle size based on fine and coarse fractions.Powder Technology 1997;93(2):101-8.
Ferrari G,Gómez MP.Correlation between acoustic emission,thrust and tool wear in drilling.Procedia Materials Science 2015;8:693-701.
Glowka DA.Use of single-cutter data in the analysis of PDC bit designs:part 1-development of a PDC cutting force model.Journal of Petroleum Technology 1989;41(8):797-849.https://doi.org/10.2118/15619-PA.
Hardy HR,Shen HW,Kimble EJ.Laboratory studies of acoustic emission during coal cutting.In:The 13th International modal analysis conference,1995,Nashville.vol.2460.Bellingham:SPIE;1995.p.1743-55.
Jung SJ,Prisbrey K,Wu G.Prediction of rock hardness and drillability using acoustic emission signatures during indentation.International Journal of Rock Mechanics and Mining Sciences&Geomechanics Abstracts 1994;31(5):561-7.
Karakus M,Perez S.Acoustic emission analysis for rock-bit interactions in impregnated diamond core drilling.International Journal of Rock Mechanics and Mining Sciences 2014;68:36-43.
Khorshidian H,Butt SD,Arvani F.influence of high velocity jet on drilling performance of PDC bit under pressurized condition.In:The 48th U.S.Rock mechanics/geomechanics symposium,2014,Minneapolis.vol.1.Alexandria:American Rock Mechanics Association;2014.p.343-8.
Li H,Butt SD,Munaswamy K,Arvani F.Experimental investigation of bit vibration on rotary drilling penetration rate.In:The 44th U.S.Rock mechanics symposium and 5th U.S.-Canada rock mechanics symposium,2010.Salt Lake City.Alexandria:American Rock Mechanics Association;2010.p.10-426.ARMA.
Li H.Experimental investigation of the rate of penetration of vibration assisted rotary drilling.MSThesis.St.John’s,Canada:Memorial University of Newfoundland;2011.p.64.
Lockner D.The role of acoustic-emission in the study of rock fracture.International Journal of Rock Mechanics and Mining Sciences 1993;30(7):883-99.
Madariaga R.Dynamics of an expanding circular fault.Bulletin of the Seismological Society of America 1976;66(3):639-66.
MerkusHG.Particle size measurements:fundamentals,practice,quality.Netherlands:Springer;2009.p.27.
Mostof iM.Drilling response of impregnated diamond bits:modelling and experimental investigations.PhD Thesis.Perth,Australia:Curtin University;2014.p.16.
Rana PS,Abugharara AN,Butt SD,Molgaard J.Experimental evaluation of passive-Vibration Assisted Rotary Drilling(p-VARD)tool to enhance drilling performance.In:The 49th U.S.Rock mechanics/geomechanics symposium,2015,San Francisco.vol.3.Alexandria:American Rock Mechanics Association;2015.p.1729-34.
Reyes R,Kyzym I,Rana PS,Butt SD,Molgaard J.Cuttings analysis for rotary drilling penetration mechanisms and performance evaluation.In:The 49th U.S.Rock mechanics/geomechanics symposium,2015,San Francisco.vol.2.Alexandria:American Rock Mechanics Association;2015.p.1498-505.
Reyes R.Bit-rock interaction in rotary drilling:numerical and experimental study.MS Thesis.St.John’s,Canada:Memorial University of Newfoundland;2016.
Richard T,Germay C,Detournay E.Self-excited stick-slip oscillations of drill bits.Comptes Rendus Mécanique 2004;332(8):619-26.
Rosin P,Rammler E.The laws governing the fineness of powdered coal.Journal of the Institute of Fuel 1933;7:29-36.
Shen HW,Hardy HR,Khair AW.Laboratory study of acoustic emission and particle size distribution during rotary cutting.International Journal of Rock Mechanics and Mining Sciences 1997;34(3/4):121.e1-16.
Sheppard MC,Lesage M.The forces at the teeth of a drilling rollercone bit:theory and experiment.Vol.DELTA.In:The SPE annual technical conference and exhibition,1988,Houston.Richardson:Society of Petroleum Engineers of AIME;1988.p.253-60.
Sun X.A study of acoustic emission in drilling applications.In:The 37th U.S.symposium on rock mechanics,1999.Rock Mechanics for Industry.vol.1.Alexandria:American Rock Mechanics Association;1999.p.983-90.
Xiao Y,Zhong J,Hurich C,Butt SD.Micro-seismic monitoring of PDC bit drilling performance during vibration assisted rotational drilling.In:The 49th U.S.rock mechanics/geomechanics symposium,2015,San Francisco.vol.3.Alexandria:American Rock Mechanics Association;2015.p.1963-9.
Zhang Z.Development and characterization of synthetic rock-like materials for drilling and geomechanics experiments.MS Thesis.St.John’s,Canada:Memorial University of Newfoundland;2017.
 Journal of Rock Mechanics and Geotechnical Engineering2018年2期
- Journal of Rock Mechanics and Geotechnical Engineering的其它文章
- A new design equation for drained stability of conical slopes in cohesive-frictional soils
- Resilient modulus prediction of soft low-plasticity Piedmont residual soil using dynamic cone penetrometer
- Assessment of natural frequency of installed offshore wind turbines using nonlinear finite element model considering soil-monopile interaction
- Behavior of ring footing resting on reinforced sand subjected to eccentric-inclined loading
- Validation of critical strain technique for assessing stability of coal mine intersections and its potential for development of roof control plans
- Numerical analysis of Shiobara hydro power cavern using practical equivalent approach