Resilient modulus prediction of soft low-plasticity Piedmont residual soil using dynamic cone penetrometer
S.Hamed Mousavi,Mohammed A.Gabr,Roy H.Borden
Department of Civil,Construction,and Environmental Engineering,North Carolina State University,Raleigh,NC 27695-7908,USA
1.Introduction
The resilient modulus of subgrade soils is a fundamental parameter in the design of pavement structures,as recommended in the mechanical-empirical pavement design guide,MEPDG(NCHRP,2004).The resilient modulus is defined as the ratio of the applied cyclic axial stress to the recoverable axial strain(NCHRP,2003):

whereMris the resilient modulus,σcyclicis the cyclic axial stress 0.9σd,and3ris the resilient axial strain.
While the resilient modulus can be determined from laboratory testing,performing the test requires a well-trained operator and substantial time,as well as advanced apparatus.An alternative to laboratory testing is the use of empirical correlations developed on the basis of statistical analyses and utilizing the physical and engineering properties of soils.Carmichael and Stuart(1985),Elliott et al.(1988),Drumm et al.(1990),Farrar and Turner(1991),and Hudson et al.(1994)all proposed models to estimate the resilient modulus of subgrade soils on the basis of material index properties.
As an alternative,Hasan(1996),Rahim and George(2004),Herath et al.(2005),and Mohammad et al.(2008)have proposed correlations to predictMrfrom in situ dynamic cone penetrometer(DCP)data.The advantage of using DCP is that of testing the soil in its natural density and moisture content state.These correlations,however,provide theMrat only one specific stress state,i.e.at a confining pressure of 13.8 kPa(2 psi)and a deviatoric stress of 41.7 kPa(6 psi).These values represent the stress level at the top of the subgrade layer under standard single axle loading of 80 kN(18 kips)and tire pressure of 689 kPa(100 psi)with a 50 mm asphalt wearing course,a 100 mm asphalt binder course and a 200 mm aggregate base course(Asphalt Institute,1989;Rahim and George,2004;Mohammad et al.,2008).Since the resilient modulus depends on the confining pressure and applied deviatoric stress,any change in the pavement structure,axle load and tire pressure will lead to a change in the stress state at the surface of the subgrade.Accordingly,the predictedMrby existing correlations may not be representative of the field stress conditions.
On the other hand,many studies have been performed over the past two decades to model the stress dependency of the resilient modulus by predicting the coefficients of a general constitutive model(e.g.Dunlap,1963;Seed et al.,1967;Witczak and Uzan,1988;Pezo,1993;NCHRP,2003)on the basis of soil index properties.These properties included water content,w,plastic limit,PL,liquid limit,LL,percentage passing the No.4 sieve,P4,and percentage passing the No.200 sieve,P200,etc.Yau and Von Quintus(2002),Elias and Titi(2006),Nazzal and Mohammad(2010),and Titi and English(2011)have each proposed different models to estimate the NCHRP(2004)constitutive model coefficients(k1,k2andk3),expressed in Eq.(2);however,these models have been developed based on the compacted specimens and do not consider the properties of the undisturbed soil in its natural state.

In the MEPDG recommended model,Mris linearly influenced byk1,while the exponentsk2andk3respectively define the rate of increase and decrease of stiffness hardening and soil softening(Yau and Von Quintus,2002)with respect to the confining and deviatoric stresses.However,as currently formulated,all three coefficients are independent of the stress state.
This paper includes a review of models that are based on correlatingk1,k2andk3to basic soil properties.This is the context of the proposed approach,albeit using dynamic cone penetration index(DCPI)instead of basic soil properties.A model is proposed in this paper to calculate the resilient modulus of the low-plasticity Piedmont residual subgrade soils from the DCP data.Piedmont residual soils are in-place weathered soils from igneous and metamorphic rock,as opposed to transported or compacted soils.Hence the existing empirical correlation might not be applicable for these soils(Borden et al.,1996).The model is developed based on the in situ DCP measurements and laboratory resilient modulus on the undisturbed specimens retrieved from Shelby tubes.The model is based on calculatingMrto predict the constitutive model coefficients(k1,k2andk3)from the in situ DCP data.By utilizing in situ measured DCP data in predicting the constitutive model coefficients,the proposed approach allows for taking into account the stress dependency of the resilient modulus,as well as properties of the soil in its natural state.The validity of the proposed model is examined with the portion of data set not used in the model development,as well as reported data in the literature.
2.Background

Fig. 1.DCP sketch(after ASTM D6951-09,2009).
DCP is a portable instrument widely used in geotechnical and pavement design for estimating the shear strength and stiffness properties of soils(Gabr et al.,2000,2001;Chen et al.,2005).As shown in Fig. 1,and presented in ASTM D6951-09(2009),DCP consists of an 8 kg sliding hammer,with a 57.5 cm(22.6 in)drop height,a 111 cm(44 in)driving shaft and a 60?angle cone tip.During the DCP test,the sliding hammer falls 57.5 cm vertically and drives the cone tip attached to the bottom of the DCP rod into the ground.The penetration depth is recorded after each drop(blow)on avertical stake positioned next to the DCP rod.DCPI is expressed in inch or mm per blow.
Several correlations have been proposed in the literature between DCPI,soil shear strength and stiffness properties,such as those for the California bearing ratio(CBR)(NCDOT,1998;Gabr et al.,2000),the undrained shear strength(Su)(Ayres,1997),the elastic modulus(E)(Chai and Roslie,1998;Abu-Farsakh et al.,2004;Chen et al.,2005),and the resilient modulus(Mr)(Hasan,1996;Herath et al.,2005).
Existing empirical correlations,which correlate DCPI toMr,are summarized in Table 1.These models are capable of providing an estimate of stiffness properties of soils;however,theyare restricted to a confining pressure of 13.79 kPa(2 psi)and a deviatoric stress of 41.37 kPa(6 psi).
3.Experimental program
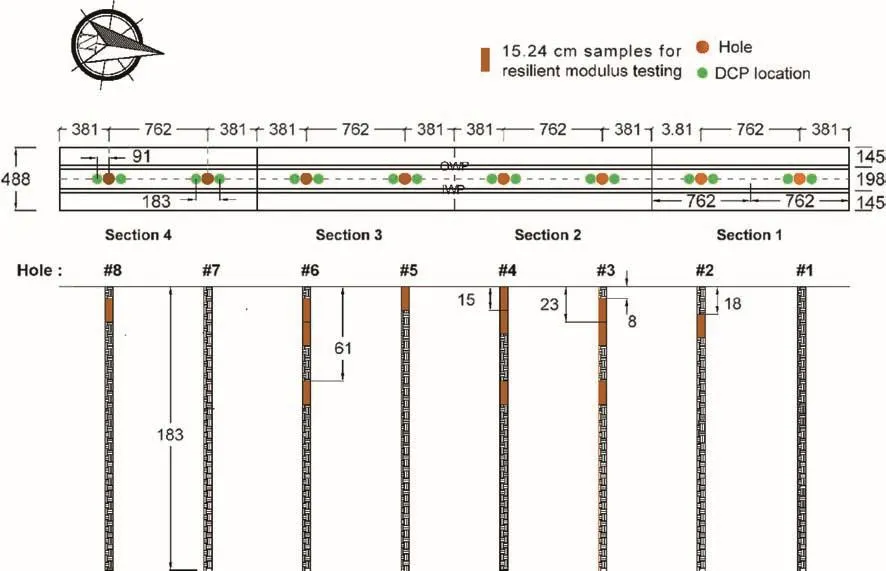
The experimental program included a series of laboratory resilient modulus and in situ DCP tests.The sampling and field testing programs were performed at four 4.88-m(16-ft)wide by 15.24-m(50-ft)long test sections located in the Piedmont area,North of Greensboro,North Carolina.The DCP tests were performed at four locations in each test section,as shown in Fig. 2.The laboratory testing,including the resilient modulus and index properties,was performed on undisturbed soil specimens retrieved from Shelby tubes.These tubes were taken from boreholes located between each pair of DCP tests,as indicated in Fig. 2.More details onexperimental program and results can be found in Mousavi et al.(2016).

Table 1Previous direct DCP models.

Fig. 2.Locations of DCP tests and resilient modulus test specimens(dimensions in cm).Here OWP indicates the outer wheel path and IWP indicates the inner wheel path.
3.1.Materials tested
The physical property tests included specific gravity,grain size distribution,Atterberg limits and standard compaction by following ASTM D422-63(2007),ASTM D6913-09(2009),ASTM D1557-09(2009),ASTM D854-10(2010),ASTM D2216-10(2010),and ASTM D4318-10(2010).These tests were conducted on the specimens after the resilient modulus tests were completed.The grain size distributions and properties of soil specimens are summarized in Fig. 3 and Table 2.The site soils were classified as A-4.From the standard compaction tests,the optimum water contents(wopt)and maximum dry densities (γdmax)were determined as 11%and 20 kN/m3,respectively.
3.2.Laboratory testing

Fig. 3.Range of grain size distributions of materials tested.

Table 2Engineering properties of resilient modulus test specimens.

Fig. 4.(a)Undisturbed resilient modulus specimen and(b)Resilient modulus test apparatus.
The resilient modulus tests were performed following the AASHTO T-307-99 protocol(AASHTO,1999)on twelve 15.24-cm(6-in)tall and 6.3-cm(2.5 in)in diameter,undisturbed specimens retrieved from Shelby tubes at their natural water content,as shown in Fig. 4a.The resilient modulus tests were performed at 15 stress combinations that included five deviatoric stress levels of 13.79 kPa,27.58 kPa,41.37 kPa,55.16 kPa and 68.95 kPa(2 psi,4 psi,6 psi,8 psi and 10 psi)at each of three applied confining pressures of 41.37 kPa,57.58 kPa and 13.79 kPa(6 psi,4 psi and 2 psi)at resilient modulus test apparatus(see Fig. 4b).
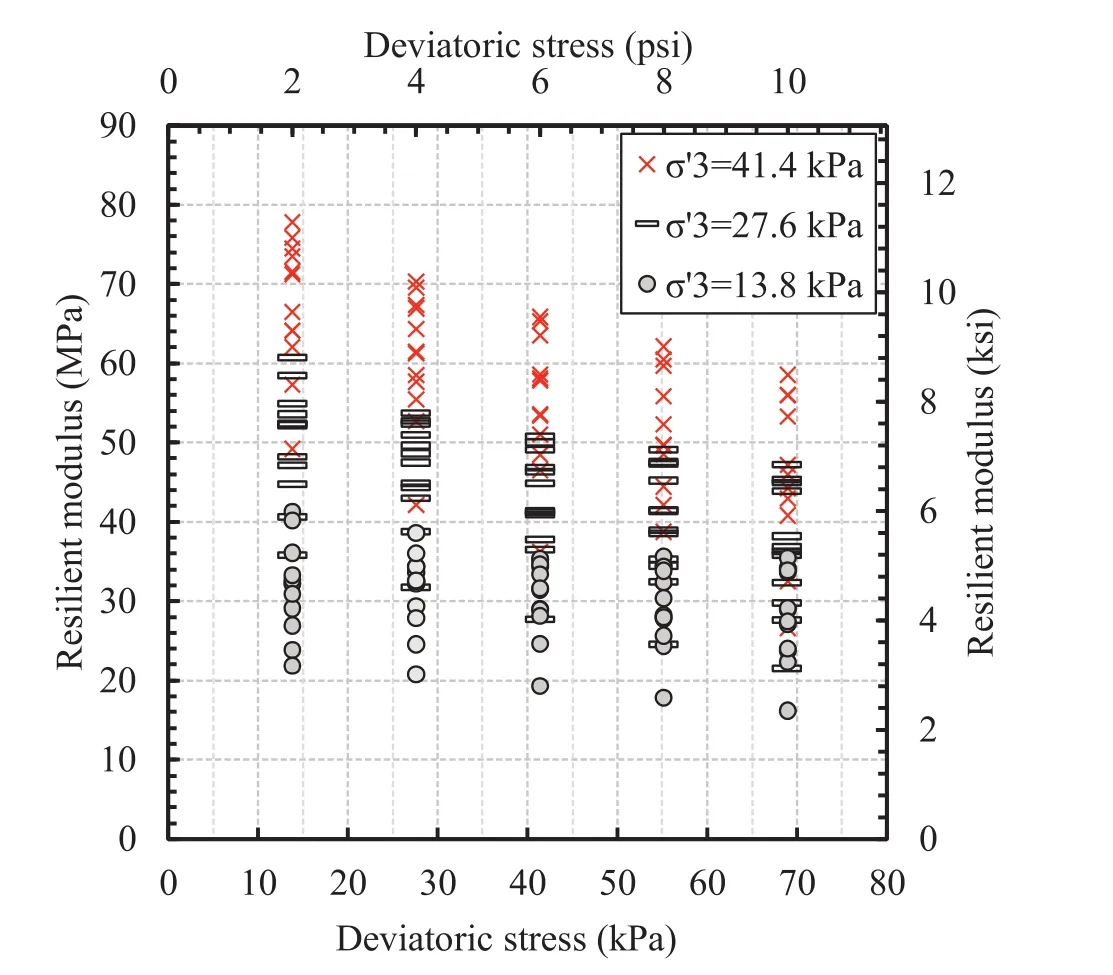
Fig. 5a and b shows the laboratory resilient modulus test results for two specimens H4-1 and H2-1,which are representation of the upper and lower ranges of the grain size distribution.As shown in Fig. 5,hardening and softening effects of confining pressure and deviatoric stress can be observed.Fig. 6 shows the range of the resilient modulus values at different deviatoric stress levels.From Figs.5 and 6,it can be seen that the hardening effect of the confining pressure on the resilient modulus is more pronounced at the smaller magnitude of the deviatoric stresses(e.g.deviatoric stresses:13.8 kPa).As shown in Fig. 6,the resilient modulus values can vary from 15 MPa to 80 MPa depending on the confining and deviatoric stress levels.
The laboratory-measured resilient modulus values were analyzed in the context of the NCHRP 1-28A(NCHRP,2003)constitutive model as described in Eq.(2).Fig. 7a and b shows the performance of Eq.(2)in back-calculating the laboratory-measuredMrusing curve-fittedk1,k2andk3for specimens H4-1 and H2-1.As shown in Fig. 7 and Table 3,the laboratory resilient modulus test results can befitted in MEPDG correlation with a coefficient of determination(R2)higher than 0.94.Thek1,k2andk3coefficients vary from 500 to 800,0.673 to 0.97,and 2.11 to 4.58,respectively,which are compatible with reported data by Yau and Von Quintus(2002),and Titi and English(2011)for A-4 soils.
Fig. 8 shows the laboratory measured resilient modulus at a confining pressure of 13.8 kPa(2 psi)and a deviatoric stress of 41.4 kPa(6 psi)for all specimens,versus their degree of saturation(S%).It can be seen that the resilient modulus generally decreases with an increase in the degree of saturation,which is consistent with the observation of Duong et al.(2016).In order to estimate the resilient modulus precisely,the effect of the degree of saturation needs to be taken into account.With the use of the DCP to estimateMr,this aspect of level of soil saturation is reflected in the in situ measured data,and consequently in the estimatedMrvalue.

Fig. 5.Laboratory resilient modulus test results.(a)Specimen H4-1 and(b)specimen H2-1.
3.3.In situ DCP testing
The DCP tests were performed at four locations on the centerline of each test section,as shown in Fig. 2.To establish the interfaces between the soil layers using the DCP data,ASTM D6951-09(2009)specif i es plotting the cumulative blow counts versus the penetration depth,and then defining the intersection at sharp changes in the direction of the cumulative blow counts versus penetration depth curve.After locating the interfaces of the layers,the weighted average DCPI value of each soil layer was calculated using Eq.(3).

wherezis the depth of penetration per blow(mm or in),His the total depth of the soil layer(mm or in)andNis the number of data points per layer.
The DCPI values,corresponding to the location of resilient modulus specimens and the MEPDG coefficients(k1,k2andk3)calculated from resilient modulus laboratory results are summarized in Table 3.

Fig. 6.Range of resilient modulus values.
4.Applicability of previous models
Empirical correlations for estimating the resilient modulus are grouped into two categories:(1)correlations which directly predict theMrfrom DCPI and(2)correlations that predict the resilient modulus indirectly from the universal constitutive model coefficients(k1,k2andk3),where these coefficients are estimated on the basis of basic physical properties of soils.
4.1.Empirical DCP models
In order to evaluate the ability of the existing models to predict theMrvalues measured in the current study,the models in Table 1 were used with the testing site measured DCPI data.The results are plotted in Fig. 9,and it shows that the existing models have generally over-predicted the laboratory-measured resilient modulus values,at a confining pressure of 13.79 kPa(2 psi)and a deviatoric stress of 41.37 kPa(6 psi),with the exception of the correlation from Mohammad et al.(2008),which consistently underestimated the resilient modulus.As mentioned previously,the variation in the degree of saturation of the tested specimens is reflected in the variability of the laboratory-measured resilient modulus,as shown in Fig. 8.Fig. 10 shows the performance of these empirical models in predicting the resilient modulus of the laboratory-measured resilient modulus data set presented by Cowell et al.(2012).No consistent trend is observed in performance of these models.A summary of the coefficient of determination(R2)and root mean squared error(RMSE)of the performance of the existing models in estimating the laboratory-measured resilient modulus values of both data sets is presented in Table 4.The inconsistency in predicting the measuredMrvalues might be attributed to the fact that these correlations are empirical in nature,and they are most applicable to soil types similar to those for which the models were developed.

Fig. 7.Laboratory-measured versus curve fitted Mrfrom MEPDG correlation.(a)Specimen H4-1 and(b)specimen H2-1.
4.2.Models that account for stress level
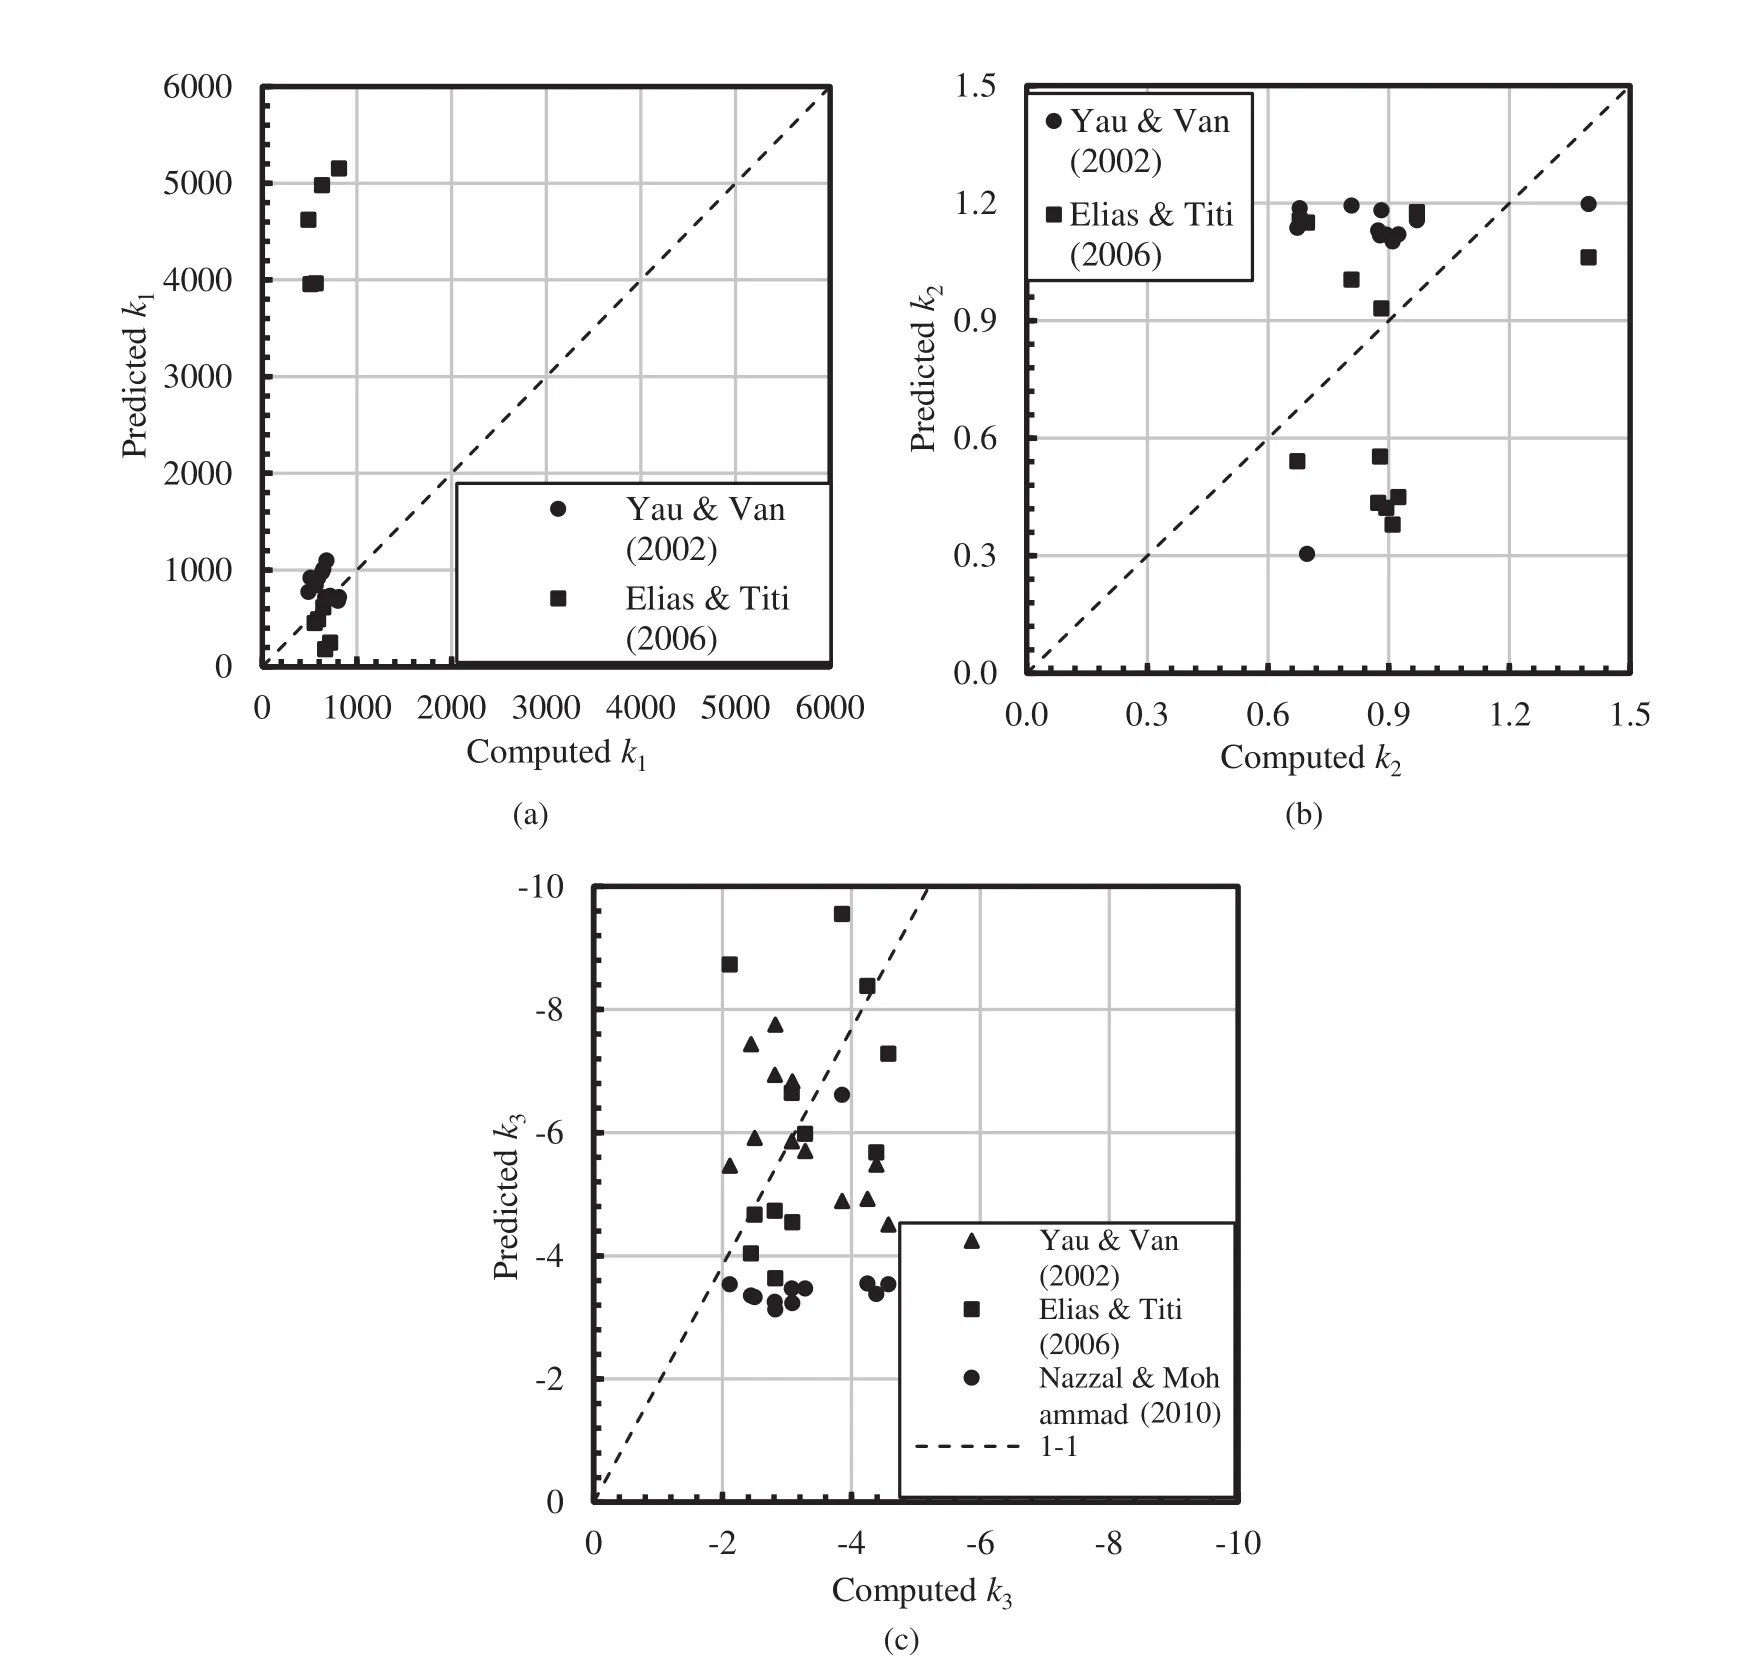
In order to develop a model to predictMrat any stress level,several studies have been undertaken to develop correlations that estimate the fitting coefficients(k1,k2andk3)of universalconstitutive model from basic physical properties of soils.Yau and Von Quintus(2002)and Elias and Titi(2006)proposed different correlations to predictk1,k2andk3to calculateMrfor cohesive and cohesionless subgrade soils.Nazzal and Mohammad(2010)proposed a correlation for predictingk1,k2andk3from index properties of A-4,A-6,A-7-5 and A-7-6 soils.These models are summarized in Table 5.Fig. 11a-c shows the generally unsatisfactory performance of these models in predicting the fitting coefficients.Negativek1andk2values were predicted from correlations of Nazzal and Mohammad(2010),which are not shown in Fig. 11a-b.The better performance of the other models can be explained by noting that these researchers proposed separate equations for high-plasticity soils and cohesionless soils,which resulted in different and more appropriateMrpredictions for a givenDCPIvalue.

Fig. 8.Laboratory-measured Mratσ3of 13.79 kPa(2 psi)and σdof 41.37 kPa(6 psi)versus degree of saturation(S%).

Fig. 9.Laboratory-measured Mr(this study)versus that predicted from the existing direct DCP models.

Fig. 10.Laboratory-measured Mr(Cowell et al.,2012)versus that predicted from the empirical DCP models.

Table 4Performance of the existing empirical DCP models.
The predictedMrvalues by Yau and Von Quintus(2002)and Elias and Titi(2006)models are presented in Fig. 12a and b.As shown in Fig. 12a,the resilient modulus values predicted by the equation from Elias and Titi(2006)are significantly greater than the laboratory-measuredMrvalues.Fig. 12b shows that the model from Yau and Von Quintus(2002)on average overestimated theMrvalues by 34%withR2=0.56.Due to the model from Nazzal and Mohammad(2010)predicting negativek1andk2values,the resilient modulus values were not able to be predicted.
5.Proposed DCP model and its validation
5.1.Proposed DCP correlation
Multilinear statistical analyses were performed to develop an approach to calculate the resilient modulus by predictingk1,k2andk3values from the in situ DCP test data.The multilinear regression analyses were performed on three quarters of the data set to develop a model that indirectly computes the resilient modulus at any desired stress state.For the practical purposes,the coefficients are directly correlated to the DCPI value.
The proposed model is presented in Eq.(4),with the model constants presented in Table 6.As shown in Fig. 13,the calculatedMrvalues by the proposed model and laboratory-measured resilient modulus are correlated withR2equal to 0.7.

5.2.Proposed model validation
The validity of the proposed model was examined using the quarter of the data set which was not used in the statistical analyses and was selected arbitrarily,as well as additional data from the literature.The performance of the proposed model in predicting the resilient modulus of the quarter of the data is shown in Fig. 14.The line of equality is added for clarity.It can be seen that the proposed model slightly underestimates the resilient modulus by 4%and the data are correlated withR2equal to 0.73.
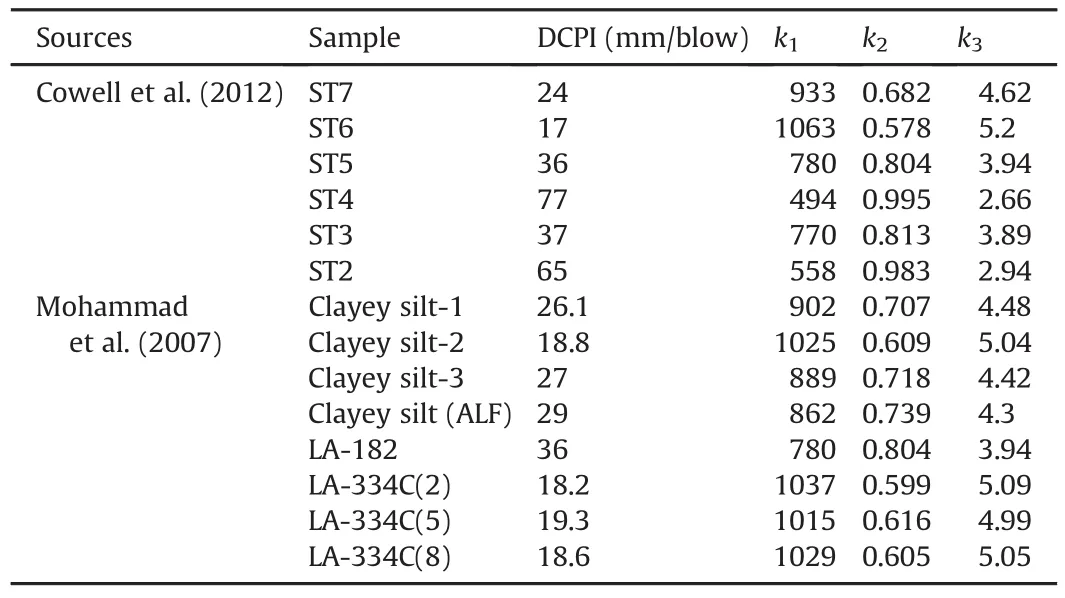
The data set from Cowell et al.(2012)was also used to test the proposed model.The subgrade soil for this project consisted of low-plasticity SM and SC(A-4).The data set by Cowell et al.(2012)includedMrvalues from tests on undisturbed specimens collected from the Coastal Plain of North Carolina,and in situ DCP measurements,summarized in Table 7.As shown in Fig. 15,the predictedMrvalues by the proposed model show reasonably good agreement with the laboratory-measuredMrvalues.
The performance of the proposed model was also investigated through the use of data presented by Mohammad et al.(2007,2008).The reported data included laboratory and field DCP measurements,summarized in Table 7,and laboratoryMrdata of the low-plasticity soil specimens tested at a confining pressure of 13.8 kPa(2 psi)and a deviatoric stress of 41.4 kPa(6 psi).

Table 5Published models for predicting k1,k2and k3from material properties.

Fig. 11.Computed versus predicted constitutive model coefficients by previous models:(a)k1,(b)k2and(c)k3.

Fig. 12.Laboratory-measured versus predicted Mrfrom equations of(a)Elias and Titi(2006)and(b)Yau and Von Quintus(2002).Here Mr-pindicates the predicated resilient modulus.

Table 6Model constants used in the text.

Fig. 13.Laboratory-measured versus calculated Mrby the proposed model.

Fig. 14.Laboratory-measured versus predicted Mrby the proposed model for the quarter of the data set.
The data plotted in Fig. 15 show that the proposed model underestimatesMrof this data set by 8%withR2of 0.53.By comparing the performance of the proposed model to that of existingMrpredicting correlations,presented in Table 4 and Fig. 12,it can be seen that the proposed model provides significantly improved predictive capability,with values slightly less than laboratory measured values and with higher coefficients of determination.

Table 7DCP data in the literature with corresponding predicted coefficients by proposed model.

Fig. 15.Laboratory-measured versus predicted Mrby the proposed model for data presented in the literature.
6.Conclusion
A laboratory testing program,including resilient modulus and index property tests,and in situ DCP tests were performed to establish a model for estimatingMrparameters.Comprehensive statistical analyses were conducted and a new model was proposed for calculatingMrof subgrade soil at any desired stress level.This model uses in situ DCP data indirectly,by predicting the fitting coefficients(k1,k2andk3)of the MEPDG recommended universal constitutive model.Based on the results presented in this paper,the following conclusions are drawn:
(1)Good agreement was obtained between the calculatedMrvalues from the proposed model and the laboratory measured resilient modulus data,with a coefficient of determination of 0.7.
(2)The evaluation of existing models which directly estimate theMrvalues of soils from the DCP measurements showed that they overestimated measuredMrvalues.In addition,the validity of these models only at one determined stress level limits their applicability to one particular pavement structure.
(3)The assessment of existing empirical models that predict the fitting coefficients of the universal constitutive model from basic physical properties of soils yielded poor predictions ofMrfor the soils tested in this study.
(4)The proposed model is capable of predicting the resilient modulus of low-plasticity Piedmont residual soils(A-4),with PI<5,and 40% <P200<55%,at any stress state.Further work will need to evaluate its applicability to other soils.
Conflicts of interest
The authors wish to confirm that there are no known Conflicts of interest associated with this publication and there has been no significant financial support for this work that could have influenced its outcome.
Abu-Farsakh MY,Alshibli K,Nazzal M,Seyman E.Assessment of in situ test technology for construction control of base courses and embankments.Report no.FHWA/LA 4.2004.
American Association of State Highway and Transportation Off i cials(AASHTO).Standard method of test for determining the resilient modulus of soils and aggregate materials.AASHTO T307-T399.Washington,DC:AASHTO;1999.
Asphalt Institute.The asphalt handbook.Manual Series No.4(MS-4).1989.p.435-7.
ASTM D1557-09.Standard test methods for laboratory compaction characteristics of soil using modified effort.Annual book of ASTM standards.West Conshohocken,PA:ASTM International;2009.
ASTM D2216-10.Standard test methods for laboratory determination of water(moisture)content of soil and rock by mass.Annual book of American Society for Testing Materials(ASTM)standards.West Conshohocken,PA:ASTM International;2010.
ASTM D422-63.Standard test method for particle-size analysis of soils.Annual book of ASTM standards.West Conshohocken,PA:ASTM International;2007.
ASTM D4318-10.Standard test methods for liquid limit,plastic limit,and plasticity index of soils.Annual book of ASTM standards.West Conshohocken,PA:ASTM International;2010.
ASTM D6913-09.Standard test methods for particle-size distribution(gradation)of soils using sieve analysis.Annual book of ASTM standards.West Conshohocken,PA:ASTM International;2009.
ASTM D6951-09.Standard test method for use of the dynamic cone penetrometer in shallow pavement applications.Annual book of ASTM standards.West Conshohocken,PA:ASTM International;2009.
ASTM D854-10.Standard test methods for specific gravity of soil solids by water pycnometer.Annual book of ASTM standards.West Conshohocken,PA:ASTM International;2010.
Ayres M.Development of a rational probabilistic approach for flexible pavement analysis(Ph.D.Thesis).College Park:University of Maryland;1997.
Borden RH,Shao L,Gupta A.Dynamic properties of piedmont residual soils.Journal of Geotechnical Engineering 1996;122(10).https://doi.org/10.1061/(ASCE)0733-9410(1996)122:10(813).
Carmichael RF,Stuart E.Predicting resilient modulus:a study to determine the mechanical properties of subgrade soils.Transportation Research Record:Journal of the Transportation Research Board 1985;1043:145-8.
Chai G,Roslie N.The structural response and behaviour prediction of subgrade soils using the falling weight def l ectometer in pavement construction.In:Proceedings of the third international conference on road and airfield pavement technology.Transport Research Centre(CDV);1998.p.1481-9.
Chen DH,Lin DF,Liau PH,Bilyeu J.A correlation between dynamic cone penetrometer values and pavement layer moduli.Geotechnical Testing Journal 2005;28(1):42-9.
Cowell TD,Pyo SC,Gabr MA,Borden RH.Field verification of undercut criteria and alternatives for subgrade stabilization-coastal plain.Report no.FHWA/NC/2008-13.Federal Highway Administration(FHWA),US Department of Transportation;2012.
Drumm EC,Boateng-Poku Y,Johnson Pierce T.Estimation of subgrade resilient modulus from standard tests.Journal of Geotechnical Engineering 1990;116(5):774-89.
Dunlap WA.A report on a mathematical model describing the deformation characteristics of granular materials.Technical report no.1,Project 2-8-62-27.Texas:Texas Transportation Institute,Texas A&M University College Station;1963.
Duong TV,Cui YJ,Tang AM,Dupla JC,Canou J,Calon N,Robinet A.Effects of water and fines contents on the resilient modulus of the interlayer soil of railway substructure.Acta Geotechnica 2016;11:51-9.
EliasMB,TitiHH.Evaluation of resilient modulus model parameters for mechanistic-empirical pavement design.Transportation Research Record:Journal of the Transportation Research Board 2006;1967:89-100.
Elliott RP,Thornton SI,Foo KY,Siew KW,Wood bridge R.Resilient properties of Arkansas subgrades.Reportno.FHWA/AR-89/004.Fayetteville:Arkansas Highway and Transportation Research Center,University of Arkansas;1988.
Farrar MJ,Turner JP.Resilient modulus of Wyoming subgrade soils.MPC report no.91-1.Fargo,ND:Mountain-Plains Consortium;1991.
Gabr MA,Hopkins K,Coonse J,Hearne T.DCP criteria for performance evaluation of pavement layers.Journal of Performance of Constructed Facilities 2000;14(4):141-8.
Gabr MA,Coonse J,Lambe PC.A potential model for compaction evaluation of piedmont soils using dynamic cone penetrometer(DCP).Geotechnical Testing Journal 2001;24(3):308-13.
George KP,Uddin W.Subgrade characterization for highway pavement design.Final report FHWA/MS-DOT-RD-00-131.Mississippi Department of Transportation;2000.
Hasan A.The effect of material parameters on dynamic cone penetrometer results for fine-grained soils and granular base materials[PhD Thesis].Oklahoma State University;1996.
Herath A,Mohammad LN,Gaspard K,Gudishala R,Abu-Farsakh MY.The use of dynamic cone penetrometer to predict resilient modulus of subgrade soils.Geofrontiers congress 2005 American Society of Civil Engineers 2005.https://doi.org/10.1061/40776(155)2.
Hudson JM,Drumm EC,Madgett M.Design handbook for the estimation of resilient response of fine-grained subgrades.In:Proceedings of the 4th international conference on the bearing capacity of roads and airfields.Minneapolis,MN:University of Minnesota;1994.p.917-31.
Mohammad LN,Gaspard K,Herath A,Nazzal M.Comparative evaluation of subgrade resilient modulus from non-destructive,in situ,and laboratory methods.No.FHWA/LA.06/417.2007.
Mohammad LN,Herath A,Gudishala R,Nazzal MD,Abu-Farsakh MY,Alshibli K.Development of models to estimate the subgrade and subbase layers’resilient modulus from in situ devices test results for construction control.Report no.FHW-LA-406.FHWA,US Department of Transportation;2008.
Mousavi SH,Gabr MA,Borden RH.Filed verification of undercut criteria and alternatives for subgrade stabilization in the Piedmont area of North Carolina.FHWA/NC/2011-05.2016.
National Cooperative Highway Research Program(NCHRP).Harmonized test methods for laboratory determination of resilient modulus for flexible pavement design.NCHRP 1-28A.Washington,DC:NCHRP;2003.
Nazzal MD,Mohammad LN.Estimation of resilient modulus of subgrade soils for design of pavement structures.J Mater Civil Eng 2010;22(7):726-34.
North Carolina Department of Transportation(NCDOT).Pavement condition survey manual.Raleigh,NC:NCDOT;1998.
NCHRP.Part 2,Design inputs.Guide for mechanistic-empirical design of new and rehabilitated pavement structures.NCHRP 1-37A,final report.2004.
Pezo RF.A general method of reporting resilient modulus tests of soils:a pavement engineer’s point of view.In:Proceedings of the 72nd annual meeting of the transportation research board.Washington,DC;1993.
Rahim AM,George KP.Subgrade soil index properties to estimate resilient modulus.Washington,DC:Transportation Research Board of the National Academies;2004.
Seed HB,Mitry FG,Monismith CL,Chan CK.Prediction of fl exible pavement deflections from laboratory repeated-load tests.NCHRP report 35.Washington,DC:Transportation Research Board;1967.
Titi HH,English R.Determination of resilient modulus values for typical plastic soils in Wisconsin.WHRP 11-04.2011.
Webster SL,Brown RW,Porter JR.Force projection site evaluation using the electric cone penetrometer(ECP)and the dynamic cone penetrometer(DCP).Report GL-94-17.US Waterways Experimental Station;1994.
Witczak MW,Uzan J.The universal airport pavement design system.Granular material characterization.College Park:University of Maryland;1988.
Yau A,Von Quintus H.Study of LTPP laboratory resilient modulus test data and response characteristics.Report no.FHWA-RD-02-051.Washington,DC:FHWA,US Department of Transportation;2002.
 Journal of Rock Mechanics and Geotechnical Engineering2018年2期
- Journal of Rock Mechanics and Geotechnical Engineering的其它文章
- Behavior of diatomaceous soil in lacustrine deposits of Bogotá,Colombia
- Assessment of natural frequency of installed offshore wind turbines using nonlinear finite element model considering soil-monopile interaction
- Behavior of ring footing resting on reinforced sand subjected to eccentric-inclined loading
- A new design equation for drained stability of conical slopes in cohesive-frictional soils
- Investigation of active vibration drilling using acoustic emission and cutting size analysis
- Numerical analysis of Shiobara hydro power cavern using practical equivalent approach
