Behavior of diatomaceous soil in lacustrine deposits of Bogotá,Colombia
Bernaro Caieo,Cristhian Menoza,Fernano López,Aresio Lizano
aDepartment of Civil and Environmental Engineering,Universidad de Los Andes,Bogotá,Colombia
bDepartment of Civil Engineering,Universidad Nacional de Colombia Sede Manizales,Manizales,Colombia
cEcole Centrale Paris,Laboratoire MSSMat-UMR CNRS 8579,Paris,France
dSRK Consulting,Vancouver,Canada
1.Introduction
The characteristics of soft soils are of critical importance in geotechnical engineering because the behavior of the soils affects the performance of engineering works constructed on these deposits.The soils basically have low bearing capacity,which can cause the geotechnical structures to be subjected to excessive settlements.The behavior of remolded soils has received a great deal of attention over the last 6 decades,for example,from Roscoe et al.(1958),Tavenas et al.(1979),Burland(1990),Biarez and Hicher(1994),and Horpibulsuk et al.(2011).Meanwhile,studies of natural clays by Leroueil and Vaugham(1990),Beaumelle(1991),and Tatsuoka et al.(2000)have received less attention.Even fewstudies are reported on the diatomaceous soils(very soft soils),which have been identified elsewhere in the world by Diaz-Rodriguez(2011)in Mexico City,Holler(1992)in the Sea of Japan,Chen et al.(1993)and Ladd et al.(1993)on the northeast coast of Australia,and McKillop et al.(1995)in the equatorial Pacific.As described by Diaz-Rodriguez(2011),the diatomaceous soils have extreme Atterberg limits(approximately 400%),water contents(approximately 300%),void ratios(approximately 8),coefficient of compressibility(approximately 5)and microfossils in the structure.The present study discusses the aforementioned issues that are undoubtedly of interest for practical design engineers or researchers in this area.
This paper presents a study on the geomechanical characteristics of a diatomaceous soil deposit,aiming at a better understanding of the behaviors of these soils when compared to the majority of soils found in the world.In most soils,the index properties are related to mechanical behavior.However,in a diatomaceous soil deposit,these correlations cannot work,or should be modified.Additionally,some explanations are given for the special behaviors of these types of soils.The soil used in the present work is from the lacustrine deposit of Bogotá(Colombia).The field work consisted of taking high-quality samples from 2400 m of boreholes using the stationary piston technique.Some of these boreholes reached 250 m deep.The laboratory component of this study includes:(i)physical tests such as grain size distribution,Atterberg limits,density of solid particles,and organic matter content;and(ii)mechanical tests such as oedometric compression tests,unconfined compression tests,and triaxial tests.Laboratory tests were complemented with scanning electron microscope(SEM)observations to evaluate the microstructure of the soil.This is a contribution to the knowledge of the diatomaceous soils,because the previous studies on diatomaceous soils have been performed over reconstructed or shallow samples.
The lacustrine deposit of the city of Bogotá(Colombia)is located on a high plateau of the Andes Mountains at 2550 m above sea level.More than 60%of the area of this city with 9 million of inhabitants is located on soft soil deposits.At some sites of the plateau,the depth of the lacustrine deposit can reach 586 m(Torres et al.,2005).Shallow deposits of soil from 5 m to 10 m deep are over consolidated,but in deeper layers,the soil can reach extreme values for some geotechnical properties:consistency indices lower than 0.5,water contents higher than 200%,liquid limits up to 400%,void ratios as high as 5,and high diatomaceous percentage.
The results of the lacustrine deposits of Bogotá showed a high friction angle(close to 45°)and a high plastic index(close to 200).These results are not common in the classic mechanics of soil because the increase of the plastic index causes a decrease of the friction angle(Mitchell,1993).A possible explanation is that the soil had a high content of diatoms in its structure,and these diatoms changed its behavior(Santamarina and Diaz-Rodriguez,2003;Diaz-Rodriguez,2011).Another interesting result was that an increase in diatoms(particles larger than 10μm)increases the plasticity of soil without increasing clay-sized particles.This characteristic creates a disagreement between the classification system based on Atterberg limits and the classification system based on grain size.Moreover,some correlations are presented in this work,including those between the Atterberg limits and the undrained shear strength,the friction angle and the liquid limit,the void ratio at 100 kPa and the liquid limit,and the plasticity index and the diatomaceous content.In addition,several practical correlations were tested and applied to this type of soil as found by Vardanega and Bolton(2011)for shear strength mobilization,and the intrinsic compression line proposed by Burland(1990),among others.The results showed several different features of the diatomaceous soils,which are not typical in the majority of soils in the world.
2.Geological framework
The high plain of Bogotá is located at 4°N and 74°W(geographical coordinates)at an altitude of 2550 m.Its origin lies in a Plio-Pleistocene lake that was filled with water over time.The deep deposit of soils is explained by the subsidence of the bottom of the basin and the gradual accumulation of main lacustrine sediments during the last 3 million years(Hooghiemstra and Sarmiento,1991).The chronostratigraphy of the deposit was studied by Andriessen et al.(1993)using the f i ssion track-dated method.They estimated the soil’s age at 3.2 million years at a depth of 586 m.In addition,chronostratigraphical data were obtained by Torres et al.(2005)based on pollen analysis.Fig. 1 depicts some of the deposition processes that have taken place in the basin of Bogotá.As shown in Fig. 1a-d,the main deposition mechanism was controlled by the level of the water table,which was in turn dependent on the differential rate between the subsidence of the bottom of the deposit and sedimentation.Possible deposition mechanisms were:(i)sedimentation of predominant fine-grained materials in a low energy regime taking place under deep water(Fig. 1a);(ii)sedimentation of predominant silt and sand in a high energy regime occurring in low water tables near river mouths(Fig. 1b);and(iii)swamp and fl uvio-lacustrine deposits with high proportions of organic matter in shallow water tables(Fig. 1c).
Chronostratigraphical and geological studies by Torres et al.(2005)at the deepest site of the deposit,located in the city of Funza near Bogotá,proposed the following stratigraphy of the deepest deposits:
(1)The bottom of the deposit was found at 586 m deep.From 568 m to 586 m,there is a mix of clay and sand deposited in a fluvio-lacustrine environment.Then,the water table rises throughout history and lacustrine deposits become dominant in the interval from 530 m to 568 m.
(2)From 460 m to 530 m,there are deposits with high contents of organic matter,which suggests lacustrine and swamp deposits.Sandy deposits resulting from a high energy fl uvial environment appear at the Funza site from 445 m to 460 m.
(3)From 325 m to 445 m,once again there are deep lacustrine and swamp deposits overlying the fl uvial deposit.
(4)From 250 m to 325 m,subsidence predominates.This creates a deep basin with a true lacustrine deposit.
The geotechnical study of the basin presented in this research concerns the upper 250 m of the deposit,corresponding chronologically to the last 1 million years(Fig. 1h).Fig. 1e-g presents the mean values of organic matter loss on ignition(LOI),liquid limit,and percentage of grains with sizes less than 2μm calculated from the whole geotechnical investigation described in Section 3.These results complement the stratigraphy proposed in Torres et al.(2005)with the following geotechnical data:
(1)From 180 m to 250 m,the lacustrine deposit properly continues with soils having less than 10%of organic matter and liquid limit of around 50%.
(2)From 155 m to 170 m,there is a swamp deposit with a large proportion of organic matter and a mean liquid limit approaching 100%.
(3)From 155 m to 80 m,the lacustrine deposit dominates again.
(4)From 5 m to 80 m,which corresponds to the last 250,000 years,there are some sporadic episodes of swamp deposits with high proportions of organic matter.This corresponds to alternating rises and falls of the water table.At the same time,the mean value of the liquid limit increases from 50%to 200%.In this deposit,the mean percentage of particles with sizes less than 2μm fluctuates from 0%to 20%.From 50 m deep to the surface,the chronological measures carried out by Torres et al.(2005)(Fig. 1h)show a deposition rate of 3440 yr/m.
(5)In the first 5 m of the deposit,the amount of organic matter and the liquid limit decrease,while the content of particles with size smaller than 2μm increases.
SEM images were taken from a sample at 16 m depth in the lacustrine zone.Fig. 2a shows an open structure similar to that observed by Sides and Barden(1971).This open structure could be the result of a lacustrine deposit from calm(low energy)lake water as described above.Moreover,in the case of Bogotá soil,there are fossils in these deposits,as shown in Fig. 2b and c.A detailed examination of the previous images reveals the high content of frustules from diatoms(Fig. 2d-f).As described by Diaz-Rodriguez(2011),sedimentary diatomaceous soils have silica contents of 90%and only 10%of iron and aluminum oxides.With their low unit weights and large specific surface areas,the presence of diatoms gives special mechanical and hydraulic characteristicsto these soils.

Fig. 1.Deposition of lacustrine soils in the Paleolithic lake at the location of Bogotá(Colombia):(a)low energy sedimentation in a proper lacustrine deposit,(b)high energy fluvial deposit,(c)swamp deposit,(d)schematic drawing of deposition mechanisms,(e)mean value of the organic matter content,(f)mean value of the liquid limit,(g)mean content of particles with size less than 2μm,and(h)chronostratigraphy from Torres et al.(2005).
The mineralogical composition of Bogotá soil includes as much as 50%quartz,15%-42%feldspars,15%-30%clay,and predominant smectite.Other minerals such as mica and vermiculite appear in less proportion.
3.Field exploration and geotechnical framework
3.1.Field exploration and testing program
Atotal of 52 boreholes with a total length of 2400 mweredrilled for this study.Six boreholes reached depths greater than 100 m,and two reached depths of 240 m(Fig. 3).The sampling protocol depended on the depth at which samples were taken.Samples were taken every 2 m for the first 20 m,and every 5 m from 20 m to 50 m.Below 50 m,samples were taken every 8 m.
A stationary piston sampler was used to obtain high-quality samples.Original samples were 75 mm in diameter but were trimmed to 50 mm for triaxial and oedometric compression tests to avoid any alteration due to internal friction within the sampler.
The testing program in this study consisted of 1024 tests for Atterberg limits and water content by the standard ASTM D4318-17(2017),113 tests for organic matter content using the ignition method by the standard ASTM F1647-11(2011),113 tests for specific density of soil particles by the standard ASTM D854-14(2014),654 tests for unit weight by the standard ASTM D7263-09(2009),and 76 tests for grain size by the standard ASTM D7928-17(2017).In addition,448 unconfined compression tests by the standard ASTM D2166/D2166M-16(2016),82 oedometric compression tests by the standard ASTM D2435/D2435M-11(2011),and 101 triaxial tests by the standard ASTM D4767-11(2011)were also conducted for mechanical characterization.
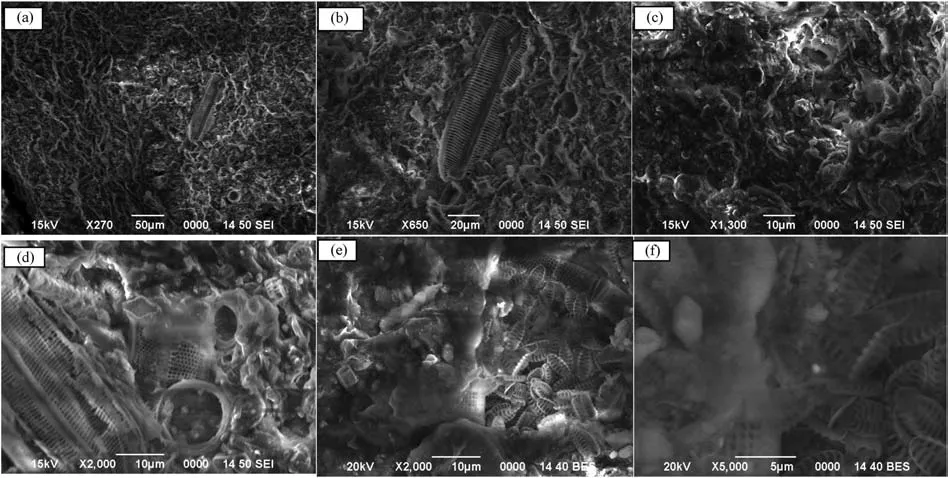
Fig. 2.SEM images of a soil sample from Bogotá taken at a depth of 16 m in the lacustrine deposit.

Fig. 3.Locations of the deepest boreholes.
3.2.Geotechnical framework
Fig. 4 presents the Atterberg limits and water content measurements from the deepest boreholes.Water contents are persistently above 100%from 5 m to 50 m deep.In addition,the Atterberg limits in this zone exhibit high variability due to the extremely slow pace of deposition of lacustrine deposits of 1 m every 3440 years,as shown in Fig. 1h.Below 50 m,the At terberg limits decrease,leading to a plasticity index below 30%at lower depths.However,thin layers with very high liquid limits which can reach 400%can appear at any depth.These layers may be associated with shallow lacustrine deposits in which diatoms are present.In fact,as the following section shows,high plasticity indexes are associated with low clay contents and with the presence of a large numbers of diatoms.
Fig. 5 shows additional basic geomechanical properties measured from 7 deepest boreholes,including organic matter content(measured by the LOI),the proportion of grains with sizes smaller than 2μm,the unit weight,and the undrained shear strength calculated from the results of unconfined compression tests(qu/2),wherequis the unconfined compressive strength(UCS).
The LOI results presented in Fig. 5a show peat deposits at depths of approximately30 m,60 m and 160 m.These peat deposits appear unambiguously for boreholes B2,B3,B6 and B7 that correspond to the limit of the ancient lake,as shown in the topographic scheme presented in Fig. 3.These peat deposits may correspond to the deposition scheme presented in Fig. 1a.
Besides the peat deposits,Fig. 5a shows the average organic matter content ranging from 6%to 10%for the first 5 m below the surface.It then increases to around 25%at 30 m deep.Afterwards,the organic matter content decreases gradually to below 10%at 70 m deep.The organic matter content in the deepest layers of the deposit is between 2%and 8%.
The proportion of clay(Fig. 5b),measured as the fraction of particles with sizes less than 2μm,can reach 50%in the first 20 m below the surface.It then decreases to about 10%although in some cases it is less than 5%.It is important to note that the lowest percentages of clay shown in Fig. 5b occur at depths where the liquid limit is very high,as shown in Fig. 4.This suggests that the high liquid limits are not related to the percentage of clay in the soil,but they may depend on the proportion of diatoms as presented in the analysis in the next section.
Fig. 5c presents the unit weight of the soil.It suggests the presence of an over consolidated crust in the first layer between 5 m and 10 m below the surface.This crust may have formed because of desiccation of more recently deposited soils combined with the lowering of the water table due to anthropic activities.In the zone of high liquid limits,the soil presents low unit weights that range from 11 kN/m3to 15 kN/m3.These low unit weights indicate normally consolidated soils.Despite the highly dispersed results,it is possible to observe an approximately linear increase in unit weight between depths of 10 m and 70 m,which is the characteristic of normally consolidated deposits.

Fig. 4.Atterberg limits and water content throughout the seven deepest boreholes.wLis the liquid limit,wPis the plasticity limit,and w is the water content.
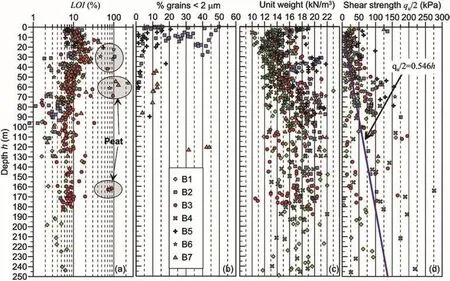
Fig. 5.(a)Loss on ignition,(b)proportion of particles with sizes less than 2μm,(c)unit weight,and(d)undrained shear strength of the soils at boreholes B1-B7.
Fig. 5d presents the measurements of undrained shear strength calculated as half of the UCS.The undrained shears trength is low for the first 50 m of the deposit.In this depth range,the characteristic mean value is 25 kPa.Nevertheless,there are high measurements of undrained shear strength in places within the over consolidated crust.Deeper layers of the deposit present highly dispersed shear strength measurements with some values as high as 200 kPa.Additionally,a linear trendline was added to show the increase of undrained shear strength with depth at borehole B1.Borehole B1 was selected because:(1)other boreholes were less deep;and(2)the dispersion increases with depth in the deepest boreholes.
4.Relationships between basic characteristics
4.1.Grain size,plasticity index and loss on ignition
The activity(A)of Bogotá soil is presented in Fig. 6 for the depth ranges observed in Fig. 4.To highlight the differences between common fine-grained soils and Bogotá soil,Fig. 6 includes the activity ranges of the most common clayey soils as suggested by Holtz et al.(2011).The shallowest deposits(<7.5 m depth)in which the Bogotá soil has lower liquid limits are compared with the thick intermediate deposits between depths of7.5m and 70m.Within these deposits,the liquid limit reaches 400%at some locations.At lower depths between 70 m and 125 m,the liquid limit decreases again.
As observed in Fig. 6,most soils from shallow to deep deposits have activity values that match with the range of kaolinite,illite and smectites,which are common clays.However,in the thick intermediate deposit,a significant number of tests show soils that have high plasticity indices and low clay contents lead to very high activity values.These high activity values can be explained by the presence of diatoms as reported by Diaz-Rodriguez(2003)for the clays of Mexico City.
Fig. 7 shows the relationship between the activityAand the LOI related to the organic matter content within the soil.It can be seen that as the LOI increases,the activity also tends to increase.Eq.(1)is proposed to represent the relationship between the activity and the LOI obtained in this study.The outliers were excluded to obtain this equation.Figs.6 and 7 show that the LOI could be an indirect indicator of the diatom contents of the Bogotá clays.The reason is that high activity values are related to the presence of diatoms,and high activity values in these soils indicate high LOI test results.

4.2.Plasticity index and liquid limit
In geotechnical engineering,it is well-known that soils of the

Fig. 6.Activity plot of clay content(grains with sizes smaller than 2μm)and plasticity index for the Bogotá clays.
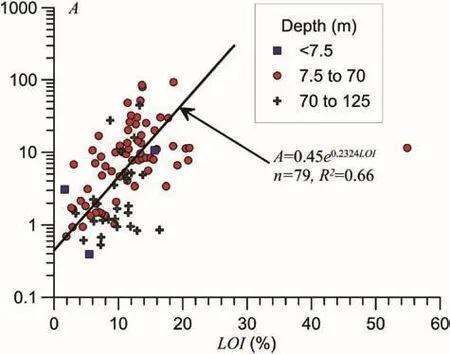
Fig. 7.Relationship between activity and loss of ignition for Bogotá clays.

Fig. 8.Plasticity index and liquid limit of the Bogotá clays represented in the Casagrande plasticity chart.
same origin tend to be located among a well-defined band in the Casagrande plot,leading to a relationship between the plasticity index and liquid limit.This empirical statement is also valid for the Bogotá clays,as shown in Fig. 8,which plots 1024 pairs of liquid limit and plasticity index results for the Bogotá clays.The following linear equation is proposed to represent the relationship between the plasticity index and the liquid limit:

It is important to note that the results presented in Fig. 8 indicate a clear predominance of clays,even though Fig. 6 shows that the clay content as defined by the size of the particles is less than 50% for most of the Bogotá soil.These results represent a disagreement between the unified soil classification system(USCS)based on the plasticity chart and the soil classification based on particle size.It is probably related to the high diatom content of Bogotá soil.On the other hand,the Casagrande plasticity chart is not necessarily the best methodology to differentiate types of fine soils,because this chart is a function of the liquid limit and the plasticity index.These variables are strongly correlated,because the plastic index is the difference between the liquid limit and the plastic limit(this was shown in Fig. 8,where a linear relation was obtained with a high coefficient of correlation,R2=0.97).More information on this regard can be found in Polidori(2004).An additional explanation for soils with high plasticity is that the liquid limit dominates the behavior of the plasticity index(Seed et al.,1964;Jang and Santamarina,2016),as shown in Fig. 8.This is due to the small variation of the plastic limit,which is almost constant with respect to the liquid limit(see Fig. 4).
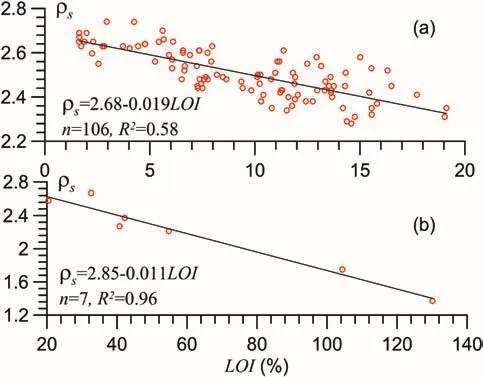
Fig. 9.Relationships between density of soil particles,ρs,and loss on ignition.
4.3.Density of soil particles and loss on ignition
Fig. 9 presents the relations between the density of soil particles,ρs,and the LOI.From this figure,it is clear that the density of soil particles decreases as the organic matter content,represented by the LOI,increases.
The results presented in Fig. 9 were adjusted using a linear relationship between the density of soil particles and the LOI.A linear relationship is reasonable because the density of particles in a mixture of two materials is the result of the density of each component and the proportion of each material in the mixture.As shown in Fig. 9a and b,two linear relationships are feasible in the case of Bogotá soil depending on the LOI.However,these two relationships have a discontinuity forLOI=20%,suggesting that this value separates soils with two different origins:organic soils forLOI< 20%and soils approaching peat forLOI> 20%.
5.Compressibility of the lacustrine deposit with diatomaceous soil
Classical oedometric compression tests were carried out to characterize soil compressibility.Fig. 10 presents the results of 82 oedometric compression tests performed following ASTM D2435/D2435M-11(2011).
There are two ways to analyze the compressibility curves.One is to examine their slopes in both the normally consolidated state and over consolidated state.The other way is to look at their position in thee-σ′vplot.Regarding the slope in the normally consolidated domain,Skemtpon and Jones(1944)proposed a relationship between the coefficient of compressibilityCcand the liquid limitwL.On the other hand,in the over consolidated domain,the recompression coefficientCsis usually related to the coefficient of compressibilityCc.Eqs.(3)and(4)are proposed for the Bogotá soil,and Fig. 11 shows the good agreement of the proposed equations with the measured results.

Biarez and Favre(1975)and Burl and(1990)proposed models to predict the position of the compression curve based on Atterberg limits.For this purpose,the Biarez and Favre model used the liquidity indexIL,although the Burland model introduced a parameterIv,which is a normalized void index based on two characteristic void ratios(e*100ande*1000)corresponding to the void ratios on the oedometric curve at two stresses(σ′v=100 kPa and 1000 kPa),respectively.These models were developed for reconstituted normally consolidated clays submitted to oedometric loading.However,Honget al.(2012)demonstrated that the Burland modelcanbe used for natural soils.Int his case,the normalized void index becomes

Fig. 10.Results of 82 oedometric compression tests carried out on the Bogotá soil.

Fig. 11.(a)Relationship between the compressibility coefficient and the liquid limit,and(b)relationship between the compressibility and recompression coefficients for Bogotá soil.
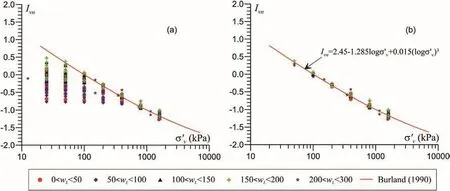
Fig. 12.Normalized compressibility curves:(a)complete compression results,and(b)post-yield results.

whereeis the void ratio,ande100is the void ratio for σ′v=100kPa.
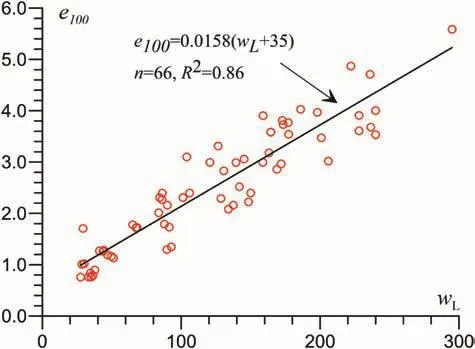
Fig. 13.Relationship between the void ratio at 100 kPa and the liquid limit.
Fig. 12a shows the results of the oedometric compression tests and the intrinsic compression line proposed by Burland(1990).Fig. 12b presents a good agreement of the calculations by the following equation with the results of the void ratio in the normal consolidated range:

Fig. 13 shows a good agreement of the linear relationship presented in Eq.(7)that relates the void ratioe100with the liquid limit.Using Eqs.(6)and(7),it is possible to obtain the normal consolidation line if the liquid limit of the soil is known.

6.Shear strength of lacustrine deposit with diatomaceous soil
6.1.Undrained shear strength
As mentioned in Vardanega and Bolton(2011),the undrained shear strength can be analyzed from two perspectives:(i)empirical correlations,which are useful for practical estimations of shear strengths,and(ii)relationships coming from critical state soil mechanics,which allow the calculation of undrained shear strength but require information about the over consolidated ratio(OCR).Although the second approach is more rigorous theoretically,the information needed about the OCR is not always available.

Fig. 14.(a)Relationship between the liquidity index and the undrained shear strength;and(b)Relationship between the liquidity index and the logarithm of undrained shear strength for Bogotá soil.
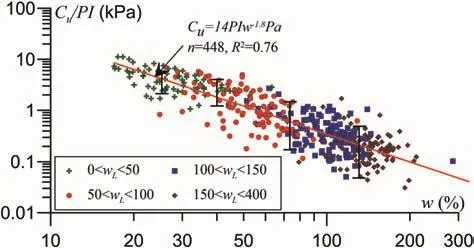
Fig. 15.Relationship between the plasticity index,undrained shear strength and water content.
Most of the empirical relationships are based on the intrinsic properties of the soil given by the Atterberg limits and a parameter relating the state of the soil such as the water content or the void ratio,such as the relationships proposed by Leroueil et al.(1983),Wood(1986,1990),Koumoto and Houlsby(2001),and Vardanega and Haigh(2014).The relationship between strength and liquidity index(IL)proposed by Wood(1990)and Vardanega and Haigh(2014)is used in the present work,which is shown as follows:

where the factorRMWis a function of clay mineralogy,andcLis the strength of the soil at liquid limit.Vardanega and Haigh(2014)assumedRMWequal to 35 andcLequal to 1.7 kPa.In addition,Wood(1990)assumedRMWequal to 100 for montmorillonitic soil and 30 for kaolinitic soil andcLclose to 1.7 kPa.Fig. 14 shows the comparison between the calculated(Eq.(8))and experimental data(n=418).Additionally,Fig. 14b plots the liquidity index against the logarithm of undrained shear strength obtained from experimental data to better represent the correlation(Vardanega and Haigh,2014).These figures show that fitting the experimental results with the proposed relationships produces considerable scatter and a very low coefficient of correlation(R2less than 0.3).Additionally,for the adjustment of the equation proposed by Vardanega and Haigh(2014),cLwas equal to 7 kPa,in contrast to the value of 1.5 kPa proposed initially.Wood(1990)obtained values ofRMWequal to 160 andcLequal to 3 kPa.In the above-mentioned studies,the factors of equation were very high in comparison to the experimental data originally used to obtain Eq.(8).
However,in the case of Bogotá soil,fitting the experimental results using the proposed equations causes considerable scatter.For this reason,a new relationship is proposed,based on which the results of 448 unconfined compression tests are fitted using the plasticity index as the intrinsic parameter and the water content as the state parameter.This relationship leads to a better fit than those mentioned above,which can be expressed as follows and is shown in Fig. 15:

wherePais the atmospheric pressure.

Fig. 16.Results of a triaxial test performed on highly plastic soil.

Fig. 17.Friction angle at the critical state for different liquid limits.

Fig. 18.Friction angle against plastic index for soft soils with high friction angle(adapted from Santamarina and Diaz-Rodriguez,2003).
6.2.Effective shear strength
The shear strength of Bogotá soil was studied using undrained triaxial tests with pore pressure measurements.Fig. 16 shows the results of a triaxial test.This particular test,carried out on a soil having a liquid limit of 186%,leads to a friction angle of 35°.This result is in disagreement with that in the classical literature in soil mechanics that suggests lower friction angles for soils having high levels of plasticity(Lambe and Whitman,1979;Whitlow,1990).
In this study,101 triaxial compression tests covering a broad range of liquid limits were performed,and an attempt to define the relationship between friction angles and liquid limits was made.Fig. 17 shows that a linear relationship could describe the effect of the liquid limit and friction angle,as shown in Eq.(10).It is important tonote that the friction angle increases as the liquid limit grows and can reach values as high as 47°.The high friction angle can be explained by the presence of diatoms,as reported by Diaz-Rodriguez etal.(1992),Shiwakoti et al.(2002)and Diaz-Rodriguez(2011).On the other hand,the liquid limit of the Bogotá soil increases as the diatom content increases,as suggested in Fig. 6.These results could explain the increase in the friction angle as the liquid limit increases.

Fig. 18 presents a comparison of experimental data obtained in this study and the experimental results obtained by Tanaka et al.(2001)for Ariake and Bangkok clays,Camp et al.(2002)for marine clay,Moya and Rodriguez(1987)for Bogotá soil,and Diaz-Rodriguez et al.(1992)for Mexico City soils.The special characteristics of these soils were high fraction of fine soil and high friction angle.Additionally,this figure shows an increase of the friction angle with the plastic limit for soils with high content of diatoms(Bogotá and Mexico City soils).
6.3.Shear strength mobilization
Stress-strain relationships during undrained loading are useful for engineering practice.For this purpose,Vardanega and Bolton(2011)proposed a model for predicting the mobilized shear stress on the basis of the shear strain of saturated soils subjected to undrained compression.The mobilized shear stressτmoband the shear strainγare given by the following equations:


Fig. 19.Normalized shear stress and shear strain based on the results of undrained triaxial tests.

Fig. 20.(a)Example of experimental results ofγM=2;and(b)and(c)show the adjustment of experimental results to a logarithm normal probability distribution function.

The relationship between the mobilized shear stress and the undrained shear strengthcuwas defined in BS8002:1994(1994)as the mobilization factorM,which can be associated with a safety factor:

Power relationships have been proposed to relate the mobilized shear stress with shear strain.To better fit stress-strain curves,Vardanega and Bolton(2011)proposed to normalize the shear strain by the shear strain when the mobilization factor is 2,i.e.γM=2.Fig. 19a presents the normalized stress-strain curves obtained from 101 triaxial compression tests.Additionally,this figure compares the results with the database used by Vardanega and Bolton(2011).Experimental data are restricted to the ratio of the mobilized shear stress to the undrained shear strength in the range of 0.2-0.8(0.2< τmob/cu< 0.8).This limitation is in agreement with the suggestion of Jardine(1992),where 0.2 is the limit of the zone of linear elastic response,and the other limit,0.8,is close to their recoverable plastic zone and is defined as a local boundary surface.
In general,these limits are approximate to represent the changes of shear behavior of soil.Vardanega and Bolton(2011)took these limits as approximations because the specific locations are a function of the soil properties,and are stress-history dependent.Fig. 19b is plotted on a bilogarithmic scale to obtain the power relationship between normalized stresses and strains from which the following equation results:

A complete description of the stress-strain relationship requires knowledge of the strain value(γM=2)when the mobilization factor isM=2.Vardanega and Bolton(2011)proposed the calculation ofγM=2based on the plasticity index,the undrained shear strength,and the mean effective stressp′0,but this particular relationship presents a significant scatter for the results of Bogotá soil.As shown in Fig. 20a,for Bogotá soil,the value ofγM=2f l uctuates around a constant value.For this reason,the present study attempts to find a probability distribution function ofγM=2covering the results of all plasticity indices and shear strengths.Fig. 20b presents the experimental values ofγM=2in a histogram,and Fig. 20c presents the cumulative values.These sub-figures also present the density probability function and the cumulative probability of a logarithm normal function that adjusts the experimental results.This adjustment leads to the mean value ofμγM=2=1.16%and the standard deviation ofσγM=2=0.52%.
7.Conclusions
This paper presents a study on diatomaceous Bogotá soil.The results confirm several features that have been found in complex and engineering ‘difficult’diatomaceous soils elsewhere in the world.The main features of Bogotá soil found in this study are:
(1)As a result of lacustrine deposits,the Bogotá soil contains diatoms which increase the plasticity of the soil without clay-sized particles.This characteristic suggests a disagreement between the classification system based on Atterberg limits and the classification system based on grain size.
(2)For the Bogotá soil,the presence of high percentage diatoms could be associated with very high values of the activity index.In addition,the high activity values are related to high soil percentages of organic matter and low densities of soil particles.
(3)Regarding compressibility,the Bogotá soil presents high void ratios and high compressibility that are well related to the liquid limits.In addition,the intrinsic compression line proposed by Burland(1990)describes the normal consolidated behavior of this soil with high accuracy.
(4)Concerning the strength,we propose a relationship for the undrained shear strength based on the plasticity index as the intrinsic parameter and water content as the state parameter.On the other hand,the friction angle presents high values for high liquid limits which is probably the result of large content of diatoms.The relationship between the friction angle and the liquid limit can be described by a linear function.
(5)The stress-strain curve is described in two domains of strains:intermediate strains for 0.2<τmob/cu< 0.8 and small strains.The proposal of Vardanega and Bolton(2011)was used for the range of intermediate strains.Although this approach leads to a function related to the normalized mobilized shear strain and shear strain,for the Bogotá soil,the value of the shear strain tends to be constant when the mobilization factor is 2.
Conflict of interest
The authors wish to confirm that there are no known Conflicts of interest associated with this publication and there has been no significant financial support for this work that could have influenced its outcome.
Andriessen PMA,Helmens K,Hooghiemstra H,Riezebos PA,Van der Hammen T.Absolute chronology of the Pliocene-Quaternary sediment sequence of the Bogotá area,Colombia.Quaternary Science Reviews 1993;12(7):483-501.
ASTM D854-14.Standard test methods for speci fi c gravity of soil solids by water pycnometer.West Conshohocken,USA:ASTM International;2014.www.astm.org.
ASTM D2166/D2166M-16.Standard test method for uncon fined compressive strength of cohesive soil.West Conshohocken,USA:ASTM International;2016.www.astm.org.
ASTM D2435/D2435M-11.Standard test methods for one-dimensional consolidation properties of soils using incremental loading.West Conshohocken,USA:ASTM International;2011.www.astm.org.
ASTM D4318-17.Standard test methods for liquid limit,plastic limit,and plasticity index of soils.West Conshohocken,USA:ASTM International;2017.www.astm.org.
ASTM D4767-11.Standard test method for consolidated undrained triaxial compression test for cohesive soils.West Conshohocken,USA:ASTM International;2011.www.astm.org.
ASTM D7263-09.Standard test methods for laboratory determination of density(unit weight)of soil specimens.West Conshohocken,USA:ASTM International;2009.www.astm.org.
ASTM D7928-17.Standard test method for particle-size distribution(gradation)of fine-grained soils using the sedimentation(hydrometer)analysis.West Conshohocken,USA:ASTM International;2017.www.astm.org.
ASTM F1647-11.Standard test methods for organic matter content of athletic field rootzone mixes.West Conshohocken,USA:ASTM International;2011.www.astm.org.
Beaumelle ACLA.Evaluation of SHANSEP strength-deformation properties of undisturbed Boston blue clay from automated triaxial testing.MSc Thesis.Cambridge,USA:Massachusetts Institute of Technology;1991.
Biarez J,Favre JL.Parameters f i ling and statistical analysis of data in soils mechanics.In:Proceedings of the 2nd International Conference on Application of Statistics and Probabilities in Soil Mechanics,vol.2;1975.p.249-64.Aachen.
Biarez J,Hicher PY.Elementary mechanics of soil behaviour:saturated remoulded soils.A.A.Balkema;1994.
BS8002:1994.Code of practice for earth retaining structures.London:British Standards Institution(BSI);1994.
Burland JB.On the compressibility and shear strength of natural clays.Geotechnique 1990;40(3):329-78.
Camp WM,Mayne PW,Brown DA.Drilled shaft axial design values:predicted versus measured response in a calcareous clay.In:Deep Foundations 2002,vol.2.American Society of Civil Engineers(ASCE);2002.p.1518-32.
Chen MP,Juang J,Ladd J.Physical properties,compressional wave velocity and consolidation characteristics of slope sediments Townsville trough,Northeast Australia.In:Proceedings of the Ocean Drilling Program,Scientific Results,vol.133;1993.p.625-32.
Diaz-Rodriguez JA,Leroueil S,Aleman J.Yielding of Mexico City clay and other natural clays.Journal of Geotechnical Engineering 1992;118(7):981-95.
Diaz-Rodriguez JA.Characterisation and engineering properties of Mexico City lacustrine soils.In:Tan TS,Phoon KK,Hight DW,Leroueil S,editors.Characterisation and engineering properties of natural soils,vol.1.A.A.Balkema;2003.p.725-56.
Diaz-Rodriguez JA.Comportamiento monotónico de suelos diatomáceos,Revista.Internacionalde Desastres Naturales.Accidentese Infraestructura Civil 2011;12(1):28-34(in Spanish).
Hong ZS,Zeng LL,Cui YJ,Cai YQ,Lin C.Compression behaviour of natural and reconstituted clays.Géotechnique 2012;62(4):291-301.
Hooghiemstra H,Sarmiento G.Long continental pollen record from a tropical intermontane basin:late Pliocene and Pleistocene history from a 540-meter core.Episodes 1991;14:107-15.
Holler PR.Consolidation characteristics and permeabilities of sediments from the Japan Sea.In:Proceedings of the Ocean Drilling Program,Scientific Results,vol.127/128;1992.p.1123-33.
Holtz RD,Kovacs WD,Sheahan TC.An introduction to geotechnical engineering.2nd ed.Prentice Hall;2011.
Horpibulsuk S,Yangsukkaseam N,Chinkulkijniwat A,Du YJ.Compressibility and permeability of Bangkok clay compared with kaolinite and bentonite.Applied Clay Science 2011;52(1-2):150-9.
Jang J,Santamarina JC.Fines classification based on sensitivity to pore-fluid chemistry.Journal of Geotechnical and Geoenvironmental Engineering 2016;142(4):06015018.https://doi.org/10.1061/(ASCE)GT.1943-5606.0001420.
Jardine RJ.Nonlinear stiffness parameters from undrained pressuremeter tests.Canadian Geotechnical Journal 1992;29(3):436-47.
Koumoto T,Houlsby GT.Theory and practice of the fall cone test.Géotechnique 2001;51(8):701-12.
Ladd J,Moran K,Kroon D,Jarrad R,Chen M,Palmer-Julson A,Gleen C.Porosity variation and consolidation on the Northeastern Australian margin.In:Proceedings of the Ocean Drilling Program,Scientific Results,vol.133;1993.p.617-23.
Lambe TW,Whitman RV.Soil mechanics,Si version.New York:John Wiley&Sons;1979.
Leroueil S,Tavenas F,Bihan JPL.Propriétés caractéristiques des argiles de l’est du Canada.Canadian Geotechnical Journal 1983;20(4):681-705(in French).
Leroueil S,Vaugham PR.The important and congruent effects of structure in natural soils and weak rocks.Géotechnique 1990;40(3):467-88.
McKillop AK,Moran K,Jarrett K,Farrell J,Murray D.Consolidation properties of Equatorial Pacific Ocean sediments and their relationship to stress history and offsets in the leg 138 composite depth sections.In:Proceedings of the Ocean Drilling Program,Scientific Results,vol.138;1995.p.357-69.
Mitchell JK.Fundamentals of soil behavior.2nd ed.New York:John Wiley&Sons;1993.
Moya J,Rodriguez J.El subsuelo de Bogota y los problemas de cimentaciones.In:Proceedings of the 8th panamerican conference on soil mechanics and foundation engineering.Universidad of Nacional de Colombia;1987.p.197-264(in Spaish).
Polidori E.Discussion:proposalfora new plasticity chart.Géotechnique 2004;54(8):555-60.
Roscoe KH,Schofield AN,Wroth CP.On the yielding of soils.Géotechnique 1958;8(1):22-52.
Santamarina J,Diaz-Rodriguez J.Friction in soils:micro and macroscale observations.Cambridge,USA.In:Proceedings of the 12th Pan-American Conference on Soil Mechanics and Geotechnical Engineering,vol.1;2003.p.633-8.
Seed HB,Woodward RJ,Lundgren R.Fundamental aspects of the Atterberg limits.Journal of the Soil Mechanics and Foundations Division,ASCE 1964;90(6):75-105.
Sides G,Barden L.The microstructure of dispersed and f l occulated samples of kaolinite,illite and montmorillonite.Canadian Geotechnical Journal 1971;8(3):391-9.
Shiwakoti DR,Tanaka H,Tanaka M,Locat J.influences of diatom microfossils on engineering properties of soils.Soils and Foundations 2002;42(3):1-17.
Skempton AW,Jones OT.Notes on the compressibility of clays.Quarterly Journal of the Geological Society 1944;100(1-4):119-35.
Tanaka H,Locat J,Shibuya S,Soon TT,Shiwakoti DR.Characterization of Singapore,Bangkok,and Ariake clays.Canadian Geotechnical Journal 2001;38(2):378-400.Tatsuoka F,Santicci de Magistris F,Hayano K,Momoya Y,Koseki J.Some new aspects of time effects on the stress-strain behaviour of stiff geomaterials.In:Evangelista A,Picarelli L,editors.The geotecchnics of hard soils-soft rocks,proceedings of the 2nd international symposium on hard soils-soft rocks.Rotterdam:A.A.Balkema;2000.p.1285-371.
Tavenas F,Des Rosiers JP,Leroueil S,La Rochelle P,Roy M.The use of strain energy as a yield and creep criterion for lightly overconsolidated clays.Géotechnique 1979;29(3):285-303.
Torres V,Vandenberghe J,Hooghiemstra H.An environmental reconstruction of the sediment infill of the Basin of Bogotá(Colombia)during the last 3 million years from abiotic and biotic proxies.Palaeogeography,Palaeoclimatology,Palaeoecology 2005;226(1-2):127-48.
Vardanega PJ,Bolton MD.Strength mobilization in clays and silts.Canadian Geotechnical Journal 2011;48(10):1485-503.
Vardanega PJ,Haigh SK.The undrained strength-liquidity index relationship.Canadian Geotechnical Journal 2014;51(9):1073-86.
Whitlow R.Basic soil mechanics.New York:John Wiley&Sons;1990.
Wood DM.Index properties and critical state soil mechanics.In:Proceedings of the international symposium on recent developments in laboratory and field tests and analysis of geotechnical problems.Rotterdam:A.A.Balkema;1986.p.309-31.
Wood DM.Soil behaviour and critical state soil mechanics.Cambridge,UK:Cambridge University Press;1990.
 Journal of Rock Mechanics and Geotechnical Engineering2018年2期
- Journal of Rock Mechanics and Geotechnical Engineering的其它文章
- A new design equation for drained stability of conical slopes in cohesive-frictional soils
- Resilient modulus prediction of soft low-plasticity Piedmont residual soil using dynamic cone penetrometer
- Assessment of natural frequency of installed offshore wind turbines using nonlinear finite element model considering soil-monopile interaction
- Behavior of ring footing resting on reinforced sand subjected to eccentric-inclined loading
- Investigation of active vibration drilling using acoustic emission and cutting size analysis
- Numerical analysis of Shiobara hydro power cavern using practical equivalent approach
