
Insights into the radial water jet drilling technology-Application in a quarry
2018-04-24 00:54ThomasReinshBoPaapSimonHahnVolkerWittigSineyvanenBerg
Thomas Reinsh,Bo Paap,Simon Hahn,Volker Wittig,Siney van en Berg
aGFZ German Research Centre for Geosciences,Telegrafenberg,14473 Potsdam,Germany
bTNO,Sustainable Geo Energy,Utrecht,The Netherlands
cInternational Geothermal Centre-GZB,Lennershofstr.140,44801 Bochum,Germany
dWell Services Group,Phileas Foggstraat 65,NL-7825 AL Emmen,The Netherlands
1.Introduction
Applying high pressure water jets to penetrate rocks is extensively studied since the middle of the 20th century(e.g.Farmer and Attewell,1965).Applications range from cutting/carving applications(e.g.Harris and Mellor,1974;Summers and McGroarty,1982;Hagan,1992)to downhole drilling(e.g.Maurer et al.,1973;Deily,1977;Pols,1977a,b).In recent years,the application of the radial water jet drilling(RJD)technology is increasingly investigated to perforate and stimulate low performing wells(e.g.Buset et al.,2001;Bruni et al.,2007;Cirigliano and Talavera Blacutt,2007;Seywald and Marschall,2009;Abdel-Ghany et al.,2011;Elliott,2011;Cinelli and Kamel,2013).For the RJD technology,a bottom hole assembly,generally referred to as ‘def l ector shoe’,is connected to a tubing and lowered to the target depth.For cased hole intervals,a coiled tubing conveyed milling assembly is lowered through the tubing.At the bottom,the def l ector shoe def l ects the milling bit towards the casing.After milling a hole into the casing,a jetting assembly is lowered through the tubing.The coiled tubing conveyed jetting assembly consists of a self-propelled jetting nozzle attached to a flexible hose.This assembly is capable of jetting up to 100 m into the formation.
Recently,the RJD technology has gained considerable interest for stimulating low performing geothermal wells,motivating numerical investigations to estimate the benefit from applying this technology(e.g.Peters et al.,2015).For enhanced or engineered geothermal systems,it is considered as a viable alternative to conventional hydraulic stimulation technologies and has triggered several research projects(e.g.Reinsch and Bruhn,2016).As one of the first applications in a geothermal environment in Europe,RJD stimulation was performed in a low performing injection well in Klaipeda,Lithuania.RJD was applied to jetting 12 laterals with a length up to 40 m each,leading to an increase of injectivity of about 14%although a maximum increase of 57%was suggested by numerical modeling(Nair et al.,2017).Analysing the sensitivity to different model parameters like lateral direction and length,which influences the predicted increase by up to 10%for individual parameters,underlines the importance of proper monitoring equipment to measure the laterals’geometry(Nair et al.,2017).
While rock penetration experiments can be performed in the laboratory with good access to the process parameters as well as the jetted holes afterwards,RJD operations are performed downhole with limited access to process parameters and no option to investigate the jetted holes(fora review on different laboratoryand field experiments,please see Blöcher et al.,2016).In order to bridge this gap,we performed a jetting experiment in a quarry with the state-of-the-art RJD technology.Monitoring and in fl uencing process parameters like fluid pressure and fl ow rate could easily be implemented.In addition,the jetted holes were accessible afterwards for geometry measurements and could be surveyed visually.Although jetting individual holes at ambient surface conditions is not comparable to downhole applications with regard to the reservoir pressure and temperature conditions as well as saturation and stress conditions within the rock,various aspects of the technology can be investigated:
(1)To control jetting parameters(pressure and f l ow rate)and monitor their effects on process parameters such as rate of penetration(ROP),fluid return,and cutting return.
(2)To monitor the direction of a jetted hole by acoustic/seismic measurements at the surface during the jetting process.
(3)To inspect the inside of the jetted hole,thereby determining the shape of the jetted hole as well as its trajectory.
(4)To observe the influence of local geological or structural interfaces on the jetting process as well as the hole geometry.
(5)To determine the change in injectivity over the length of the jetted hole,especially when intersecting permeable features,e.g.a fracture.
(6)To collect eroded rock particles/cuttings for further investigation.
(7)To analyse if the jetting process parameters can be used to infer details about the jetted formation.
(8)To test different jetting nozzles.
1.1.Selection of quarry
To ensure sufficient penetration depth and rate during the drilling experiment in a quarry,pre-quarry jetting tests were performed on different rock samples in yard tests at ambient surface conditions.Three types of sandstones were selected based on rock properties,mainly permeability and porosity,and the accessibility of the respective quarry(see Table 1).In addition,the pre-quarry tests were used to perform acoustic measurements during jetting to determine the frequency spectrum of the acoustic signal resulting from the jet-rock interaction.
Either a static or a rotating RJD nozzle was attached to a flexible high pressure hose and connected to a high pressure triplex pump.To control the stand-off distance between the nozzle andthe rock surface,the nozzle was clamped to a hydraulic piston capable of steering it towards the rock surface.The rock samples were neither saturated nor immersed in water during the tests.Rock samples of approximately 50 cm×50 cm×50 cm were positioned in front of the nozzle and equipped with three types of acoustic sensors:
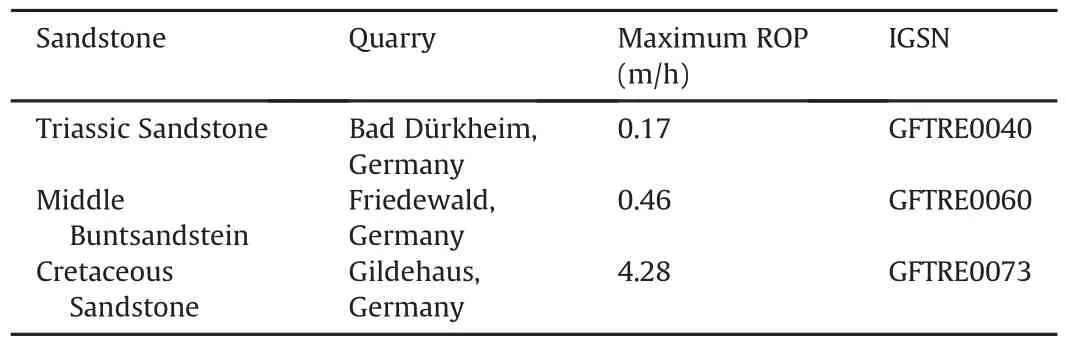
Table 1Rock samples and respective quarries tested in the yard tests.The last column gives the International Geo Sample Number(IGSN).
(1)Accelerometers for frequencies up to 800 Hz(Sercel DSU-3,200-800 Hz).
(2)Geophones for frequencies up to 5000 Hz(GS-14).
(3)Piezo-elements for frequencies up to 10,000 Hz(BK 4514-B).
Due to the full overlap in frequency response of the geophones with the other two instruments,the geophones were considered redundant and not used for monitoring in the quarry experiment.Table 1 lists the maximum ROP achieved during the yard tests.It is shown that the highest ROP was obtained for the Cretaceous Sandstone from Gildehaus,Germany.For a static nozzle,significantly lower ROPs were observed compared to a nozzle with a selfpropelled rotating head,referred to as rotation nozzle.Therefore,it was decided to perform the jetting experiment mainly with a rotating nozzle in the Gildehaus quarry,Germany.
Based on previous studies by Hardy Jr.(2003),Kovacevic et al.(1998),and Rabani et al.(2012)and on the pre-quarry rock jet tests in Bochum,the signal of the jetting activity in the quarry experiment was expected to lie in the frequency range of 500-10,000 Hz.Based on this,we decided to deploy three-component accelerometers combined with piezo-elements in the quarry,since they can together properly span the expected frequency band of the acoustic activity.
1.2.Description of quarry and geology
The quarry Gildehaus is located in North-West Germany,3.5 km west of Bad Bentheim and close to the border with the Netherlands(52°18′8.42′N,7°6′18.76′E).It is located about 50 m above mean sea level between the Ems-and Münsterland,within the Westfälische Bucht.The stratigraphyof the sandstone canbe classified as Lower-Valanginian,Lower Cretatious(Haack,2007).
At the onset of the Cretaceous time,a continental landmass developed in the northern part of Germany.Therefore,siliciclastic sediments were deposited.During the subsequent subsidence of the area,the Niedersächsische Transtensionsbecken as well as the Münsterländer Kreidebucht was formed and a shelf sea,the chalk sea,was able to transgress.Within the Lower Cretaceous,diagenetic processes formed the up to 70 m thick Bentheimer sandstone.Onto the Bentheimer sandstone,marl and limestones were deposited within a depth up to 250 m in the sea.Climate changes at the end of the Cretatious led to a regression of the Cretaceous sea.Due to the periodical trans-and regression of the North Sea,successive sedimentary layers were deposited during the Tertiary age.Since the Quaternary,Tertiary and Cretaceous sediments were almost entirely eroded,in some locations such as Bad Bentheim,Cretaceous sediments are outcropping within sediments of mainly glacial and f l uviatile origin(Meschede,2015).Due to the uplift of a salt-diapir beneath Bad Bentheim,an anticline formed.The layering of the Bad Bentheim sandstone therefore dips to the south.
The quarry Gildehaus covers an area of about 18,000 m2with a length of about 300 m.It can be subdivided into five excavation sites.At its lowest point,the quarry is about 30 m deep.Our jetting experiments were performed in the central part of the quarryat the southern side.

Fig. 1.View to the east onto the quarry wall used for the jetting experiments.Subvertical red lines indicate major fracture zones.The sub-horizontal yellow line indicates the direction of the layering,whereas the thick sandstone layer can be seen below and the interlayered section can be seen above.

Fig. 2.Fracture face in Gildehaus quarry.Reddish-brown colours originate from ironmanganese minerals.
The outcropping sandstone consists of a homogeneous,weakly weathered,and non-graded sandstone.The lower part of the wall is made of a massive sandstone layer with a thickness of up to 10 m which is currently quarried,mainly in the western part of the quarry.It is overlain by a unit of about 5 m in thickness,consisting of 5-20 cm thick sandstone layers separated by thin clay layers(Fig. 1).On top,a massive sandstone with little layering can be found.
Overall,the colour of the Bad Bentheim sandstone is grey-beige to brownish if weathered and light-grey to beige on fresh surfaces.Individual clay layers can clearly be identified by their darker appearance.On fracture faces,iron-manganese minerals are abundant and can be identified by their reddish-brown colour(see Fig. 2).
On average,individual sandstone layers have a strike and dip of about 183°/28°.Fractures instead show a strike and dip of 25°/76°.Due to the anticline structure,individual fracture faces can dip to the south/south-west,rotated by 180°.Individual larger fractures show an offset of about 1-3 cm.The aperture of the individual fractures varies from<0.1 mm to 1 cm at the quarry wall.A single major fracture zone with a width of 17 cm was observed,which is divided into multiple smaller fractures.Individual fractures have a terraced,undulating,and smooth surface.The mainly well sorted fine-to-medium size grained sandstone is free of lime and consists of 95%quartz grains which are moderately rounded and cemented with a siliciclasic cement.The sandstone has a feldspar content of about 2%and can be classi fi ed as Arenite(DIN,2003;Stow,2008).A porosity up to 22.8%is reported(Klein et al.,2001).
2.Experimental set-up
2.1.Hydraulic set-up
Before the jetting experiment,three ‘wellheads’were prepared at the quarry wall.A coring machine was used to drill 67 mm diameter holes up to 30 cm into the quarry wall.Into these holes,2′′(≈5.08 cm)WECO 1502 pup-joints with a length of about 0.6 m were cemented with composite mortar.After drying,a hand-held drilling machine was used to penetrate the mortar at the bottom of the WECO tubes.During jetting,a hydraulic system was attached to the pup-joints.Borrowing terminology fromoilfield applications,the necessaryset-up is herereferred toas X-mas tree.Fig. 3 shows a schematic overview of the set-up together with different sensors installed in the hydraulic system.
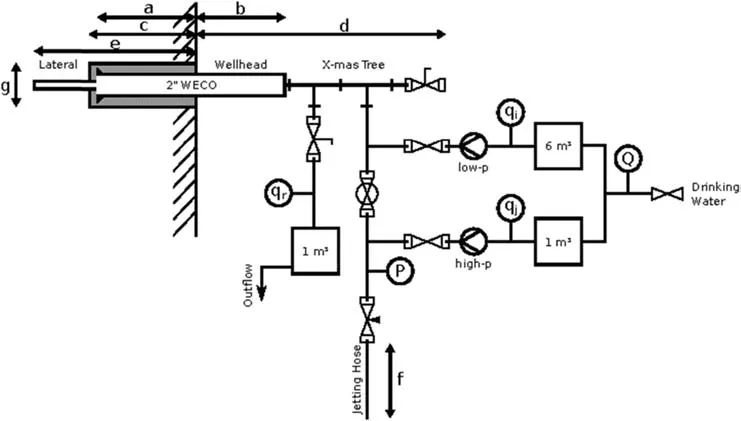
Fig. 3.Wellhead set-up during jetting operation.For details on the geometry,please see Table 2.

Table 2Length information(m)for the different jetted holes.See Fig. 3 for the nomenclature of different components.The depth(m)of the holes(e)is evaluated using information from drilling and subsequent logging campaigns.
The X-mas tree started with a T-piece.The downward facing part redirected the back- fl ow including the cuttings from jetting.This fluid went through a valve and a crossover to a 1′hose.It was fi ltered to retrieve the cuttings and directed into a 1 m3Intermediate Bulk Container(IBC).Here,the return fluid volumes could be measured.On the collinear side of the T-piece,another T-piece was connected.The downward facing part was connected to a blind-cap with a 1/2′NPT thread,allowing for injection testing through this inlet.The collinear connection was connected to a valve.Through this valve,the jetting hose was fed into hole.During injection testing,both valves at the end of the X-mas tree as well as at the fluid return were closed.
For jetting and injection testing,two pumps were used.For the injection testing,we used a ‘low pressure’pump.This pump is capable of delivering 60-200 L/min at a maximum pressure of 600 bar(1 bar=100 kPa).The maximum pressurewas set to 50 bar.For the jetting,a ‘high pressure’pump capable of delivering 11-30 L/min at a maximum pressure of 1000 bar was used.Due to the pressure rating of the equipment,the maximum operating pump pressure was set to 700 bar.
The ‘low pressure’pump was connected to the wellhead via a 100 barrated 3/4′ID hose.The ‘high pressure’pump was connected to the jetting hose via a 700 bar rated flexible hose with a pressure gauge before the jetting hose.The jetting hose itself was a 700 bar rated flexible hose.For the first jetting experiments,we used a length of 50 m.Later,we shortened it to 15 m to increase the available fluid pressure at the nozzle.For RJD applications,pressure friction loss within the CT as well as the flexible hose determines the available pressure at the nozzle.In downhole applications,the pressure at the nozzle can be increased by decreasing the length of the CTor the flexible hose or by increasing diameters.In our jetting experiment,wedid notaim fora specific pressure at the nozzle.The experiment,therefore,can only give indications on performance parameters,e.g.for the ROP,when compared to downhole applications.Parameters like hole geometry and hole survey,however,should be comparable.
During jetting and testing at one wellhead,the remaining two wellheads were plugged and pressure gauges were used to monitor any pressure changes.As none of the other wellheads was fluid fi lled and the formation was not saturated,no pressure change was measured.Fig. 4 shows the wellhead installation on the second jetted hole.High pressure hoses as well as pressure gauges and seismic receivers attached to the wall are shown.
As we were not able to jet the planned 25 m in holes 1-3,it was decided to jet two more holes,i.e.holes 4 and 6.For holes 4 and 6,no wellhead with X-mas tree was installed.For holes 4 and 6,pilot holes were drilled with a 20 mm diameter rotary bit down to 15 cm and a 16 mm rotary bit down to 30 cm,respectively.Due to the missing wellhead,no injection tests could be performed.Cuttings were collected using a bucket placed along the vertical rock surface beneath the drilled hole.The position and direction of the pilot holes 4 and 6 were chosen not to intersect with any interfaces(bedding or fractures)within the surrounding rock mass.Hole 5 was marked but not drilled.
2.2.Acoustic monitoring
The acquisition layout is shown in Fig. 5.The monitoring instrumentation consisted of three-component accelerometers and unidirectional piezo-elements.Sensors were deployed with 2 m spacing along two lines termed L1 and L2 that were approximately parallel to ground level.Along line L1,both accelerometers and piezo-elements were placed to compare the performance of the two types and test the localisation method.Line L1 was used as a proxy for a downhole application where sensors can only be placed vertically in a well.In the quarry,we used the possibility to sample the acoustic wavefield in another plane,by placing accelerometers along line L2.

Fig. 4.Wellhead of hole 2 installed in quarry wall.Wellhead 1 was equipped with a pressure sensor.Three-component geophones were cemented into the quarry wall(red)together with piezo-elements for high frequency recording.Hole numbers are indicated.

Fig. 5.Geometry of sensors relative to individual jetted holes.The sensors are subdivided into a L1-and a L2-line.For the x′z and y′z projections,the coordinate system was rotated by-45°.
During the jetting process,we expected a more or less continuous acoustic signal,and therefore needed to adopt techniques that are capable of processing continuous signals into finite signals to provide information on source location.The localisation technique thatweusedhererelied ondrill-bit interferometryas applied in the oil and gas industry,which was thoroughly explained and demonstrated byRectorand Marion(1991),and Polettoet al.(2004,2010,2014).
We implemented the following workf l ow to estimate the location of the radial path:
(1)Recorded data are conditioned by suppressing harmonic or cultural noise and isolating signal that comes directly from the interaction between nozzle jet and rock.Therefore,we compared data acquired during jetting periods to data from periods when there was no activity.We used a Butterworth bandpass f i lter to reject undesired signal.
(2)Synthetic travel times of the P-wave arrival are calculated for all stations using a P-wave velocity model derived from active hammer shot data acquired at the quarry wall.Synthetic travel time data are calculated for all relevant source-receiver combinations.
(3)The continuous data are divided into distinct files of specific duration.The duration is chosen such that it represents a time window within which we can assume that the nozzle source is at a stationary location.
(4)Data of all station pairs are cross-correlated.Subsequently,the envelope of the resulting cross-correlated data is calculated,along which energy is stacked along synthetic delay times per synthetic source location.
(5)This yields a maximum value for the synthetic source location for each time window that best explains the observed travel time data.
2.3.Jetting program
It was planned to jet three holes with different angles towards the local fracture network as well as the bedding with a length up to 25 m.After every 4 m,it was planned to perform a short-terminjection test.We assumed a decreasing injection pressure for a specific f l ow-rate over the length of the jetted hole.In case a fracture was intersected,this pressure was assumed to drop drastically.Data were supposed to show if any permeable features within the quarry wall were intersected.Between individual jetting intervals,the holes were inspected with a camera.During the tests,static and rotating nozzles were tested.Table 3 gives an overview of the different nozzle geometries tested during the experiment.Table 4 displays an overview about the different activities during the quarry experiment.

Table 3Nozzles to be tested.
3.Results
We were able to jet individual holes with a length up to 12.3 m during the experiment.As we were not able to reach the anticipated 25 m,we decided to jet the additional holes 4 and 6.Injection tests into the unsaturated large open fractures,connected to the surface of the quarry wall,did not produce an evaluable dataset.Injection tests were therefore only performed in holes 1 and 2.In holes 4 and 6,total circulation loss was observed at a depth of 10.25 m and 2.9 m,respectively,indicating the connection to a high permeable fracture.For holes 1-3,the return f l ow data were inconclusive and a total circulation loss was not detected.Table 2 lists the geometric information for different holes that were jetted during the quarry experiment.
3.1.Jetting performance
During jetting,we measured the ROP in relation to jetting pressure and nozzle geometry.Using static nozzles(Table 3),we observed no ROP in the quarry.Individual ROP measurements were averaged over 25-50 cm intervals.For the rotating nozzles with 3 and 4 forward directed orif i ces,no conclusive results were obtained that favour one geometry over the other(Fig. 6).In addition,the length of the jetting hose was reduced from 50 m to 15 m during the experiment.Reducing the length of the hose decreased the pressure friction loss by about 100 bar at the maximum f l ow rate.For the additional pressure of 100 bar at the nozzle,a significant and sustainably increased ROP was not observed.On average,the ROP was a couple of cm/min.Anincreased ROP was observed in the first section of hole 1(0-3.5 m depth),the second interval in hole 2(1-2 m depth)and the single interval in hole 3.Holes 4 and 6,intentionally inclined not to intersect any structural feature(bedding or fracture),show a more stable ROP.

Table 4List of experiments performed in different holes(Y=yes,N=no).
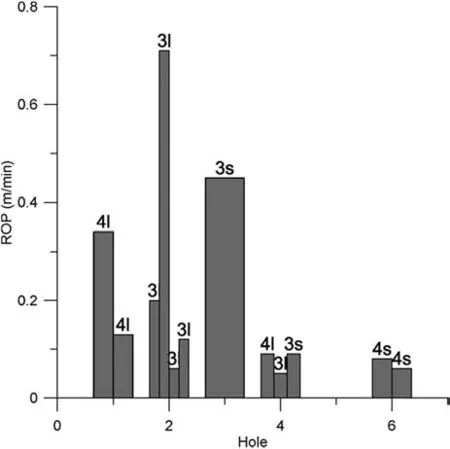
Fig. 6.Rate of penetration for the different holes calculated for individual sections along each hole.The number associated to each bar indicates the number of forward directed orif i ces for the nozzle used in the test.‘l’and ‘s’indicate the length of the high pressure hose(long:50 m,and short:15 m).
3.2.Inspection of jetted holes
3.2.1.Visual inspection
Each hole was inspected with an endoscope made from a USB camera fastened to a f i bre glass rod here referred to as endoscope(Fig. 7).The endoscope was pushed into each hole until the total depth or until a narrow spot prohibited the endoscope to progress deeper into the hole.Overa largeinterval of each hole,the diameter was a little larger than 20 mm(Fig. 8).However,the drift is significantly smaller.We were not able to push an 18 mm rod for more than 17 cm in any of the holes.On the other hand,a geometry sensor of 10 cm length and 12 mm diameter could be pushed along the holes.In individual intervals,although not very prominent,a star-shape profile was observed,indicating erosion caused by the backward directed nozzles.
Fig. 9 shows the endoscopic view of three fractures that were intersected during jetting.Each fracture was intersected under a different angle varying from an estimated 25°to almost 90°.On the fracture faces,iron-manganese minerals can be observed.Before the 90°fracture,a larger excavated volume can be observed indicating that the fracture face was harder to penetrate.Without ROP in front of the fracture face,the weaker sandstone was eroded.
Fig. 10 showsthe bottomof hole 2,wherea larger void spacewas hit.In front of the endoscope,the sandstone surface was slightly eroded.However,the nozzle did not further penetrate into the formation at this depth.From the visual inspection,it is hard to determine if a fracture or a bedding feature was intersected.Although,for individual fracture faces,the brownish colour is a good indicator for a fracture interface,thin layers of less resistant mudstone were washed out during jetting.If an offset corresponds to a fracture or a washed out lithological layer,it is difficult to distinguish.

Fig. 7.Home-made endoscope used for inspecting holes.A USB camera was attached to a f i bre glass rod and pushed into all holes.
3.2.2.Trajectory
The geometry was measured with a three-dimensional(3D)accelerometer combined with a 3D magnetic field sensor.The sensor was attached to a f i bre glass rod and pushed into the hole.While pulling out of hole,a measurement of azimuth and inclination was performed every 25 cm.
None of the measured trajectories is completely straight.All trajectories either have a rather constant change in direction over the entire length of each hole,or short radius changes at specific depths.An overview about the individual geometries is given in Fig. 11,where different two-dimensional(2D)projections are shown together with the dogleg severity,to indicate the change in direction per depth interval.For holes 1-3,the metal pipe was magnetized and in fl uenced the trajectory measurement.For the fi rst depth interval,where elevated magnetic field data indicated a strongly magnetized pipe,the initial direction was estimated to be normal to the quarry wall.When leaving the pipe,all holes show a high dogleg severity indicating that the jet hole was initiated slightly deviated from the axis of the wellhead.

Fig. 8.Endoscopic view into the jetted hole.The red lines indicated the hole geometry.It has a diameter of about 20 mm.

Fig. 9.Selected endoscopic view into two holes.(a)A fracture was intersected at an angle of about 45°.The fracture face is characterized by brownish colours.(b)A fracture was intersected at an angle close to 90°.A large volume was excavated before the fracture.The fracture face is characterized by brownish colours.And(c)A fracture was intersected at an estimated angle of 25°.The fracture is indicated by the dashed red line.
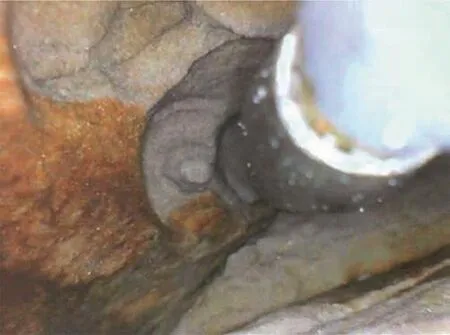
Fig. 10.Endoscopic view into the second jetted hole.The jetting nozzle hit a larger void space.Here,ROP decreased to zero and the hole was terminated.
Overall,the trajectories seemed to be diverted upwards over the length of each hole.Even when initially directed downwards,the curvature changed towards the top of the quarry.In addition to large radius direction changes towards the top of the quarry as well as within the horizontal plane,short radius changes can be observed in the dogleg severity plot.Apart from the end of the wellheads in holes 1-3,strong change in direction was observed for hole 1,where two distinct depths at 1-2 m as well as 4-5 m were located.From the visual inspection,apart from the onset of the jetted hole at the end of the pipe,a very heterogeneous hole geometry with larger cuttings remaining inside the hole was found in the first interval.This coincides with the depth of both thin bedding as well as intersection with a fracture.From the visual inspection,none of both interfaces can be excluded to have caused the change in direction.For the change in direction observed at greater depth,a larger oval-shaped caving was observed with a diameter of more than about 5 cm.At this depth,an interface was intersected.In addition,the hole split into two arms.To remove cuttings from the hole during jetting,the jetting hose was pulled out of hole from time to time.In this depth,a‘sidetrack’was initiated due to hole cleaning.Which one of both holes was entered with the geometry sensor cannot be determined from the visual inspection.The reason for the larger excavation causing the deviation might be the intersected interface.The deviations in hole 6,although initially directed such that it does not intersect any interface,show an almost constant change in direction at a depth larger than 2 m.Visual inspection showed that several interfaces including larger excavations could be observed from that depth.Neither structural features nor any bedding was observed before that depth.In hole 4,the geometry tool was stuck in about 1 m below surface.

Fig. 11.Survey of jetted holes projected to a single reference point.
3.2.3.Cutting analysis
Fig. 12 shows the grain size distribution of cuttings retrieved from holes 1-3 where a reliable sampling was guaranteed by the hydraulic set-up.For all three holes,the grain size distribution is similarly corresponding to a medium-grained sand.From the grain size distribution,permeability values were calculated according to empirical formulas derived by Hazen(1893),Seelheim(1880),Beyer(1964),Bialas and Kleczkowski(1970)for unconsolidated sediments as reported in Hölting(1996).For each of the three holes,the calculated permeability values are in the range of 3-17 Darcy(Table 5).This value is very close to permeability values derived from laboratory experiments on intact rock samples of 0.8 Darcy at 50 bar of confining pressure(IGSN:GFTRE0066).
3.3.Acoustic monitoring
During the jetting tests at the Gildehaus quarry,acoustic signal resulting from jetting activity was successfully recorded using accelerometer and piezo-element instruments.Here,we demonstrate the localisation technique for the piezo-element and accelerometer measurements acquired while jetting in hole 1,where a penetration of 5.4 m was reached.Fig. 13 shows the data recorded bypiezo-elementsand accelerometerswhilethe maximum penetration at hole 1 was reached.Both datasets were frequency f i ltered in the same bandpass of 350-950 Hz for comparison.

Fig. 12.Grain size distribution of cuttings sampled during the RJD operation from holes 1-3.

Table 5List of formation permeability in Darcy calculated from grain size distribution of the cuttings as an average and standard deviation from holes 1-3.
Fig. 14 shows the results of the localisation of the acoustic signal received by the piezo-elements and accelerometers while the radial drill at hole 1 was performed.The localisation result in Fig. 14 is shown at the start and termination of the jet,illustrating the source location with highest probability indicated in yellow.The figure shows increased probability(yellow)at the location where the radial is placed,and the estimated location remains close to the quarry wall during drilling.These results are based on a specific data selection with source-receiver offsets of 1-5 m and data inversion is based on a uniform velocity model of 1500 m/s.This velocity was determined from velocity analysis of a hammercalibration shotline conducted along the quarry wall.The location estimations found with the piezo-element and the accelerometer data agree with each other.Their estimated locations have an offset of 5 m compared to the final location as measured with the in situ accelerometer tool.
4.Discussion
4.1.The ROP
Although the ROP was measured during jetting in different lithologicalsettings,with differentnozzle geometries and changing fluid pressures,a conclusive result could not be obtained.Neither jetting in the homogeneous rock formation(e.g.in the first 2 m of hole 6),nor varying nozzle pressure(e.g.in hole 2,where 50 m and 15 m high fluid pressures were used),nor changing the nozzle geometry from a nozzle with 4 to a nozzle with 3 forward directed orif i ces changed the ROP significantly.Individual high ROP values cannot be attributed to any specific downhole situation.One reason might be the spatial and temporal resolution of the ROP measurements.As individual measurements were taken every 25-50 cm,small-scale features like the effect of bedding or fractures on the ROP are obscured.From the geometry,it is known that all holes tend to be directed upwards into the part of the quarry with inter-bedded clay layers.An effect of the lithology on the ROP was not observed with the current set-up.Compared to a real field scale application,ROP values in the quarry were significantly lower than expected but corresponded to the ROPs observed during laboratory experiments at surface conditions.
For the jetting experiments,rotating nozzles were applied.The nozzles created a mainly roundish hole geometry.Before individual fracture faces,larger excavations were observed,indicating a very slow ROP through the interface.Individual clay layers could not be observed visually.The soft clay was likely washed out,making it very difficult to distinguish between a fracture or several closely spaced fractures with a certain aperture and individual clay layers.From the visual inspection,however,it was observed that distinct interfaces can be intersected under different angles without changing the direction of the jetting nozzle.From the visual inspection combined with the geometry information,it can be concluded that all holes tend to orient themselves towards the bedded quarry interval,wherepotentiallysofterformations prevail.A clear indication from the ROP,however,was not observed.In larger cavities,either washed out by the jetting operation or naturally existent within the rock,the orientation seems to be influenced,as the backwards directed nozzles cannot orient the nozzle sufficiently.
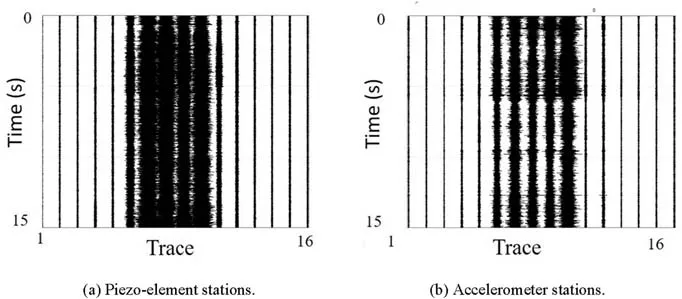
Fig. 13.Acoustic data acquired during jetting hole 1 along L1.(a)Acoustic waveform data recorded at 16 piezo-element stations.The vertical component data are plotted having the same orientation as the piezo-elements.(b)Acoustic waveform data recorded at 16 accelerometer stations.Both datasets were passed within the frequency band of 350-950 Hz.
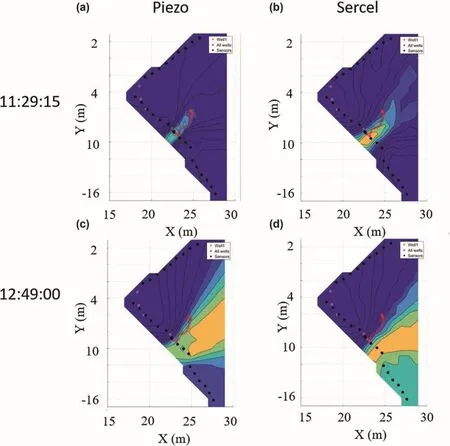
Fig. 14.Results of localization of acoustic data from hole 1.(a,b)Estimated location based respectively on the piezo-element and the accelerometer data during the start of the jetting.(c,d)Estimated location based respectively on the piezo-element and the accelerometer data when maximum penetration was reached.
From the cutting analysis,assuming an unconsolidated sand,permeability values could be calculated.For the very homogenous,high porosity sandstone in Gildehaus,the calculated permeability values correspond very well to permeability data measured on intact rock samples under laboratory conditions.Although a sandstone as homogeneous as the Gildehaus sandstone will likely not be found in typical downhole applications,valuable data might be gathered from the cuttings.
4.2.Acoustic monitoring
Careful inspection of the acoustic data proved that only a limited part of the data was suited to perform inversion of continuous signal data to location estimation.Careful selection of data turned out to be especially important.Data should contain a minimum amount of undesired noise,such as man-made activity along the wall.Additionally,the strength and signature of acoustic data showed significant variations during individual jetting tests,which might be related to the various speeds at which the nozzle moved as well as the inhomogeneities within the rock.These signal variations appeared to have a significant effect on the robustness of the location estimates.This is partially related to the simpleone-dimensional(1D)velocitymodelusedherefor inverting travel times to source location estimations.The actual structure of the quarry wall is more complex,containing a number of fractures that will affect transmission and reflection behaviours of propagating waves.This will result in biases of measured travel times obtained from recorded station data,with respect to simulated travel times of the best fitting source location.Furthermore,reflections occurring along the free surface of the quarry wall may complicate an accurate estimation of the nozzle location and reconstruction of the jet path.Additionally,by using higher frequency information for small source-receiver offsets,the source estimation might be improved.A challenge here is that the accuracy of the geometry(source,receivers and geology)becomesincreasinglyimportantwhen considering higher frequencies to correctly predict time differences in travel time arrivals between stations.The accuracy of estimation of the jetted path is significantly smaller compared to the in situ location measurements.However,the acoustic localization can provide a mean of identifying zones where the nozzle has passed,and provides a clue in which direction the path has been set.It is encouraging that the inversion results of part of the piezoelement and accelerometer data agree with each other.The offset in location between acoustic inversion and accelerometer tool probably results from the simplif i ed homogeneous velocity model that we assumed.
5.Conclusions
(1)Monitoring the acoustic activity generated by the jetting process can in principle provide location estimations of the jetting nozzle within the rock mass.The success of this location method at the quarry site mainly depends on careful data selection,suppression of undesired noise,and the degree of realism accommodated in the forward velocity model used to calculate synthetic travel times that are in turn used to estimate the nozzle locations.A downhole application of geophones can provide insight in the approximate spatial distance towards the nozzle,provided that a sufficient aperture and sensor distribution can be reached within the well.At this stage,however,the accuracy of the jet geometry estimated from downhole acoustic measurements with the current data analysis procedure will be limited compared to in situ measurements.
(2)The jetted holes have a round geometry but a limited drift close to the diameter of the nozzle itself.Intersecting various geological boundaries,the trajectory of the hole is far from straight.Although data suggest that interfaces can be intersected under different angles,it cannot be excluded that structural features caused the deviation of the hole.For this experiment,the spatial resolution of the geometry measurement was to low(25 cm),and the geometry information reasonably gained for individual interfaces(plural)from geological mapping at the rock surface was not accurate enough when projected to depth.
(3)The pressure information from injection experiments alternating with the jetting could not be used to evaluate downhole permeabilities due to large void spaces and multiple high conductive features intersecting the holes.It cannot be excluded that pressure information during the jetting process downhole can be used to have an online information about permeability variations within the formation.Performance parameters like ROP,jetting pressure,fluid velocity,and return fluid volume,however,could not be used to assess the hydraulic variability downhole within the quarry.
(4)As already observed in the pre-quarry tests,rotating nozzles proved to generate the highest ROP values in the quarry.
(5)Collected rock cuttings could be used to accurately assess the permeability of the penetrated rock mass.It remains to be proven that this can be applied to the downhole situation as well.
(6)To reduce the curvature of the jetted hole,the jetting nozzle should be stabilized.
Conflict of interest
The authors wish to confirm that there are no known Conflicts of interest associated with this publication and there has been no significant financial support for this work that could have influenced its outcome.
Acknowledgements
Abdel-Ghany M,Siso S,Hassan A,Pierpaolo P,Roberto C.New technology application,radial drilling petrobel, fi rst well in Egypt.In:Offshore Mediterranean conference and exhibition,23-25 March,Ravenna,Italy.Offshore Mediterranean conference;2011.OMC-2011-163.
Beyer W.Zur Bestimmung der Wasserdurchlässigkeit von Kiesen und Sanden aus der Kornverteilungskurve.Wasserwirtschaft-Wassertechnik (WWT)1964;14(6):165-9(in German).
Bialas Z,Kleczkowski A.On practical use of certain empirical formulas to determine coefficient of permeability k.In:Archivum Hydrotechniki,Warschau;1970.
Blöcher G,Peters E,Reinsch T,Petrauskas S,Valickas R,van den Berg S.Report on radial jet-drilling(RJD)stimulation technology.GFZ German Research Centre for Geosciences;2016.https://doi.org/10.2312/GFZ.6.2.2018.001.
Bruni MA,Biasotti JH,Salomone GD.Radial drilling in Argentina.In:Latin American&Caribbean petroleum engineering conference,15-18 April,Buenos Aires,Argentina.Society of Petroleum Engineers;2007.https://doi.org/10.2118/107382-MS.SPE-107382-MS.
Buset P,Riiber M,Eek A.Jet drilling tool:cost-effective lateral drilling technology for enhanced oil recovery.In:SPE/ICoTA coiled tubing Roundtable,7-8 March,Houston,Texas.Society of Petroleum Engineers;2001.https://doi.org/10.2118/68504-MS.SPE-68504-MS.
Cinelli SD,Kamel AH.Novel technique to drill horizontal laterals revitalizes aging field.In:SPE/IADC drilling conference society of petroleum engineers,5-7 March,Amsterdam.The Netherlands;2013.https://doi.org/10.2118/163405-MS.SPE-163405-MS.
Cirigliano RA,Talavera Blacutt JF.First experience in the application of radial perforation technology in deep wells.In:Latin American&Caribbean petroleum engineering conference,15-18 April,Buenos Aires,Argentina.Society of Petroleum Engineers;2007.https://doi.org/10.2118/107182-MS.SPE-107182-MS.
Deily F.Five wells test high-pressure drilling.Oil and Gas Journal 1977;75(27):74-81.
DIN.Geotechnische Erkundung und Untersuchung-Benennung,Beschreibung und Klassi fi zierung von Fels-Teil 1:Benennung und Beschreibung(Technical report).DIN Deutsches Institut für Normung e.V;2003(ISO 14689-1:2003);Deutsche Fassung EN ISO 14689-1:2003(in German).
Elliott S.Coiled-tubing method drills radial laterals to improve oil production from a depleted reservoir.World Oil Magazine 2011.
Farmer I,Attewell P.Rock penetration by high velocity water jet:a review of the general problem and an experimental study.International Journal of Rock Mechanics and Mining Sciences&Geomechanics Abstracts 1965;2(2):135-53.
Haack.Haack-Weltatlas.Klett Ernst/Schulbuch.2007(in German).
Hagan P.The cuttability of rock using a high pressure water jet.In:Western Australian conference on mining Geomechanics;1992.p.12.
Hardy Jr HR.Acoustic emission/microseismic activity.Principles,techniques and geotechnical applications,vol.1.CRC Press;2003.
Harris H,Mellor M.Cutting rock with water jets.International Journal of Rock Mechanics and Mining Sciences&Geomechanics Abstracts 1974;11(9):343-58.
Hazen A.Some physical properties of sands and gravels with special reference to their use in fi ltration.1893.p.541-56.
Hölting B.Hydrogeologie Einführung in die Allgemeine und Angewandte Hydrogeologie.5th ed.Ferdinand Enke Verlag;1996(in German).
Klein E,Baud P,Reuschlé T,Wong TF.Mechanical behaviour and failure mode of Bentheim sandstone under triaxial compression.Physics and Chemistry of the Earth,Part A:Solid Earth and Geodesy 2001;26(1):21-5.
Kovacevic R,Kwak HS,Mohan RS.Acoustic emission sensing as a tool for understanding the mechanisms of abrasive water jet drilling of difficult-to-machine materials.In:Proceedings of the Institution of mechanical engineers,Part B:Journal of engineering Manufacture,vol.212(1);1998.p.45-58.https://doi.org/10.1243/0954405981515491.
Maurer WC,Heilhecker JK,Love WW.High-pressure drilling.Journal of Petroleum Technology 1973.https://doi.org/10.2118/3988-PA.
Meschede M.Geologie Deutschlands.1st ed.Springer;2015.https://doi.org/10.1007/978-3-662-45298-1(in German).
Nair R,Peters E,Sliaupa S,Valickas R,Petrauskas S.A case study of ra-dial jetting technology for enhancing geothermal energy systems at klaipëda geothermal demonstration plant.In:Proceedings,42nd Workshop on geothermal reservoir engineering.Stanford,California,USA:Stanford University;2017.p.11.
Peters E,Veldkamp J,Pluymaekers M,Wilschut F.Radial drilling for Dutch geothermal applications.Technical Report.TNO Netherlands;2015.
Poletto F,Malusa M,Miranda F,Tinivella U.Seismic-while-drilling by using dual sensors in drill strings.Geophysics 2004;69(5):1261-71.
Poletto F,Corubolo P,Comelli P.Drill-bit seismic interferometry with and without pilot signals.Geophysical Prospecting 2010;58(2):257-65.
Poletto F,Miranda F,Corubolo P,Schleifer A,Comelli P.Drill-bit seismic monitoring while drilling by downhole wired-pipe telemetry.Geophysical Prospecting 2014;62(4):702-18.
Pols A.Hard-rock jetting-1:tests show jet-drilling hard-rock potential.Oil and Gas Journal 1977a;75(5):134-44.
Pols A.Hard-rock jetting-conclusion:rock-type decided jetting economics.Oil and Gas Journal 1977b;75(6):71-5.
Rabani A,Marinescu I,Axinte D.Acoustic emission energy transfer rate:a method for monitoring abrasive water jet milling.International Journal of Machine Tools and Manufacture 2012;61(Supp.C):80-9.
Rector JW,Marion BP.The use of drill-bit energy as a downhole seismic source.Geophysics 1991;56(5):628-34.
Reinsch T,Bruhn D.The SURE consortium.Novel productivity enhancement concept for a sustainable utilization of a geothermal resource-the SURE project.In:Proceedings,European geothermal Congress 2016,Strasbourg;2016.p.4.
SeelheimF.MethodenzurBestimmungderDurchlässigkeitdesBodens.Zeitschriftfür Analytische Chemie 1880;19(1):387-418.https://doi.org/10.1007/BF01341054(in German).
Seywald M,Marschall C.Usage of radial drilling by RAG.Oil Gas European Magazine 2009;3:114-6.
Stow D.Sedimentgesteine im Gelände:Ein illustrierter Leitfaden(German Edition).Spektrum Akademischer Verlag;2008(in German).
Summers DA,McGroarty S.The mechanism,and some parameters controlling,the water jet cutting of rock.In:The 23rd U.S.Symposium on rock mechanics(USRMS),25-27 August,Berkeley,California.American Rock Mechanics Association;1982.p.531-41.
 Journal of Rock Mechanics and Geotechnical Engineering2018年2期
- Journal of Rock Mechanics and Geotechnical Engineering的其它文章
- Behavior of diatomaceous soil in lacustrine deposits of Bogotá,Colombia
- Assessment of natural frequency of installed offshore wind turbines using nonlinear finite element model considering soil-monopile interaction
- Behavior of ring footing resting on reinforced sand subjected to eccentric-inclined loading
- A new design equation for drained stability of conical slopes in cohesive-frictional soils
- Investigation of active vibration drilling using acoustic emission and cutting size analysis
- Numerical analysis of Shiobara hydro power cavern using practical equivalent approach