Amplitude modulation and extreme events in turbulent channel flow
Y.C.Yao·W.X.Huang·C.X.Xu
1 Introduction
In the last few decades,research on wall-bounded turbulent flow has highlighted the existence of superstructures or very large-scale motions at high Reynolds number[1–3].The strength of these large-scale motions increases with the Reynolds number,and their emergence significantly influences smaller-scale structures over a range of wall-normal locations[4–6].Such amplitude modulation in turbulent shear flows,in which large-scale motion influences the small-scale intensity,was observed experimentally by Brown and Thomas[7]and Bandyopadhyay and Hussain[8].They found that a high degree of coupling exists between the high-and low-pass-filtered signals.This interaction between the turbulent structures at different scales was further investigated by Hutchins and Marusic[5]by examining both superposition and modulation effects.In their study,the effects of amplitude modulation were analyzed quantitatively using the correlation coefficient,in which the velocity fluctuations are decomposed into large-and smallscale components using a spectral filter,and the envelope of the small-scale fluctuation is obtained by applying a Hilbert transform[9].The two-point correlation map was constructed by Bernardini and Pirozzoli[10],who also presented a refined description of the top-down influence of large-scale outer events on the inner part of wall turbulence.With regards to other flow variables,Talluru et al.[11]and Agostini et al.[12]pointed out that all three velocity components and the Reynolds shear stress are modulated by the large-scale streamwise fluctuations in a similar manner.Meanwhile,by counting the number of local maxima or minima in the small-scale signal,the impact of the largescale outer motions on the frequency of the signal in the inner region was analyzed by Ganapathisubramani et al.[13].Concerning both the amplitude modulation and frequency modulation,Baars et al.[14]developed a robust tool based on wavelet analysis to quantify these two mechanisms.Based on the discovery of this interaction between inner and outer regions,the following predictive model for the inner-region turbulence fluctuations was developed[15,16]


Although the above-cited literature studies provide insight into “top-down”large-scale modulation,their connection to near-wall extreme events remains obscure.In the present study,we investigated the effects of the Reynolds number on amplitude modulation using direct numerical simulation of turbulent channel flow at friction Reynolds numberR eτ=540,1000,2000.The modulation strength was quantified using the outer–inner peak in the two-point modulation correlation map.Modulation effects were clearly discernible in the tail portion of the probability density function(PDF)and were quantitatively measured using the flatness factor.In addition,inverse flow,as a special case of a near-wall extreme event,was also proved to be closely related to the amplitude modulation.By taking the conditional average of these extreme rare events,the large-scale vortical structures related to the turbulence modulation were extracted.
2 Numerical setup and scale-separation methodology
The analysis was based on direct numerical simulation of turbulent channel flow.Simulations were carried out at three different Reynolds numbers,i.e.,R eτ=uτh/ν=540,1000,2000,wherehis the channel half-width anduτis the friction velocity.The Fourier–Galerkin method was applied in the periodic stream wise(x)and span wise(z)directions.Discretization in the wall-normal(y)direction was achieved using the Chebyshev polynomial for theR eτ=1000 case,while the seven-point compact finite difference was applied for the other two simulations.The third-order time-splitting method was used for temporal discretization.Detailed parameters of the simulations are summarized in Table 1.The computational domain spannedL x=8πhandL z=3πhfor the two lower Reynolds number cases,and 2πh×πhfor theR eτ=2000 case to save computational cost.Turbulence statistics from the present simulations were compared with published DNS channel data[30,31],showing good agreement(Fig.1).
To analyze the modulation effects,the flow signals were decomposed into large-and small-scale components by applying spectral filtering in the streamwise direction.In the present study,the streamwise wavelength separating large and small scales was chosen to be the channel half widthh.Though clear scale separation is not presented at the current Reynolds numbers up toR eτ=2000,qualitative analysis is valid regarding the influence of modulation with increasing Reynolds number.The modulation effect on wall turbulence was defined as the influence of the largescale fluctuation in the log region on the amplitude of the small-scale signals in the near-wall region.To analyze this phenomenon,the amplitude modulation coefficient proposed by Mathis et al.[9]was used here,specifically the correlation of the large-scale streamwise velocity componentuLand the low-pass-filtered envelope of the small-scale signals.The amplitude modulation correlation coefficient was calculated asR(uL,EL(uS)),where the subscripts “L”and “S”indicate large-and small-scale signals obtained by Fourier spectral filtering, and the signal envelope reflecting the amplitude strength was obtained by Hilbert transformation.

Table 1 Computational parameters

Fig.1 Root-mean-square velocity fluctuations at R eτ=540,compared with published DNS channel data(Lozano-Durán and Jiménez[30];Lee and Moser[31])
3 Results and discussion
3.1 Modulation covariance map
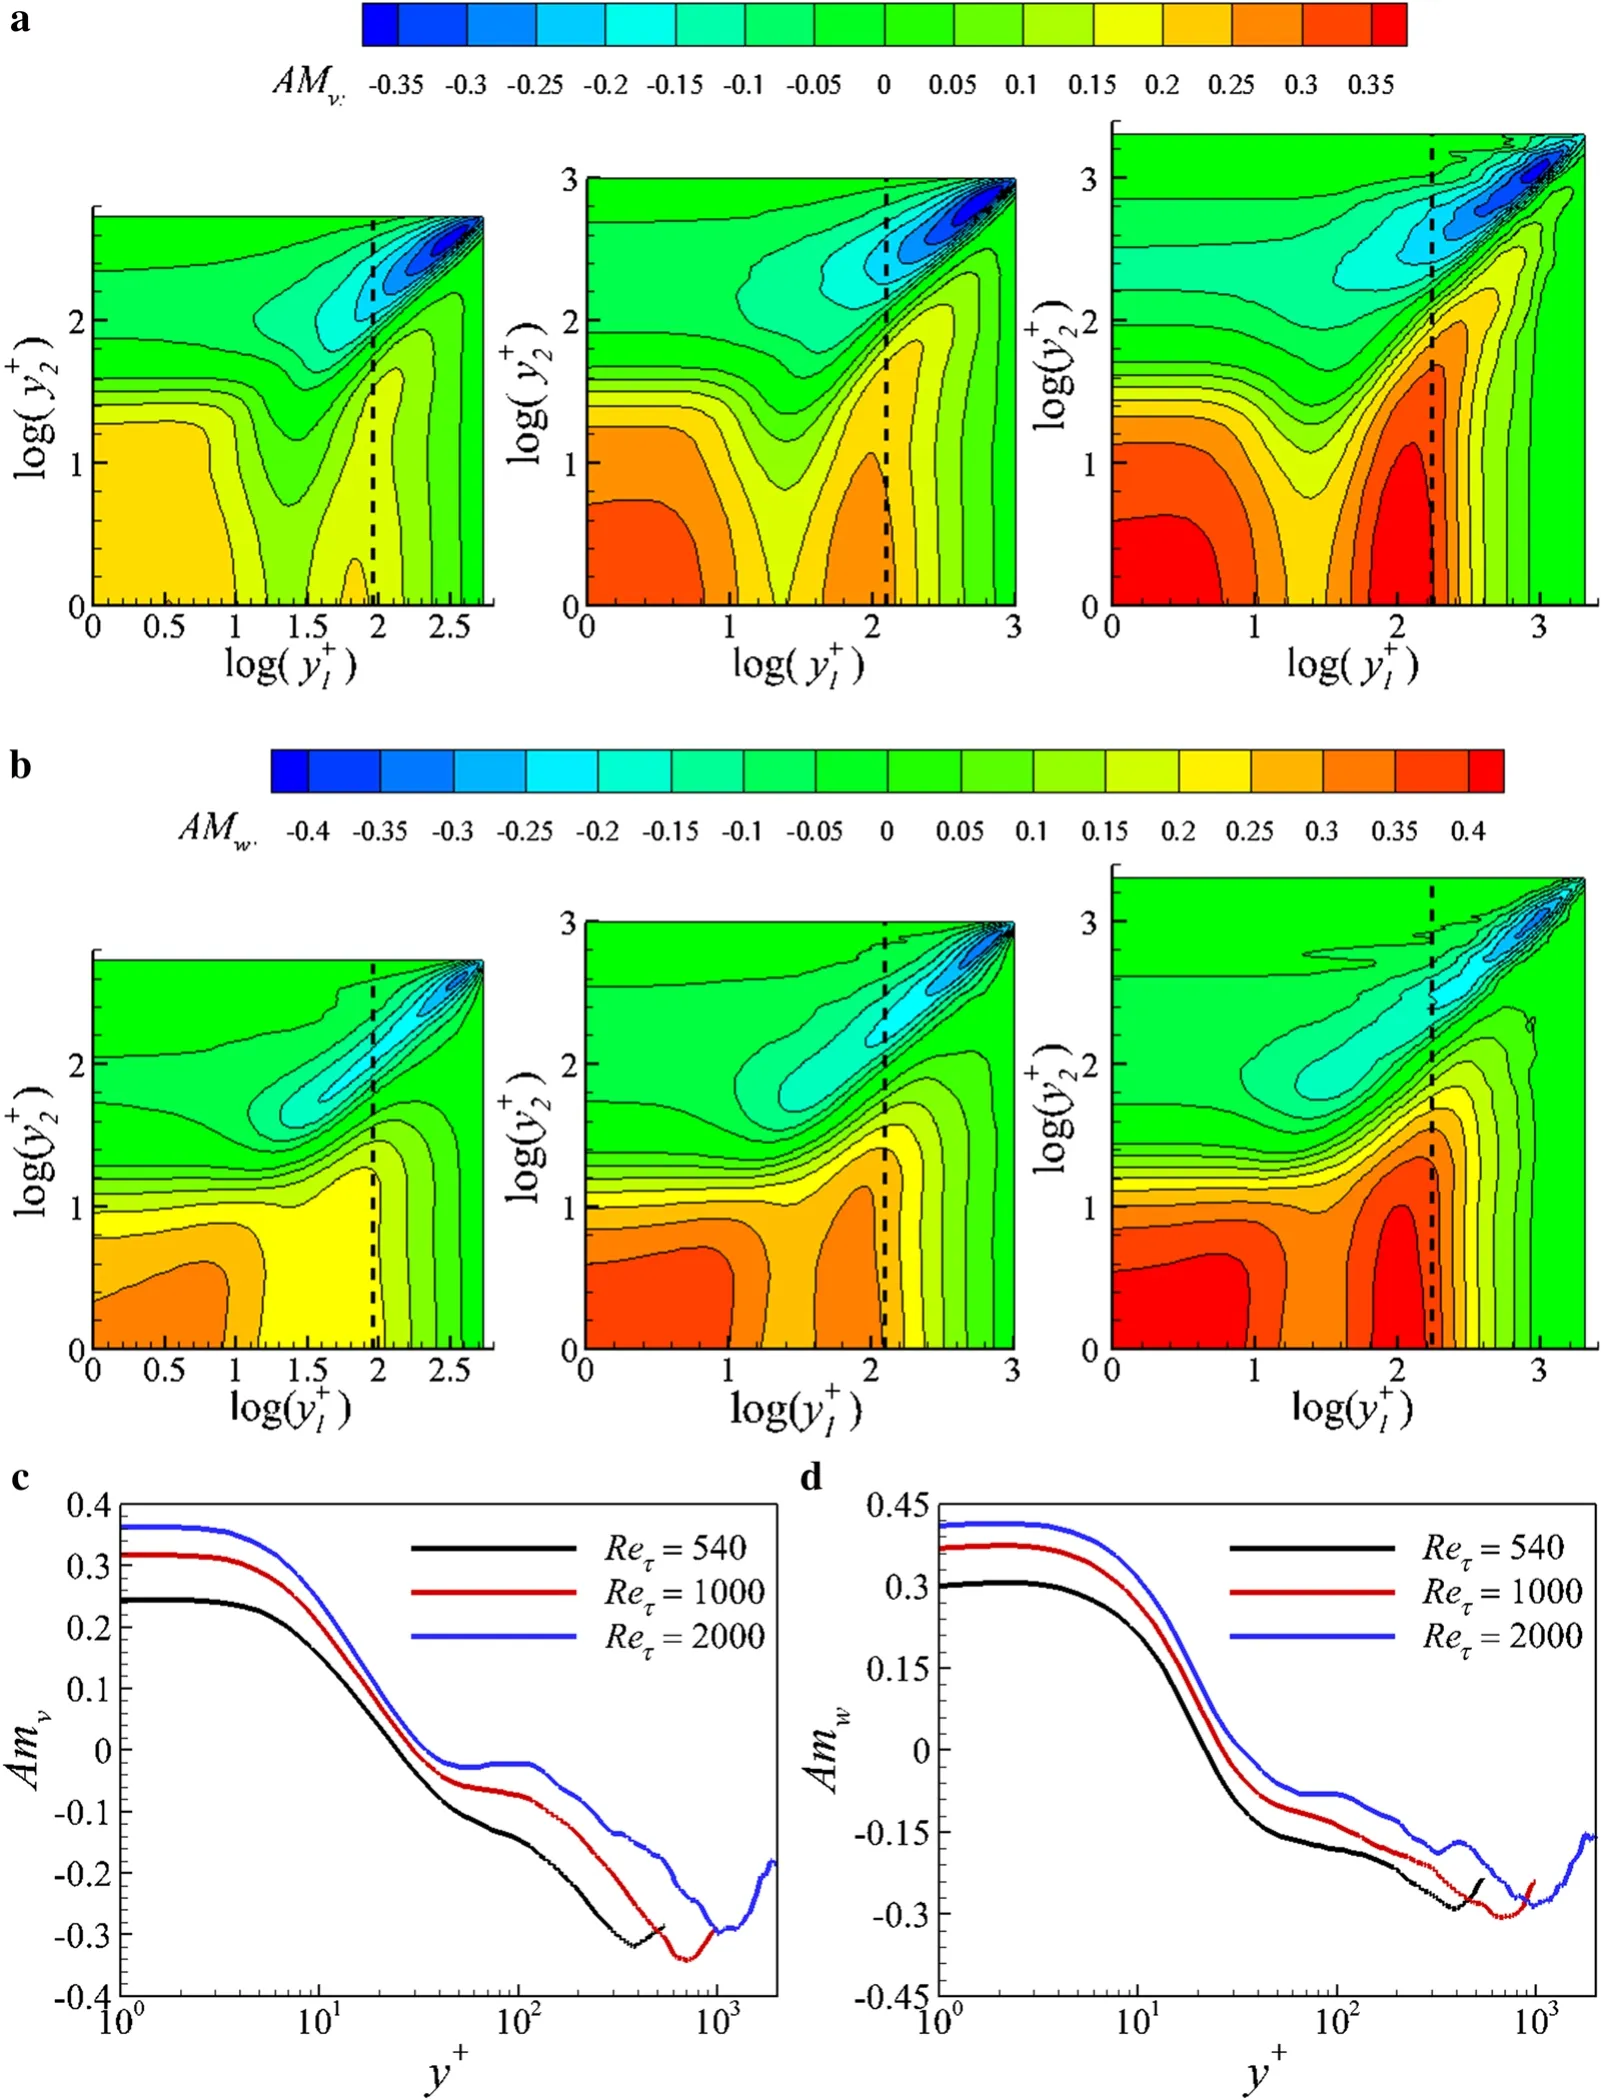
Benefiting from the complete data of the whole flow field that is available in direct numerical simulations,the two point cross-plane correlation was analyzed in the present study to investigate the outer–inner modulation relationship.The two-point amplitude modulation coefficient was defined as the correlation between the large-scale streamwise velocity at one wall-normal locationy1and the low-pass-filtered envelope of the small-scale signals at another wall-normal positiony2[10,32].Investigation of the correlation between any two wall-normal positions provides better perception of the range of influence and strength of the large-scale signal.The amplitude modulation coefficient for the velocity componentsvandwwas specified as follows


3.2 Probability density function under modulation
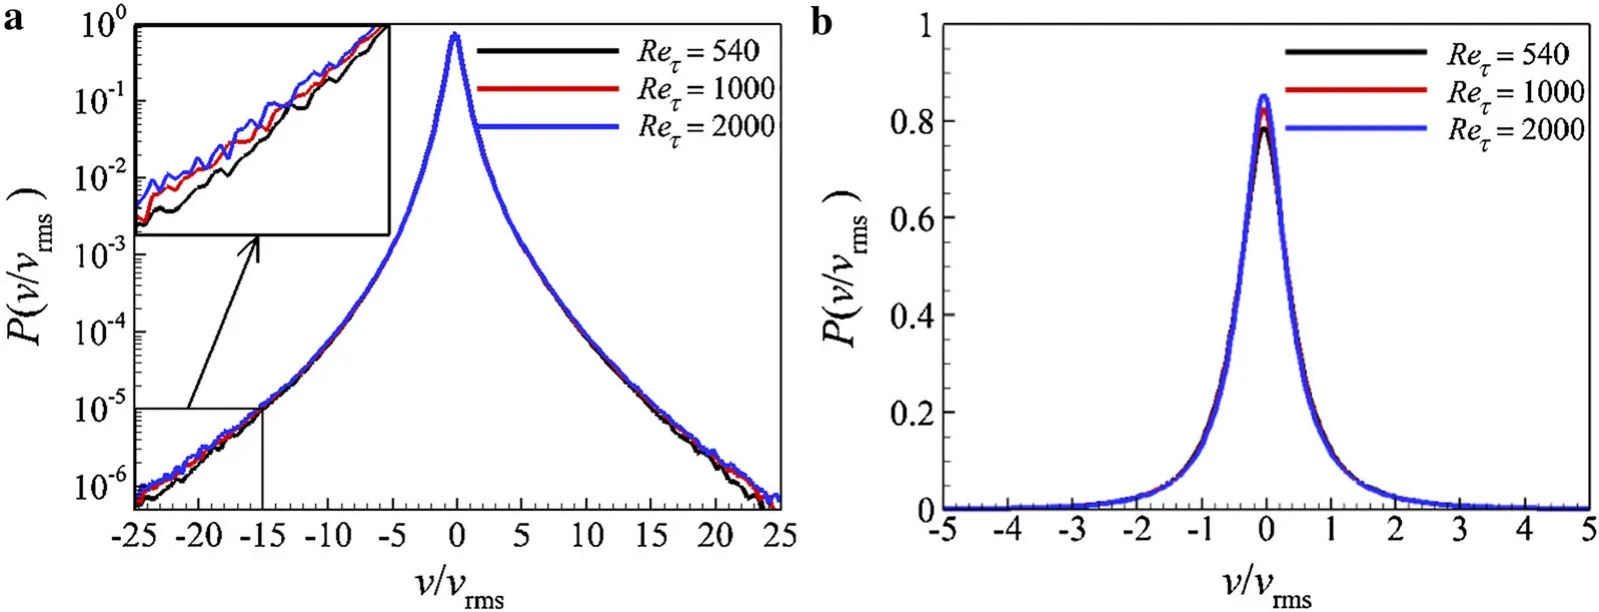
The analysis presented above based on the covariance map indicates that the modulation strength is most significant in the vicinity of the wall.In addition,the wall-normal velocityvis not expected to have a superposition contribution from the outer large-scale motions,according to its energy spectra[33].Therefore,the major influence of the outer large-scale motion on the wall-normal velocityvin the near-wall region is through amplitude modulation.Note that,if near-wall signals were not modulated by the outer large-scale structure,their PDF profiles would be independent of Reynolds number.However,as the Reynolds number increases,both the modulation coefficientβand the intensity ofuOLin Eq.(1)increase[9],therefore theβuOLterm has greater influence at higher Reynolds number.The PDF of the wall-normal velocityvaty+=1 is shown in Fig.3.For positive largescale velocityuOL>0,the universal signal is modulated by a larger fluctuation amplitude,leading to an extended tail in the PDF profile.In contrast,for negative large-scale velocityuOL<0,the PDF distribution naturally shrinks towards the center due to the attenuation of the magnitude.These phenomena are clearly seen in the PDF profile ofvin Fig.3.It is obvious that,as the Reynolds number increases,larger values occur in both the tail and center portion of the PDF distribution,while the shoulder part decreases accordingly,since the area integration under the PDF profile is unity.

Fig.2 Map of two-point cross-plane amplitude modulation coefficients a A M v and b A M w for Reynolds number R eτ=540,1000,2000 from left to right;dashed line indicates the center of the log region
For the PDF tail region,the expanded profile implies that rare events with extraordinarily high fluctuations occur.This is hardly discernible in the “universal”signal,which is stripped off the influence from the outer region.Therefore,special attention should be paid to the extreme rare events which arise in the PDF tail region.The outer positive velocity promotes the near-wall fluctuations to unprecedented high levels,thus the occurrence of these extraordinary rare events makes them a reasonable choice for studying the modulation phenomenon.

Fig.3 PDF for wall-normal velocity v normalized by root-mean-square value vrms at y+=1.a Plotted on logarithmic scale focusing on the PDF tail region.b Plotted on uniform scale focusing on PDF central region

Fig.4 Flatness of v along the wall-normal direction.a Inner scale.b Outer scale.dashed line is the flatness of the universal wall-normal velocity v∗,where v∗ is obtained from the DNS data at R eτ=180 according to the predictive model
The flatness factor is a quantitative measure of the PDF tail weight.Consequently,the high probability of extraordinary extreme events induced by modulation from the positive outer large-scale streamwise velocity naturally leads to high flatness.Figurepresents the flatness factor of the wall normal velocity at the three Reynolds numbers.In addition,the flatness of the universal signalv∗is also plotted on the same diagram.The universal signal is calculated according to the predictive model using the DNS data at the even lower Reynolds number ofR eτ=180,at which the large-scale influence marginally exists.In all the cases,the flatness of the wall-normal velocityF vreaches a very high value in the viscous sublayer and gradually decreases a way from the wall,and the flatness in the wall vicinity is mostly promoted as the Reynolds number increases,corresponding to the enhanced PDF tail seen in the inset of Fig.3a.
Considering the cross-plane relationship at two distinct wall-normal locations,the joint PDF of the large-scale outer-region streamwise velocity(uOL)and the near-wall vertical and spanwise velocity(vIandwI)is shown in Fig.5.If the signals in the vicinity of the wall are modulated in their amplitude,then there will be higher variance underneath the outer high-speed structure,with expanded joint PDF profile foruOL>0,and vice versa.The joint PDF at all three Reynolds numbers is shown in this figure,with only low-probability contours presented to focus on extreme events.The probability outside the enclosed contour line is logarithmically distributed,with probability ranging from 10−1to 10−5in ratio of 10.As revealed by the distribution of these rare events,the near-wall variance under the conditionuOL>0 is much larger than that foruOL<0,indicating that inner signals are indeed influenced by modulation from the large-scale structure.

Fig.5 Scrutiny of joint PDF to show modulation effects.The horizontal coordinate uOL represents the large-scale streamwise velocity fluctuation The vertical coordinate,a vI,and b wI,corresponds to the vertical and spanwise velocity at y+=5,respectively.Contour lines are plotted on logarithmic scale,focusing on extreme rare events,with probability outside the contour equally spaced logarithmically from 10−1 to 10−5 with ratio of 10.Contour line colors for the three Reynolds case are black for R eτ=540,red for 1000,and blue for 2000

Fig.6 Wall-normal distribution of backflow probability.a Inner scale.b Outer scale
3.3 Backflow and near-wall extreme events
Counter intuitively,reverse flows with negative streamwise velocities are observed in both turbulent boundary layer and channel flows[27,34].To investigate the Reynolds number effects on the backflow events,the wall-normal distribution of the backflow probability at the three Reynolds numbers is shown in Fig.6.The backflow probability was calculated at each vertical position,defined as the ratio of the negative velocity area and the total wall-parallel plane area.It is seen that backflow events only occur within the viscous sublayer,with highest probability adjacent to the wall,gradually decreasing to 0 wheny+>10.It is noteworthy that the inverse flow probability at wall position is less than 0.05%atR eτ=540 and increases beyond 0.07%atR eτ=2000,consistent with the findings of Lenaers et al.[26].Figure 7 provides more evidence for the relationship between the backflow and the modulation from large-scale motions based on the joint probability distribution of the streamwise velocity at different wall-normal positions.In this figure,the horizontal ordinate represents the large-scale streamwise velocity fluctuation at the center of the log regiony+=92,while the vertical coordinate corresponds to the streamwise velocity extracted at the first off-wall grid positiony+=0.04.Only extreme events are considered in the graph,with the probability outside the contour lines logarithmically equally spaced from 10−1to 10−6with ratio of 10.As the large-scale motion becomes progressively stronger with increasing Reynolds number,the modulation effect from large-scale structures also intensifies,leading to high probability of rare extreme events.It is evident that,at near-wall locations beneath the outer high-speed motion,the fluctua-tion expansion caused by modulation is more striking than the tilting contour along the first and third quadrants caused by superposition.The above discussion isin accordance with the conclusions of Lenaers et al.[26],who found based on instantaneous flow snapshots that most rare events occurred below large-scale motions with positive sign.

Fig.7 Joint PDF of u′at center log region y+=92 and u at the first off-wall grid position y+=0.04 at Reτ=540,focusing on nearwall backflow events underneath high-speed structure in the log region.Only extreme events are considered in the graph,with the probability outside the contour lines logarithmically equally spaced from 10−1 to 10−6 with ratio of 10.Backflow events are located under the horizontal dashed line
As discussed above,the influence of the modulation from positive velocity in the log region can induce extremely high fluctuation events in the near-wall region.Therefore,it is reasonable to take advantage of this mechanism to further explore the turbulence structures that are related to the inner–outer interaction by taking the conditional average of the extreme rare events.Here,we took the conditional average of the DNS data obtained atR eτ=540,while the averaged flow field was obtained on the condition of extreme velocity events at the first off-wall grid positiony+=0.04.Figurepresents the isosurface of the positive streamwise velocity fluctuationu′/Um=0.03 in this conditionally averaged flow field obtained using the criteriav>10vrms,v<−10vrms,w>7wrms,andw<−7wrms,respectively.Each of these four cases accounts for only about 0.04%of the occurrence probability on the horizontal plane,with statistical sample number of 15,000.As presented in this figure,the near-wall extreme events lie at the bottom of the high-speed large-scale structure that extends from the wall to the outer logarithmic region,and the structure inclines upward at an angle of around 13◦− 16◦in the downstream direction.The largescale structure obtained in the present study is in accordance with the conditionally averaged field obtained using zerofriction-point criteria[28],which represents a line slanting at 14◦to the streamwise direction demarcating high-and low-speed regions.Meanwhile,the present structure also conforms to the observations by Marusic and Heuer[35],who obtained a maximum modulation coefficient along the 14◦incline angle using correlation analysis.The high-speed structures extracted using these different conditional criteria are almost identical,showing no obvious distinction between the structures obtained using the imposed extreme condition with either positive or negative value,or either wall-normal orspanwise velocity components.This demonstrates that the near-wall extreme events in different velocity components are generated by a similar mechanism,with the emergence of near-wall rare events accompanied by the high-speed largescale structure above.
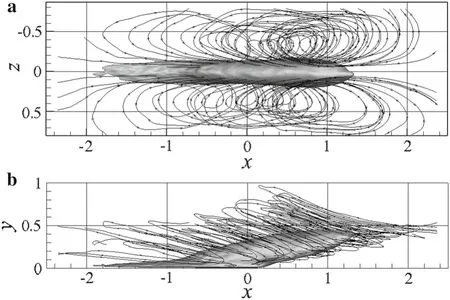
To scrutinize the modulation mechanism that the highs peed outer structure appears on top of the near-wall extreme events,we resorted to the streamlines for an explanation.Figure 9 depicts the averaged streamlines under the extreme event condition ofv>10vrmsatR eτ=540.It is clear that the emergence of the high-speed structure in the log region is induced by the sweeping motion of a pair of largescale roll cells,which carry higher-speed fluid downward and form large-scale high-speed motions.The roll cells have scales comparable to the geometric size of the channel,originating from the wall and inclining downstream,and finally extending to the central plane of the channel.In the streamwise and spanwise directions,the roll cell extends beyond 3hand 0.8h,respectively.Streamlines between the roll cells are distorted downward,impinging towards the wall and causing local wall splash.Such wall splashing generates vortices on a range of scales,and is accordingly reflected in higher fluctuation intensity at near-wall locations.This explanation validates that the modulation mechanism is indeed closely associated with large-scale circulating flow,and therefore the modulation strength intensifies with increase of the Reynolds number.

Fig.8 Isosurface of positive streamwise velocity fluctuations u′/Um = 0.03 associated with conditionally averaged near-wall extreme events.The criteria for the conditional averaging for the four figures from top to bottom are a v> 10vrms,b v< −10vrms,c w>7wrms,and d w<−7wrms,respectively,at the first near-wall grid position y+=0.04

Fig.9 Streamline associated with conditionally averaged extreme events v> 10vrms at R eτ=540.a Top view.b Side view.Isosurface represents u′/Um=0.03
4 Conclusions
Amplitude modulation is analyzed using DNS of turbulent channel flows at three different friction Reynolds numbersR eτ=540,1000,2000.Modulation strength can be quantified by the peak value in the two-point modulation correlation map,which increases with the Reynolds number.Meanwhile,modulation effects are clearly reflected in the PDF pro file as an enlargement of the center and tail portion.The extension of the PDF tail indicates that extraordinary high fluctuation events are provoked by the modulation,and such events can be measured by the flatness factor.Moreover,by taking the conditional average of these near-wallrare events,large-scale roll cells associated with modulation are revealed.Structurally,the pair of counter-rotating roll cells can induce strong sweep motions and form a high-speed region in between.Also,as shown by the streamlines,fluid at near-wall locations impinges towards the wall,leading to wall splash that promotes near-wall fluctuations.
AcknowledgementsThe work was supported by the National Natural Science Foundation of China(Grants 11490551,11472154,and 11322221).
1.Adrian,R.J.,Meinhart,C.D.,Tomkins,C.D.:Vortex organization in the outer region of the turbulent boundary layer.J.Fluid Mech.422,1–54(2000)
2.Jiménez,J.,Del Álamo,J.C.,Flores,O.:The large-scale dynamics of near-wall turbulence.J.Fluid Mech.505,179–199(2004)
3.Hutchins,N.,Marusic,I.:Evidence of very long meandering features in the logarithmic region of turbulent boundary layers.J.Fluid Mech.579,1–28(2007)
4.Abe,H.,Kawamura,H.,Choi,H.:Very large-scale structures and their effects on the wall shear-stress fluctuations in a turbulent channel flow up to Re-tau=640.J.Fluid Eng.126,835–843(2004)
5.Hutchins,N.,Marusic,I.:Large-scale influences in near-wall turbulence.Philos.Trans.R.Soc.A 365,647–664(2007)
6.Agostini,L.,Leschziner,M.A.:On the influence of outer largescale structures on near-wall turbulence in channel flow.Phys.Fluids 26,075107(2014)
7.Brown,G.L.,Thomas,A.S.:Large structure in a turbulent boundary layer.Phys.Fluids 20,S243–S252(1977)
8.Bandyopadhyay,P.R.,Hussain,A.K.M.F.:The coupling between scales in shear flows.Phys.Fluids 27,2221–2228(1984)
9.Mathis,R.,Hutchins,N.,Marusic,I.:Large-scale amplitude modulation of the small-scale structures in turbulent boundary layers.J.Fluid Mech.628,311–337(2009)
10.Bernardini,M.,Pirozzoli,S.:Inner/outer layer interactions in turbulent boundary layers:A refined measure for the large-scale amplitude modulation mechanism.Phys.Fluids23,061701(2011)
11.Talluru,K.M.,Baidya,R.,Hutchins,N.,et al.:Amplitude modulation of all three velocity components in turbulent boundary layers.J.Fluid Mech.746,690–703(2014)
12.Agostini,L.,Leschziner,M.,Gaitonde,D.:Skewness-induced asymmetric modulation of small-scale turbulence by large-scale structures.Phys.Fluids 28,015110(2016)
13.Ganapathisubramani,B.,Hutchins,N.,Monty,J.P.,et al.:Amplitude and frequency modulation in wall turbulence.J.Fluid Mech.712,61–91(2012)
14.Baars,W.J.,Talluru,K.M.,Hutchins,N.,et al..:Wavelet analysis of wall turbulence to study large-scale modulation of small scales.Exp.Fluids 56,1–15(2015)
15.Marusic,I.,Mathis,R.,Hutchins,N.:Predictive model for wallbounded turbulent flow.Science 329,193–196(2010)
16.Mathis,R.,Hutchins,N.,Marusic,I.:A predictive inner-outer model for streamwise turbulence statistics in wall-bounded flows.J.Fluid Mech.681,537–566(2011)
17.Mathis,R.,Marusic,I.,Chernyshenko,S.I.,et al.:Estimating wallshear-stress fluctuations given an outer region input.J.Fluid Mech.715,163–180(2013)
18.Chernyshenko,S.I.,Marusic,I.,Mathis,R.:Quasi-steady description of modulation effects in wall turbulence.arXiv:1203.3714.(2012)
19.Zhang,C.,Chernyshenko,S.I.:Quasisteady quasihomogeneous description of the scale interactions in near-wall turbulence.Phys.Rev.Fluids 1,014401(2016)
20.Marusic,I.,Baars,W.J.,Hutchins,N.:An extended view of the inner-outer interaction model for wall-bounded turbulence using spectral linear stochastic estimation.Proc.Eng.126,24–28(2015)
21.Inoue,M.,Mathis,R.,Marusic,I.,et al.:Inner-layer intensities for the flat-plate turbulent boundary layer combining a predictive wall-model with large-eddy simulations.Phys.Fluids 24,075102(2012)
22.Schlatter,P.,Orlu,R.:Quantifying the interaction between large and small scales in wall-bounded turbulent flows:A note of caution.Phys.Fluids 22,051704(2010)
23.Mathis,R.,Marusic,I.,Hutchins,N.,et al..:The relationship between the velocity skewness and the amplitude modulation of the small scale by the large scale in turbulent boundary layers.Phys.Fluids 23,121702(2011)
24.Duvvuri,S.,Mckeon,B.J.:Triadic scale interactions in a turbulent boundary layer.J.Fluid Mech.767,R4(2015)
25.Xu,C.,Zhang,Z.,Dentoonder,J.M.J.,et al.:Origin of high kurtosis levels in the viscous sublayer.Direct numerical simulation and experiment.Phys.Fluids 8,1938–1944(1996)
26.Lenaers,P.,Li,Q.,Brethouwer,G.,et al.:Rare backflow and extreme wall-normal velocity fluctuations in near-wall turbulence.Phys.Fluids 24,035110(2012)
27.Hu,Z.W.,Morfey,C.L.,Sandham,N.D.:Wall pressure and shear stress spectra from direct simulations of channel flow.AIAA J.44,1541–1549(2006)
28.Cardesa,J.I.,Monty,J.P.,Soria,J.,et al..:Skin-friction critical points in wall-bounded flows.J.Phys.Conf.Ser.506,012009(2014)
29.Brucker,C.:Evidence of rare backflow and skin-friction critical points in near-wall turbulence using micropillar imaging.Phys.Fluids 27,031705(2015)
30.Lozano-Durán,A.,Jiménez,J.:Effect of the computational domain on direct simulations of turbulent channels up to Re-tau=4200.Phys.Fluids 26,011702(2014)
31.Lee,M.,Moser,R.D.:Direct numerical simulation of turbulent channel flow up to Re-tau approximate to 5200.J.Fluid Mech.774,395–415(2015)
32.Eitel-Amor,G.,Örlü,R.,Schlatter,P.:Simulation and validation of a spatially evolving turbulent boundary layer up to Reθ=8300.Int.J.Heat Fluid Flow 47,57–69(2014)
33.Smits,A.J.,McKeon,B.J.,Marusic,I.:High-Reynolds number wall turbulence.Ann.Rev.Fluid Mech.43,353–375(2011)
34.Spalart,P.R.,Coleman,G.N.:Numerical study of a separation bubble with heat transfer.Eur.J.Mech.B-Fluid 16,169–189(1997)
35.Marusic,I.,Heuer,W.D.C.:Reynolds number invariance of the structure inclination angle in wall turbulence.Phys.Rev.Lett.99,114504(2007)
- Acta Mechanica Sinica的其它文章
- The influence of surface roughness on cloud cavitation flow around hydrofoils
- The influence of sub-grid scale motions on particle collision in homogeneous isotropic turbulence
- A simple algorithm to improve the performance of the WENO scheme on non-uniform grids
- Third-order polynomial model for analyzing stickup state laminated structure in flexible electronics
- A semi-analytical solution for electric double layers near an elliptical cylinder
- High-precision solution to the moving load problem using an improved spectral element method

