Solid-liquid equilibrium of dimethyl terephthalate(DMT),dimethyl isophthalate(DMI)and dimethyl phthalate(DMP)in melt crystallization process
Chunyuan Wu,Youwei Cheng*,Lijun Wang,Xi Li
Department of Chemical and Biological Engineering,Zhejiang University,Hangzhou 310027,China
1.Introduction
To achieve low energy consumption and obtain high products purity,crystallization is an important separation and purification method in the productions of aromatic acids,such as purified terephthalic acid(PTA)[1],purified isophthalic acid(PIA)[2]and 2,6-naphthalenedicarboxylic acid(NDA)[3].Several crystallization methods,such as crystallization in water[4]and organic solvents[5],adductive crystallization[3,6]have been investigated previously.However,these methods cannot be employed to separate PTA residue,one complicated aromatic acid mixture residue,which contains isophthalic acid(IPA),terephthalic acid(TA),benzoic acid(BA),p-toluic acid(PT)and trimellitic acid(TMA).Recently,a new method combining methyl esterification with melt crystallization[7,8]was proposed to deal with this complex mixture.By methyl esterification[9,10],all these aromatic acid components could be transferred into relevant methyl esters and mixed dimethyl esters of benzene dicarboxylic acid could be recovered by vacuumdistillation.This dimethyl ester mixture includes Dimethyl Terephthalate(DMT),Dimethyl Isophthalate(DMI)and Dimethyl Phthalate(DMP).For their similar boiling points,DMT,DMI and DMP could not be further separated by rectification.According to their different melting points,a novel melt crystallization method was proposed to separate these three isomers.Large-scale melt crystallization has been applied to separate C8 aromatics in p-xylene production with low energy consumption and high product purity[11-13].To separate DMT,DMI and DMP efficiently,melt crystallization may be a better choice than solution crystallization[14,15],because high purity of DMT,DMI is required in polyester industry.In this work,the solid-liquid equilibrium[16]of DMT/DMI,DMT/DMP and DMI/DMP was investigated by phase equilibrium experiments,DSC analysis[17]and phase equilibrium model,and the results mightbe useful for the development and application of the melt crystallization process.
2.Experimental
2.1.Materials
Dimethyl Terephthalate(DMT),Dimethyl Isophthalate(DMI)and Dimethyl Phthalate(DMP)were all supplied by Shanghai Aladdin-Reagent Technology Co.Ltd.(China).The mass faction purity of these three products was checked by high performance liquid chromatography(HPLC).The mass fraction of DMT,DMI and DMP was 99.82%,99.89%and 99.53%,respectively.
2.2.Apparatus and procedure
Solid-liquid phase equilibrium data were first measured by equilibrium experiments.Firstly,different samples were melted in a test tube and cooled to a specific equilibrium temperature in a high precision thermostatic bath.According to different equilibrium temperature,the bath medium was one of oil(>363.1 K),water(313.1-363.1 K)and ethyl alcohol(<313.1 K).After 2 h in the thermostatic bath,the liquid phase was sampled by an aspirating needle and measured by HPLC.
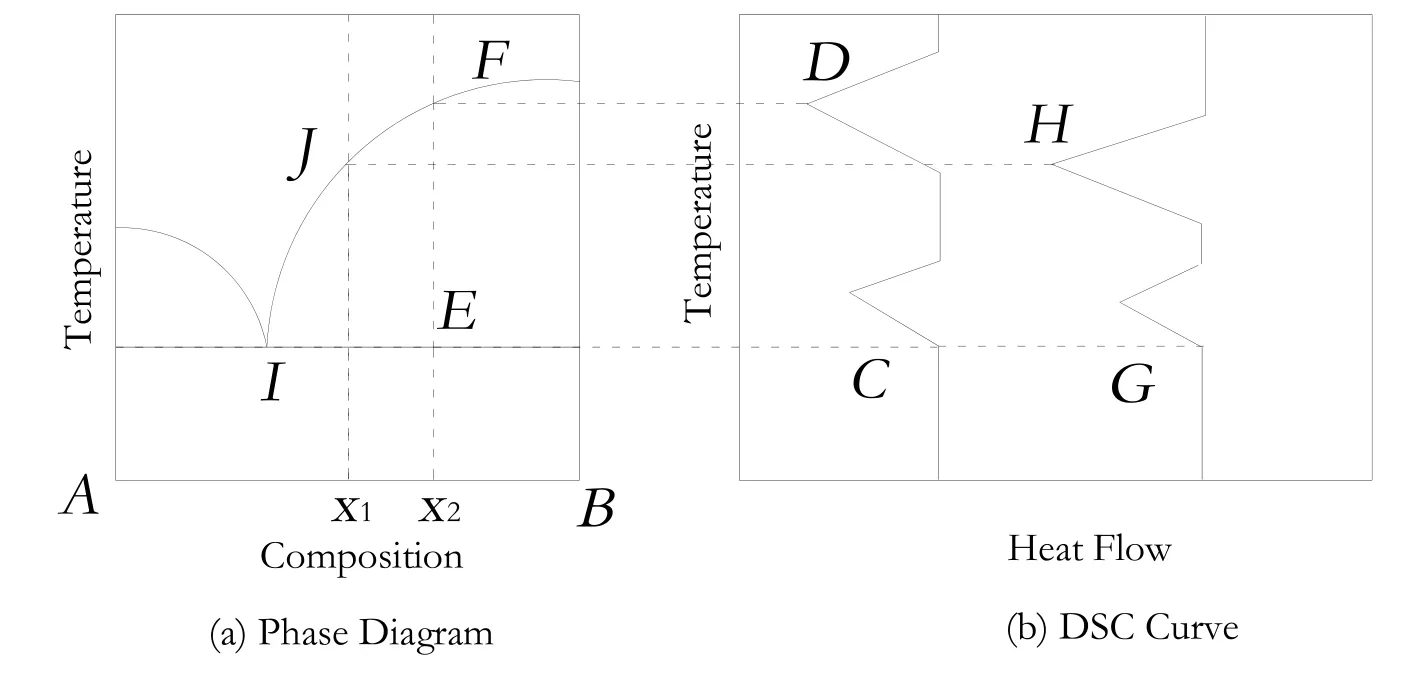
Fig.1.The relationship between DSC curves and phase diagrams of eutectic systems.
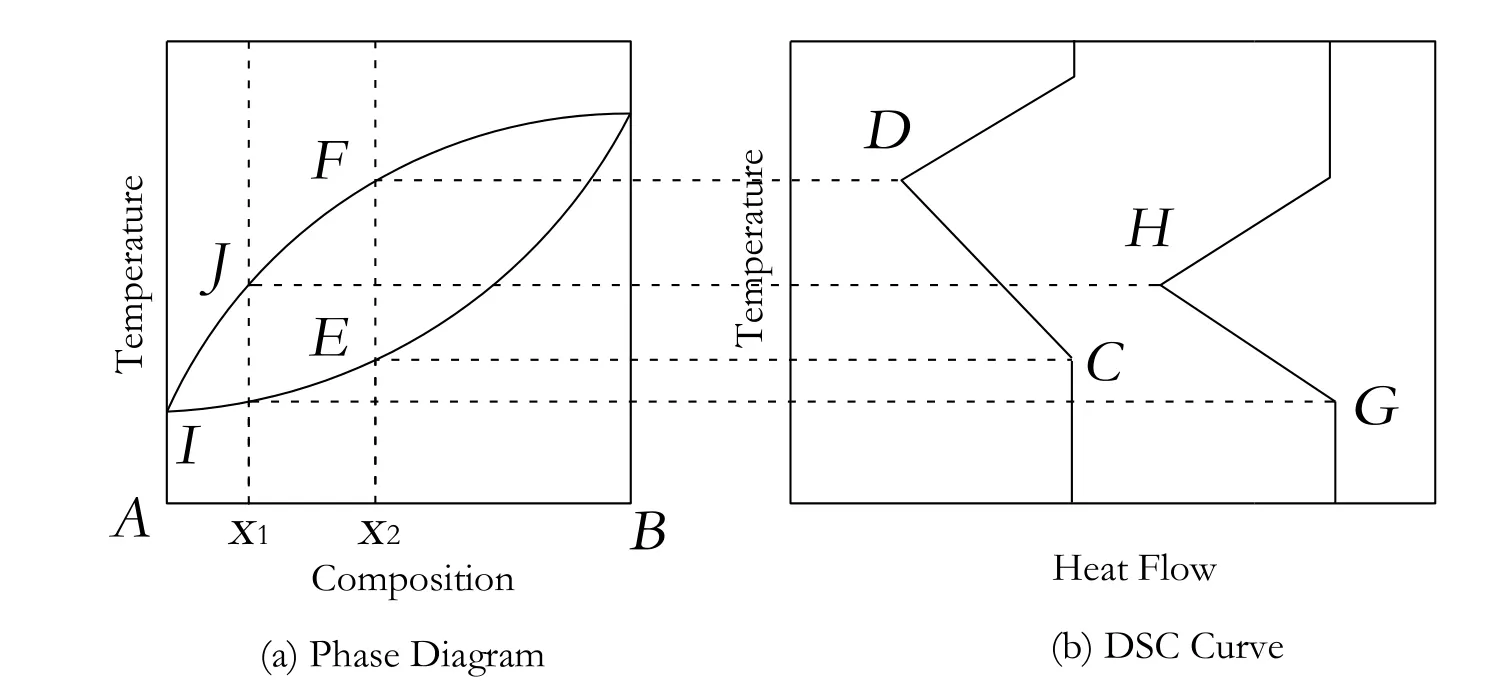
Fig.2.The relationship between DSC curves and phase diagram of solid-solution systems.
Furthermore,the detailed solid-liquid phase equilibrium was investigated by differential scanning calorimetry(DSC,American Perkin-Elmer Company,PE-DCS-7).According to the DSC curves,we could conclude the solid-liquid equilibriumtype of different mixtures and predict the phase diagram[18]of different systems.Typically,there are two absorption peaks in DSC curves of mixture samples for the eutectic systems unless the composition of the sample is just the eutectic composition.Fig.1 illustrated the relationship between phase diagrams and DSC curves in eutectic systems.
When the mixture of A and B at the composition of x1was heated,the liquid phase first appeared at the point of I.The temperature was the onset temperature of the first peak(G).The solid phase would disappear at the point of J.The temperature was the peak temperature of the second peak(H).The temperature of C and G was the same for different curves,which could be defined as the onset temperature of the eutectic system.
For the solid-solution systems,there was only one absorption peak in a DSC curve and the onset temperature of every DSC curve was not constant.Fig.2 denoted the relationship between phase diagrams and DSC curves in solid-solution systems.
When the mixture of A and B at the composition of x1was heated,the liquid phase first appeared at the point of I.The temperature was the onset temperature(G).Then the solid phase disappeared at the point of J,the temperature of which was the peak temperature(H).The onset temperature of DSC curves is different in solid-solution systems.
Different samples in different compositions of DMT/DMI,DMT/DMP and DMI/DMP were prepared and DSC analysis was carried out.The compositions of the samples were listed in Table 1.During DSC analysis,each sample(6 to 7 mg)was weighed in a micro-analytical balance and sealed in an aluminum pan.Then,the sample was cooled to the specific low temperature(273.2 K for the mixture of DMT/DMI and 223.2 K for the mixtures of DMT/DMP and DMI/DMP)from the room temperature.The samples were maintained at the low specific temperature for 10 min and then heated to 453.2 K at the rate of 10 K·min-1.After 3 min,the samples were cooled to the specific low temperature again at the rate of 10 K·min-1.The DSC curves were recorded and shown in Figs.3-5.

Table 1 The composition of different mixture samples
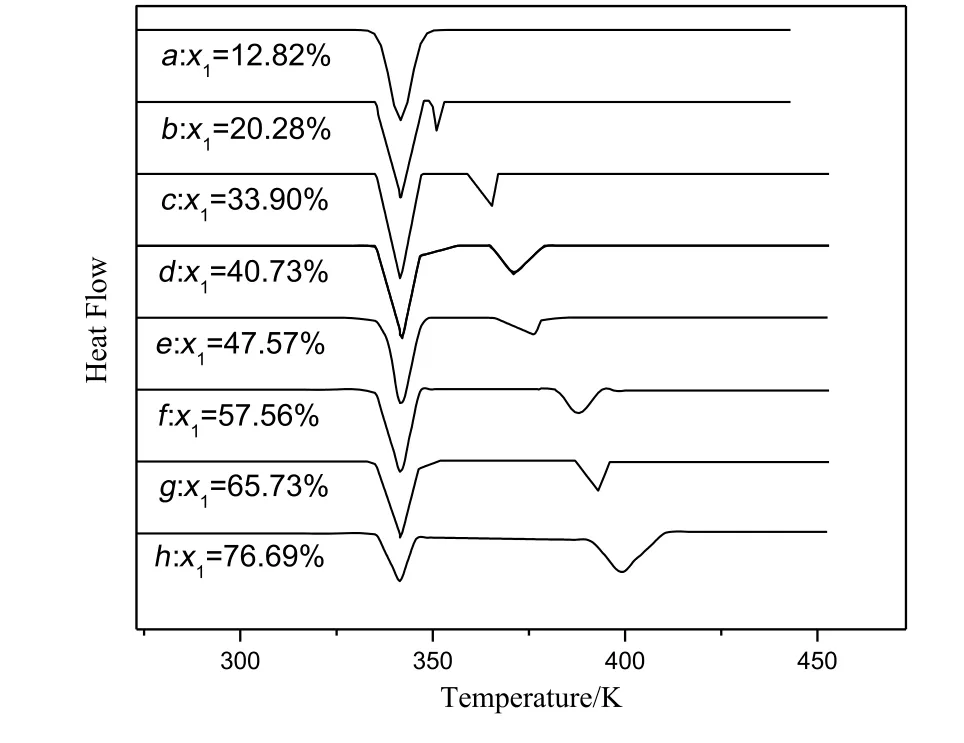
Fig.3.Differential thermal curves for the system of DMT(1)and DMI(2).
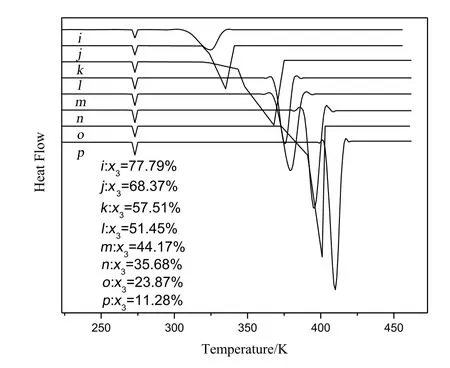
Fig.4.Differential thermal curves for the system of DMT(1)and DMP(3).
3.Calculation Model

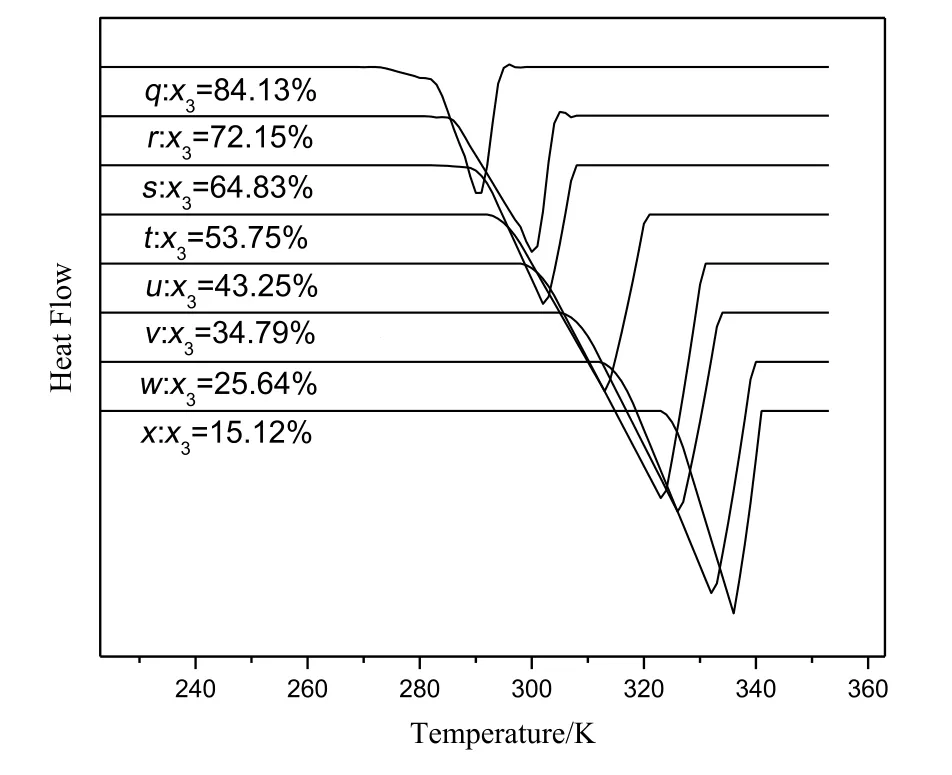
Fig.5.Differential thermal curves for the system of DMI(2)and DMP(3).
The mathematics model[19,20]for the solid-liquid phase equilibrium of the eutectic system could be described by Eq.(1):where xiis the mole fraction of component i;γiis the activity coefficient in liquid phase.ΔCpis the difference between the heat capacity of the liquid and solid phase.Ttpand Ptpis the triple-point temperature and pressure,respectively.ΔHtpis the enthalpy change of the system at the triple point.ΔV is the difference between the volume of the liquid and solid phase.R is the universal gas constant.
At atmospheric pressure,the difference between the volume of the liquid and solid phase at the normal pressure is insignificant,so the last term involving ΔV could be neglected.As the latent heat of melting is much higher than the sensible heat,the second term involving ΔCpcould be neglected compared with that of ΔHm,i.The liquid mixture can be regarded as ideal solution,lnγi=0.Considering temperature at the triple-point is difficult to measure and extremely similar to the melting temperature at normal atmosphere,the enthalpy change and temperature at the triple-point could be estimated with the fusion enthalpy change and fusion temperature at normal atmosphere.Therefore,Eq.(1)could be simplified to Eq.(2),by which the solid-liquid phase equilibriumcould be calculated from the available ΔHm,iand Tm,i.

4.Results and Discussion
4.1.Solid-liquid phase equilibrium experiments
The initial composition,equilibrium liquid phase composition and equilibrium temperature were listed in Tables 2,3 and 4.
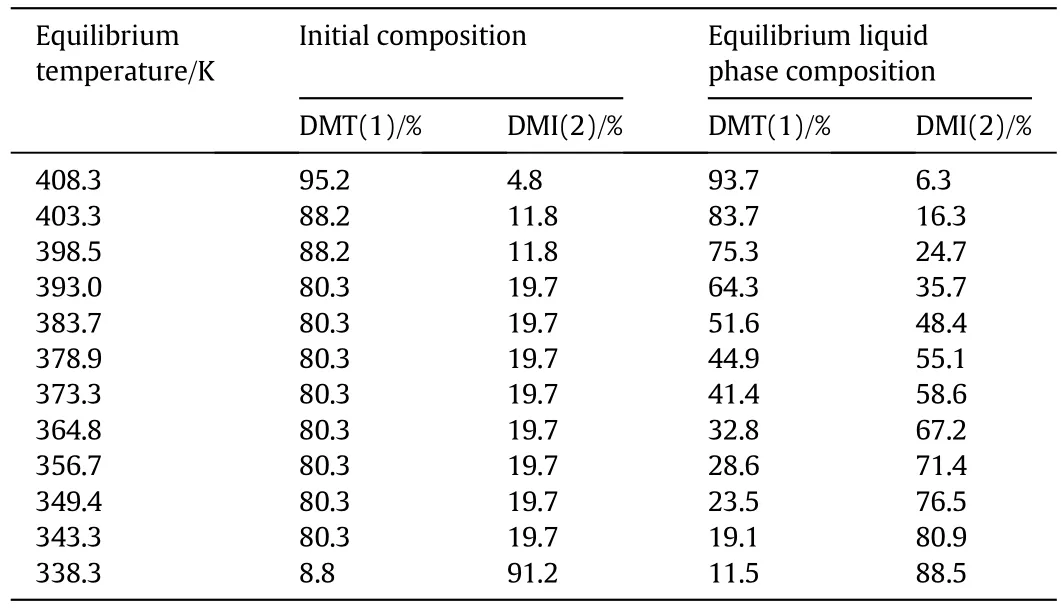
Table 2 Solid-liquid equilibrium data for binary mixture of DMT(1)and DMI(2)at different equilibrium temperature
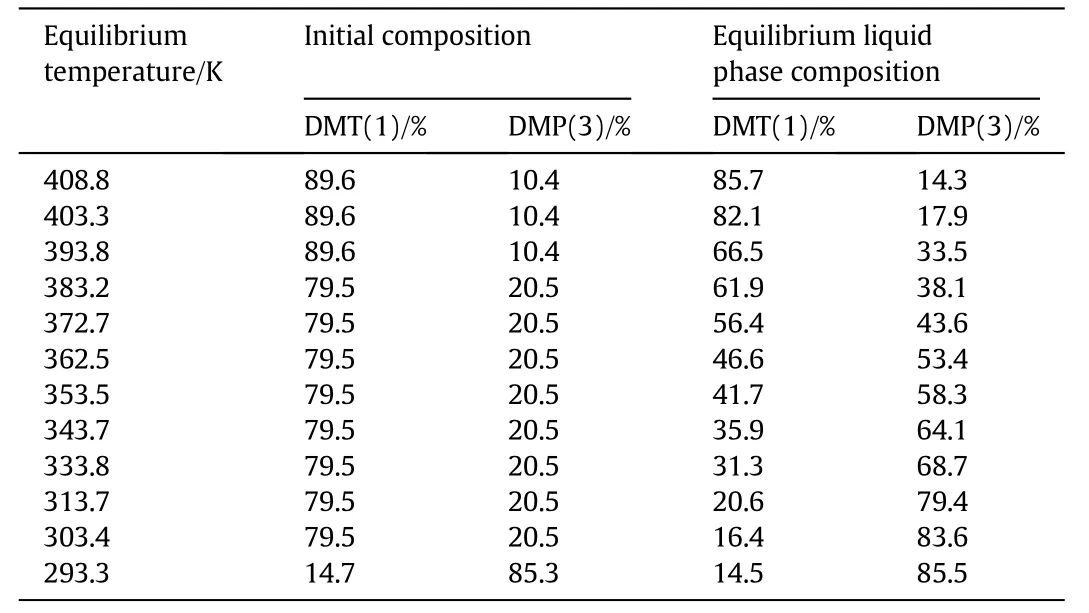
Table 3 Solid-liquid equilibrium data for binary mixture of DMT(1)and DMP(3)atdifferent equilibrium temperature

Table 4 Solid-liquid equilibrium data for binary mixture of DMI(2)and DMP(3)at different equilibrium temperature
From the equilibrium liquid phase composition above,although the accurate binary phase diagram cannot be concluded,these data would be the fund a mental in formation for the DSC research and phase equilibrium model.
4.2.DSC research results
The DSC curves were recorded and the results were presented in the following figures.
Fig.3 showed the onset temperature of DMT/DMI system was the same with the change of composition of mixtures,so this system was a eutectic system and the eutectic temperature was about 336.7 K.The eutectic composition was near 12.8 wt%for DMT and 87.2 wt%for DMI.
Fig.4 demonstrated the system of DMT/DMP was similar to DMT/DMI system.The eutectic temperature of this system was about 271.2 K and the eutectic composition was near 93 wt%for DMP and 7 wt%for DMT.
Differently,Fig.5 showed the onset temperature of system was different with the change of composition of mixtures,so the mixture of DMT and DMP was the solid-solution system.
4.3.Phase equilibrium model parameters
According to the eutectic temperature and composition from the experiment and DSC data,ΔHm,icould be calculated.The comparison between the calculated parameters and reference ones was shown in Table 5.
It denoted that the error between the calculated parameters and reference ones was less than±3%.The calculatedΔHm,iof DMP can also be applied to the solid-liquid equilibrium model.According to the reference parameters,it can be calculated that the eutectic temperature of the system of DMT and DMI is 337.0 K and the eutectic composition is 12.3 wt%for DMT and 87.7 wt%for DMI.
Results showed that the simplified solid-liquid equilibrium model could be used to predict the phase diagram of eutectic systems properly if the parameters of ΔHm,iand Tm,iare available.The reference ΔHm,iof DMP was unknown,but it could be concluded that the calculated ΔHm,ifrom experiment and DSC data was also reliable.The phase diagrams of DMT/DMP(Fig.6)and DMI/DMP(Fig.7)were drawn according to the experiment and DSC data.

Table 5 The model parameters
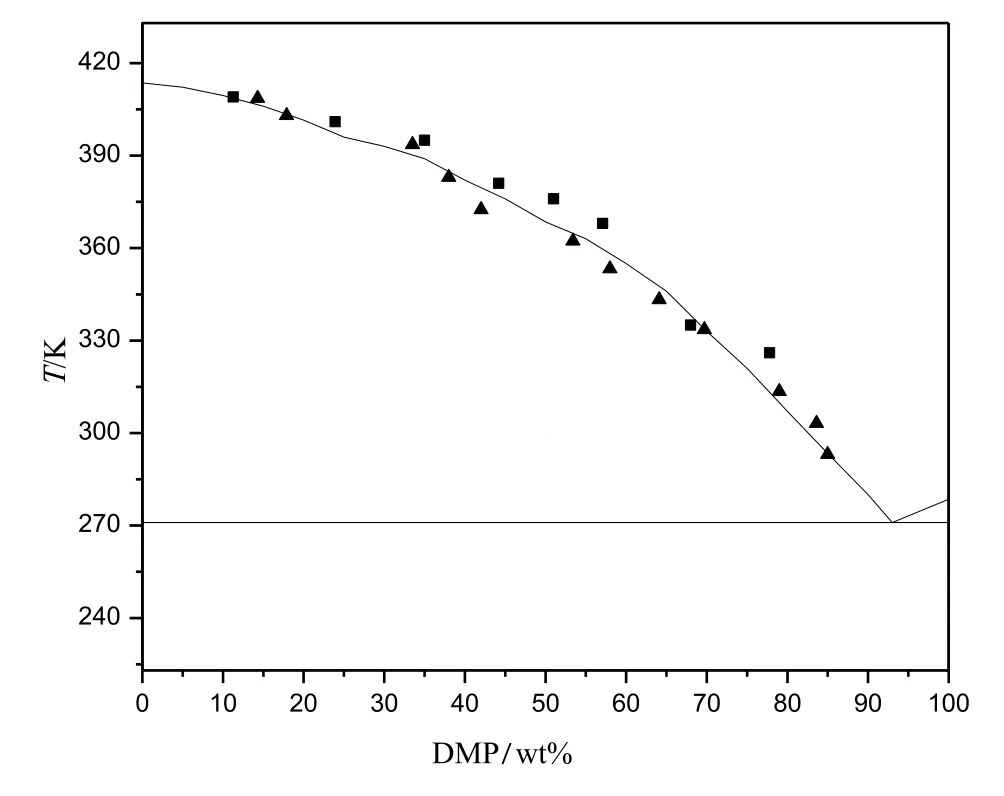
Fig.6.The phase equilibrium diagram of DMT/DMP according to the DSC analysis and experiment data:■,data form DSC;▲,experiment data.
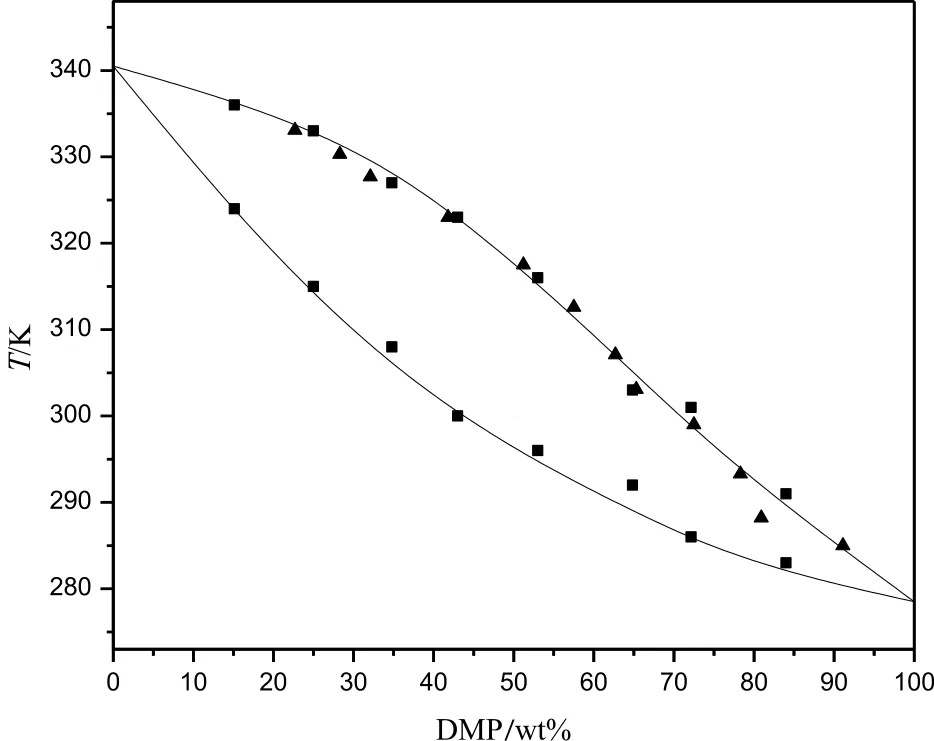
Fig.7.The phase equilibrium diagram of DMI/DMP according to the DSC analysis and experiment data:■,data form DSC;▲,experiment data.
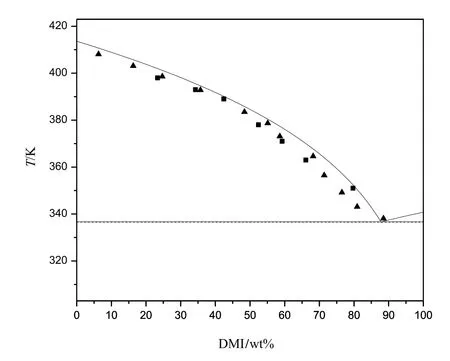
Fig.8.The calculated phase diagram of DMT/DMI and the experiment and DSC data:—,calculated curve;■,data form DSC;▲,experiment data.
4.4.The binary solid-liquid phase diagrams
According to DSC and experimental results,the phase diagrams of DMT/DMI,DMT/DMP and DMI/DMP were drawn in Figs.6-8.
5.Conclusions
The binary solid-liquid equilibrium of DMT,DMI and DMP was investigated by experiment and DSC.The result showed the systems of DMT/DMI and DMT/DMP were eutectic while the system of DMI/DMP was solid-solution.The eutectic temperature of DMT/DMI and DMT/DMP system was 336.7 Kand 271.2 K,respectively.The eutectic composition of DMT/DMI system was 12.8 wt%for DMT and 87.2 wt%for DMI and that of DMT/DMP system was 7 wt%for DMT and 93 wt%for DMP.
Phase equilibrium model was used to calculate the phase diagram of the eutectic system.The model parameters could be calculated according to the experiment and DSC data and the calculated parameters were close to the reference ones.The simplified model could be used to guide the research of solid-liquid equilibrium of a eutectic system.
The research on the solid-liquid equilibrium of DMT,DMI and DMP is meaningful to the study of purification of DMT and DMI by melt crystallization process.It is also necessary to the method for methyl esterification recovery and recycle of PTA oxidation residue.
[1]Q.Wang,H.Xu,X.Li,Solubilities of terephthalic acid in dimethyl sulfoxide+water and in N,N-dimethyl for mamide+water from(301.4 to 373.7)K,J.Chem.Eng.Data 50(2005)719-721.
[2]Y.W.Cheng,L.Huo,X.Li,Solubilities of is ophthalic acid in acetic acid plus water solvent mixtures,Chin.J.Chem.Eng.21(2013)754-758.
[3]B.H.Wu,Y.W.Cheng,X.Li,Thermodynamic properties and crystal structures of the adductive 2,6-naphtha lenedicar boxylic acid crystallization with N,N-dimethyl acetamide and N-methyl pyrrolidone,J.Chem.Eng.Data 57(2012)406-411.
[4]X.Z.Xu,Y.D.Hu,L.Y.Wu,C.Xia,A new model in correlating and calculating the solid-liquid equilibrium of salt-water systems,Chin.J.Chem.Eng.24(2016)1056-1064.
[5]Q.Z.Jia,P.S.Ma,S.N.Ma,C.Wang,Solid-liquid equilibria of benzoic acid derivatives in 1-octanol,Chin.J.Chem.Eng.15(5)(2007)710-714.
[6]Y.W.Cheng,G.Peng,B.H.Wu,Thermodynamic study on the adduct crystallization of terephthalic acid with amides,J.Chem.Eng.Data 56(2011)1020-1024.
[7]S.Cong,Y.Liu,H.Li,X.G.Li,L.H.Zhang,L.Wang,Purification and separation of durene by static melt crystallization,Chin.J.Chem.Eng.23(2015)505-509.
[8]S.Cong,X.G.Li,J.Wu,C.C.Xu,Optimization of parameters for melt crystallization of p-cresol,Chin.J.Chem.Eng.20(4)(2012)649-653.
[9]Cheng,Y.W.,Wu,C.Y.,Xu,X.W.,“Recovery of terephthalate,is ophthalate and phthalate from PTA residue by methyl esterification method”,China Pat.,CN105017022A(2015).
[10]Cheng,Y.W.,Wu,C.Y.,Xu,X.W.,“Separation of dimethyl terephthalate,isophthalate and phthalate mixture by crystallization method”,China Pat.,CN105017023A(2015).
[11]X.B.Jiang,M.Li,G.H.He,Research progress and model development of crystal layer growth and impurity distribution in layer melt crystallization:a review,Ind.Eng.Chem.Res.53(2014)13211-13227.
[12]X.B.Jiang,B.H.Hou,Y.Y.Zhao,Kinetics study on the liquid entrapment and melt transport of static and falling- film melt crystallization,Ind.Eng.Chem.Res.51(2012)5037-5044.
[13]U.Joachim,Is melt crystallization a green technology?Cryst.Growth Des.4(5)(2004)879-880.
[14]L.Zhou,Z.Wang,M.J.Zhang,M.X.Guo,Determination of metastable zone and induction time of analgin for cooling crystallization,Chin.J.Chem.Eng 25(2017)313-318.
[15]J.J.Liu,C.Y.Ma,X.Z.Wang,Imaging protein crystal growth behavior in batch cooling crystallization,Chin.J.Chem.Eng.24(2016)101-108.
[16]A.D.Boros,L.S.Batista,J.A.P.Coutinho,Binary mixtures of fatty acid ethyl esters:solid-liquid equilibrium,Fluid Phase Equilib.427(2016)1-8.
[17]B.Z.Li,T.Truong,B.Bhandari,Crystallization and melting properties of mixtures of milk fat stearin and omega-3 rich oils,Food Chem.218(2007)199-206.
[18]W.Shen,Y.S.Ren,J.J.Sun,Solid-liquid phase equilibrium and phase diagram for the reciprocal quaternary system,Fluid Phase Equilib.429(2016)196-204.
[19]M.C.Tatiana,A.F.Camilo,A novel solid-liquid equilibrium model for describing the adsorption of associating asphaltene molecules onto solid surfaces based on the chemical theory,Energy Fuel 28(2014)4963-4975.
[20]H.L.Jan,J.P.Willem,V.Elias,Metastable states in multicomponent liquid-solid system:a kinetic crystallization model,J.Phys.Chem.B 106(2002)7321-7330.
[21]W.V.Steele,R.D.Chirico,S.E.Knipmeyer,Vapor pressure,heat capacity and density along the saturation line,measurements for dimethyl isophthalate,dimethyl carbonate,1,3,5-trithylbenzene,pent afluorophenol,4-tert-butylcatechol,methylstyrene and N,N-bis(2-hydroxyethyl)ethylenediamine,J.Chem.Eng.Data 42(1997)1008-1020.
[22]H.John,M.Elliott,Some thermodynamic properties of high purity dimethyl terephthalate,J.Chem.Eng.Data 13(1968)475-480.
 Chinese Journal of Chemical Engineering2017年12期
- Chinese Journal of Chemical Engineering的其它文章
- Transport properties of dilute ammonia-noble gas mixtures from new intermolecular potential energy functions
- Analogy between adsorption and sorption:An elementary mechanistic approach.I.Monolayer adsorption and sorption without solvent cluster formation
- Permeation properties of CO2 and CH4 in asymmetric polyethersulfone/polyesterurethane and polyethersulfone/polyetherurethane blend membranes
- An efficient green route for hexamethylene-1,6-diisocyanate synthesis by thermal decomposition of hexamethylene-1,6-dicarbamate over Co3O4/ZSM-5 catalyst:An indirect utilization of CO2☆
- Pt-H2SO4/Zr-mont morillonite:An efficient catalyst for the polymerization of octamethylcy-clotetrasiloxane,poly methylhydrosiloxane and hexamethyldisiloxane to low-hydro silicone oil☆
- Research progress in the SO2 resistance of the catalysts for selective catalytic reduction of NO x☆
