基于定位像的自动管电压选择技术与常规固定管电压技术在胰腺实性病变成像中的比较
2017-03-15 11:44:51薛华丹孙照勇金征宇
中国医学科学院学报 2017年1期
徐 凯,朱 亮,薛华丹,李 平,孙照勇,杜 瑶,王 沄,金征宇
中国医学科学院 北京协和医学院 北京协和医院放射科,北京 100730
·Force CT专栏 论著·
基于定位像的自动管电压选择技术与常规固定管电压技术在胰腺实性病变成像中的比较
徐 凯,朱 亮,薛华丹,李 平,孙照勇,杜 瑶,王 沄,金征宇
中国医学科学院 北京协和医学院 北京协和医院放射科,北京 100730
目的比较基于定位像的自动管电压选择技术和固定管电压技术在胰腺实性病变成像中的图像质量和辐射剂量。方法回顾性分析2014年1月至2016年8月在北京协和医院就诊经术后病理证实为胰腺实性病变并行术前双源CT检查的113例患者的临床资料,其中,接受固定管电压(120 kV)和管电流可调扫描患者53例(组1),接受管电压(管电压分档:90、100 kV)和管电流自动调节扫描患者60例(组2)。由2名经验丰富的放射科医生共同测量患者腹围,评估动脉期和门脉期图像的主观图像质量评分及客观图像质量参数,并记录扫描的剂量参数。结果组2的60例患者中,有45例接受90 kV扫描,15例接受100 kV扫描;90 kV 组患者的平均腹围为(287±24)mm,明显低于100 kV 组的(328±22)mm (t=0.731,P=0.0008)。组2的平均CT容积剂量指数为(3.9±1.0)mGy,较组1的(9.0±1.9)mGy降低了56.7%(t=17.5,P=0.0003);平均剂量长度乘积为(109±38)mGy·cm,较组1的(276±83)mGy·cm降低了60.5%(t=14.0,P=0.0007)。组2动脉期及门脉期图像的背景噪声标准差分别为(6.4±0.9)和(6.4±1.0)HU,均明显高于组1的(5.6±1.4)(t=-3.757,P=0.0003)和(5.5±1.4)HU(t=-3.828,P=0.0006)。组2动脉期的胰腺病灶、腹主动脉和门脉期的胰腺病灶、门静脉主干的信噪比分别为18.8±9.3、76.0±19.3和17.4±6.7、33.1±7.2,均明显高于组1的13.1±8.7(t=-3.379,P=0.001)、56.5±22.6(t=-2.268,P=0.025)和14.1±8.1(t=-2.283,P=0.024)、28.9±8.8(t=-2.613,P=0.009)。结论基于定位像的第3代双源CT自动管电压选择技术应用于胰腺实性病变时,可减低辐射剂量,而图像质量与第2代双源CT固定管电压技术大致相当。
第3代双源CT;胰腺实性病变;自动管电压选择技术;固定管电压技术;图像质量;辐射
ActaAcadMedSin,2017,39(1):88-94
胰腺实性病变多种多样,包括胰腺癌、胰腺神经内分泌肿瘤、实性假乳头状瘤、胰母细胞瘤、胰腺淋巴瘤、转移瘤、肿块性胰腺炎(自身免疫性胰腺炎、局灶性慢性胰腺炎)等[1]。胰腺癌是胰腺最常见的恶性肿瘤,近年发病率明显上升,预测至2030年将成为第2位的致死性肿瘤。因此,早期检出、早期诊断对胰腺癌患者的预后可发挥重要作用[2],而良好的影像学图像对胰腺病变的检出至关重要。随着近20年影像诊断技术的不断进步,CT在疾病的检出、分期及临床决策中发挥了越来越重要的作用[3]。然而,随着CT的应用,关于辐射剂量所致的健康问题也随之被提出,某些癌症发病率与辐射剂量可能存在潜在的关系[4],这就要求我们在保证图像质量的前提下尽量降低辐射剂量。目前有多种降低辐射剂量的CT技术,如:X射线束准直、过滤、自动管电流调节(automatic tube current modulation,ATCM)、低管电压技术[5],其中,低管电压技术在降低辐射剂量方面优势显著,但其图像质量难以获得保证,近期出现的自动管电压选择(automatic tube voltage selection,ATVS)技术则解决了这一难题[6- 7]。ATVS是根据患者体形及扫描目的自动调节管电压,选择最优的管电压,并对管电流进行相关补偿,可以在降低辐射剂量的同时保证图像质量[8- 9]。本研究比较了基于定位像的ATVS和固定管电压技术在第3代双源CT胰腺实性病变成像中的图像质量和辐射剂量,明确了ATVS在胰腺实性病变中的临床应用价值,以期为今后的临床应用提供参考。
资料和方法
资料来源1名经验丰富的放射科医师回顾性连续收集2014年1月至2016年8月在北京协和医院就诊经术后病理证实为胰腺实性病变(胰腺癌及胰腺神经内分泌肿瘤)的患者152例,其中,行术前CT检查患者118例,包括接受接受固定管电压(120 kV)和管电流可调扫描患者55例,管电压和管电流自动调节扫描患者63例。排除病理为胰腺实性肿瘤而CT表现以囊性成分为主的患者(囊性成分≥75%)5例。共入组113例患者,其中,接受固定管电压(120 kV)和管电流可调扫描患者53例(组1:胰腺癌35例,胰腺神经内分泌肿瘤18例),接受管电压和管电流自动调节扫描患者60例(组2:胰腺癌34例,胰腺神经内分泌肿瘤26例)(图1)。
CT扫描方法组2的60例患者接受第3代双源CT(SOMATOM Definition Force;Siemens Healthcare,Forchheim,Germany)扫描,扫描的标准化参数是参考管电压120 kV,参考管电流110 mA;采用CARE kV技术,即管电压根据定位相自动调节(分为80、90、100、110 kV档),管电流自动调节;螺距0.6,探测器准直192×0.6 mm,重建层厚5 mm,Kernel值br40。组1的53例患者接受第2代双源CT(SOMATOM Defintion Flash;Siemens Healthcare,Forchheim,Germany)扫描,扫描的标准化参数是固定管电压120 kV,参考管电流210 mA;仅对管电流进行自动调节;螺距0.6,探测器准直128×0.6 mm,重建层厚5 mm,Kernel值B30f。先行平扫后再行增强扫描,增强时使用双筒高压注射器经肘正中静脉注射碘普罗胺(370 mg I/ml)1.5 ml/kg,随后追加40 ml生理盐水,盐水注射速度与对比剂相同。限定对比剂总注射时间在30 s以内,根据对比剂总量设定注射流率。触发扫描点设置在膈肌水平的腹主动脉,当腹主动脉CT值达到120 HU 后触发扫描,触发扫描后延迟7 s开始扫描动脉期,动脉期结束后延迟25 s进行门脉期扫描。
CT图像质量评价
主观评价:由2名具有5年以上工作经验的影像诊断医师采用5分制法对 5 mm层厚图像质量进行独立评估。图像质量的标准为能识别出不同的组织类型,检出或排除胰腺占位的信心水平。评分标准采用5分制:(1)5分:解剖结构和细节清晰,没有伪影,能够简单明了诊断;(2)4分:解剖结构和细节较清楚,有轻微的伪影,图像噪声略增高,但能够诊断;(3)3分:大部分解剖结构和细节可以显示清楚,图像有适度的噪声及伪影,局部图像质量不能明确诊断;(4)2分:解剖结构和细节不清楚,不足以诊断,胰腺是否有占位性不能排除;(5)1分:解剖结构和细节模糊,图像噪声及伪影严重,不能用于诊断[10]。患者的运动伪影不计算在内。
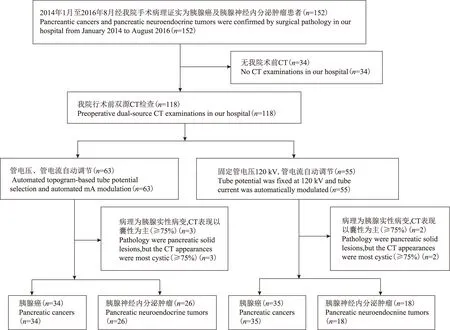
图1 患者入组流程图
Fig 1 The flow chart of patients grouping
客观评价:以上2名放射科医师在PACS系统上选择层厚5 mm的动脉期及门脉期的轴位图像,独立进行测量。动脉测量腹腔干水平腹部外空气CT值测量的标准差(standard deviation,SD)作为背景噪声,并测量腹主动脉、肝脏、胰腺正常实质、胰腺病灶的CT值,用于计算信噪比(signal to noise ratio,SNR)。门脉期测量背景噪声及肝脏、脾脏、胰腺正常实质、胰腺病灶、门静脉主干的CT值。测量胰腺实质时将面积相当的感兴趣区(region of interest,ROI)分别置于胰头、体、尾部,避开病变区域及血管,求取3个部位的平均值为最终测量值。胰腺病变的ROI尽量包括大部分病变区域,肝脏、脾脏分别选择第一肝门及脾门层面,ROI面积为80~100 mm2,避开血管结构,分散放置3个ROI,取3个部位的平均值为最终测量值。测量ROI时尽可能避开大血管、病灶和硬化伪影明显的区域,同一脏器在动脉期和门脉期进行测量时,ROI的大小、形状和位置尽可能保持一致。所有数据均测量3次并取其平均值[10]。根据记录的CT值及SD,按以下公式计算SNR:SNR=CTROI/SD空气。
CT剂量参数记录机器扫描自动生成的CT容积剂量指数(CT dose index volume,CTDIvol)、剂量长度乘积(dose-length product,DLP)。组1及组2组间剂量百分差=(CTDIvol组1-CTDIvol组2)×100/CTDIvol组1。
统计学处理采用SPSS 21.0统计软件,符合正态分布的组1和组2各亚组间患者的体质量、年龄及不同部位SNR间的比较采用独立样本t检验,两组的性别构成比及疾病构成比间的比较采用χ2检验,P<0.05为差异有统计学意义。以kappa(κ)值表示2个放射科医师间主观图像质量评价的一致性:(1)优:κ>0.81;(2)好:κ=0.61~0.80;(3)可:κ=0.41~0.60;(4)一般:κ=0.21~0.40;(5)差:κ<0.20[11]。
结 果
组间一般情况比较两组患者在性别构成比[25∶28比31∶29;χ2=0.228,P=0.633]、年龄[(59±12.4)岁比(54±16.2)岁;t=-1.562,P=0.121]、腹围[(292±22.2)cm比(297±29.5)cm;t=0.976,P=0.331]、疾病构成[18∶35比26∶34;χ2=1.039,P=0.308]方面差异均无统计学意义。组2 60例患者中,有45例接受90 kV扫描,15例接受100 kV扫描;90 kV组患者的平均腹围为(287±24)mm,明显低于100 kV 组的(328±22)mm (t=0.731,P=0.0008)。
组间剂量比较组2的平均CTDIvol为(3.9±1.0)mGy,较组1的(9.0±1.9)mGy降低了56.7%(t=17.5,P=0.0003);平均DLP值为(109±38)mGy·cm,较组1的(276±83)mGy·cm降低了60.5%(t=14.0,P=0.0007)。在组2的患者中,90 kV亚组的CTDIvol和DLP值分别为(3.5±0.8)mGy和(94±25.0)mGy·cm,分别较组1降低了61.1%(t=18.0,P=0.0006)和66.0%(t=14.2,P=0.0008);100 kV亚组的CTDIvol和DLP值分别为(5.3±0.5)mGy和(157±25.4)mGy·cm,分别较组1降低了41.1%(t=7.3,P=0.0004)和43.1%(t=5.4,P=0.0009)。
组间主观图像质量比较两名放射科医师两组的主观评分具有较好的一致性(κ≥0.837),两组患者的动脉、门脉期图像主观评分均值均≥4.55分(表1,图2、3)。
组间客观图像质量比较组2动脉期及门脉期图像的背景噪声SD分别为(6.4±0.9)和(6.4±1.0)HU,均明显高于组1的(5.6±1.4)HU (t=-3.757,P=0.0003)和(5.5±1.4)HU(t=-3.828,P=0.0006)。组2动脉期的胰腺病灶、腹主动脉和门脉期的胰腺病灶、门静脉主干的SNR分别为18.8±9.3、76.0±19.3和17.4±6.7、33.1±7.2,均明显高于组1的13.1±8.7(t=-3.379,P=0.001)、56.5±22.6(t=-2.268,P=0.025)和14.1±8.1(t=-2.283,P=0.024)、28.9±8.8(t=-2.613,P=0.009)(表2)。
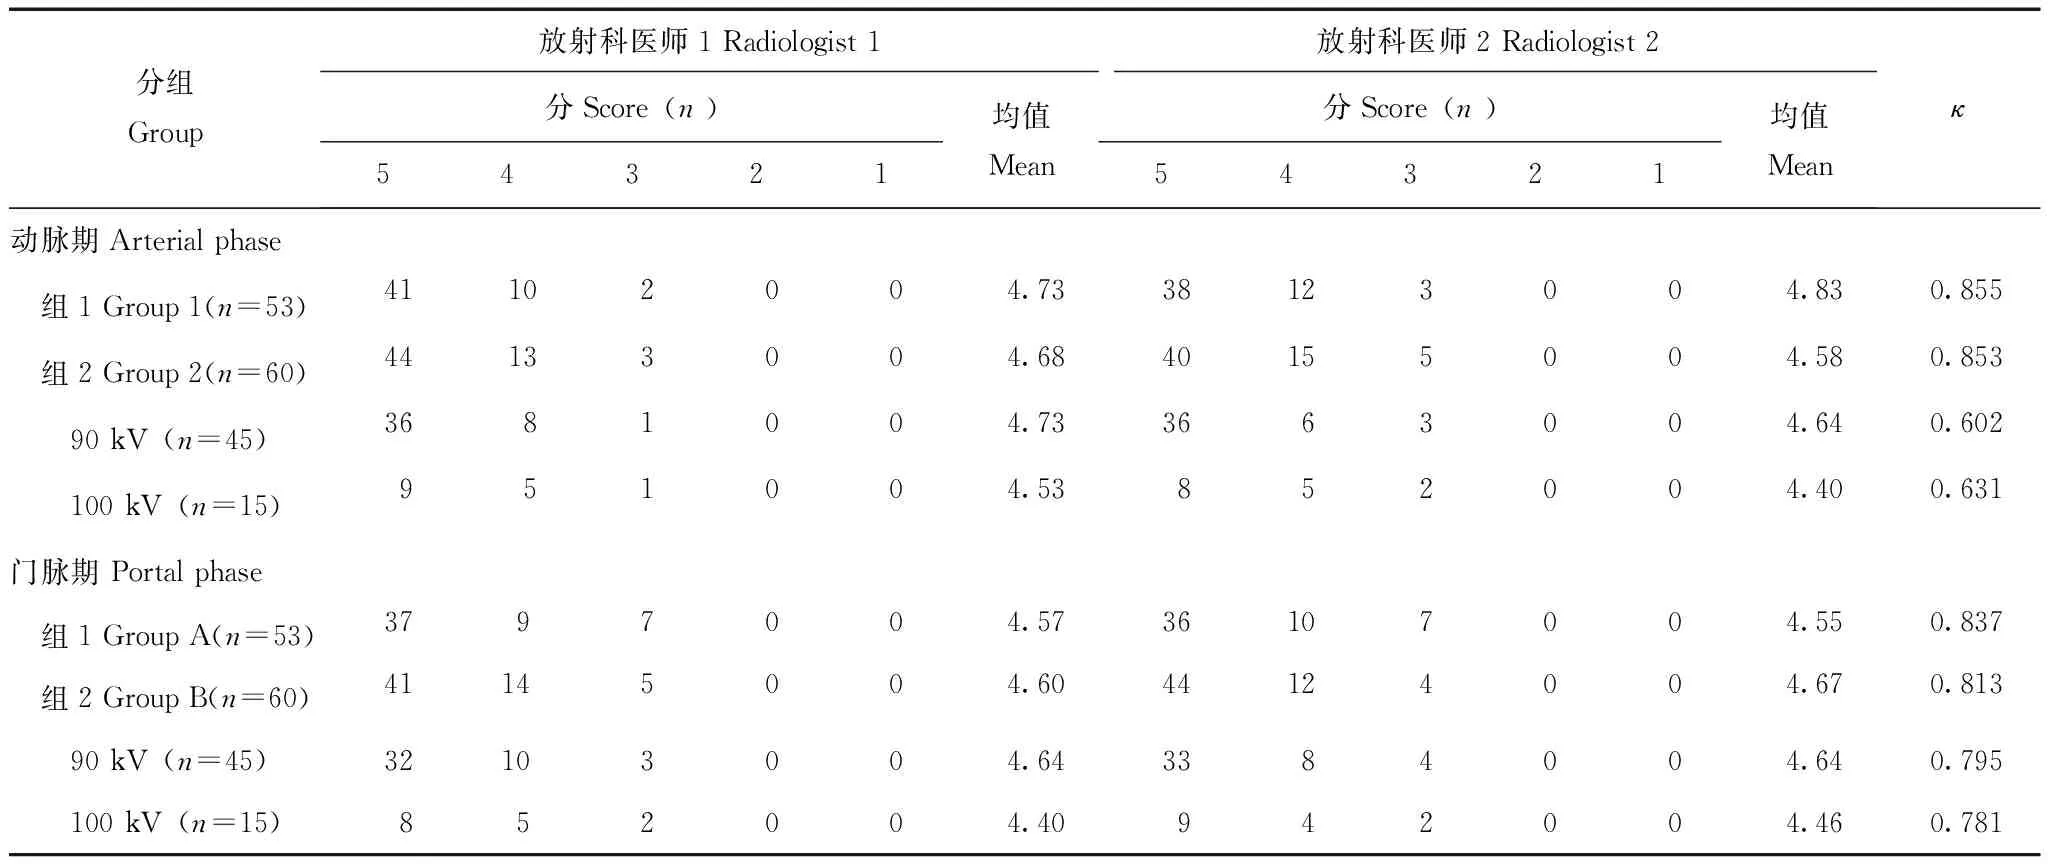
表1 动脉期和门脉期主观图像质量Table 1 Subjective image quality in the arterial and portal phases

表2 客观图像质量Table 2 Objective image quality
SNR:信噪比;SD:标准差
SNR:signal to noise ratio;SD:standard deviation

CTDIvol:CT容积剂量指数;DLP:剂量长度乘积
CTDIvol:CT dose index volume;DLP:dose-length product
图2 腹围为331 mm的胰腺神经内分泌肿瘤患者的增强CT图像:组1患者,管电压为120 kV,管电流196 mA,CTDIvol为13.25 mGy,DLP为378 mGy·cm,动脉期(A)和门脉期(B);组2患者,管电压为90 kV,管电流为156 mA,CTDIvol为4.51 mGy,DLP为106.2 mGy·cm,动脉期(C)和门脉期(D);组2较组1的CTDIvol降低了65.9%,DLP降低了71.9%,两个患者的主观图像质量均为5分
Fig 2 The enhanced CT images in two patients with pancreatic neuroendocrine tumors,the body diameter were both 331 mm: the patient of group 1 was examined on dual-source CT at 120 kV,196 mA,CTDIvolwas 13.25 mGy,DLP was 378 mGy·cm,the arterial phase(A) and the portal phase(B);the patient of group 2 underwent dual-source CT with topogram-based automatic tube potential selection and automated mA modulation,at 90 kV,156 mA,CTDIvolwas 4.51 mGy,DLP was 106.2 mGy·cm,the arterial phase(C) and the portal phase(D);compared with group 1,CTDIvolwas reduced by 65.9% and DLP was reduced by 71.9% in group 2, the subjective image quality of two patients were five points
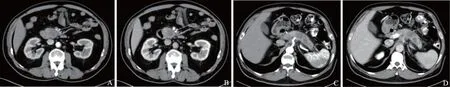
图3 腹围均为346 mm的胰腺癌患者的增强CT图像:组1患者,管电压为120 kV,管电流150 mA,CTDIvol为10.37 mGy,DLP为349 mGy·cm,动脉期(A)和门脉期(B);组2患者,管电压为100 kV,管电流为130 mA,CTDIvol为5.26 mGy,DLP为164.8 mGy·cm,动脉期(C)和门脉期(D);组2较组1的CTDIvol降低了49.3%,DLP降低了52.8%,2例患者的主观图像质量均为5分
Fig 3 The enhanced CT images in two patients with pancreatic cancers, the body diameter were both 346 mm: the patient of group 1 was examined on dual-source CT at 120 kV,150 mA, CTDIvolwas 10.37 mGy,DLP was 349 mGy·cm,the arterial phase(A) and the portal phase(B);the patient of group 2 underwent dual-source CT with topogram-based automatic tube potential selection and automated mA modulation,at 100 kV,130 mA,CTDIvolwas 5.26 mGy,DLP was 164.8 mGy·cm,the arterial phase(C) and the portal phase(D);compared with group 1,CTDIvolwas reduced by 49.3% and DLP was reduced by 52.8% in group 2, the subjective image quality of two patients were five points
讨 论
自动管电压选择技术是根据患者体质量及研究目的获得患者最优化的管电压及管电流组合的软件,实现在保证图像质量的同时,最大限度减低辐射剂量[12- 13]。国内已有研究评估自动管电压技术在肺及肝脏等部位的应用价值,均显示其可在保证图像质量的前提下明显降低辐射剂量。本研究则评估了自动管电压选择技术在胰腺实性病变中的应用,结果显示,基于定位像的自动管电压选择技术应用于胰腺实性病变时,其辐射剂量降低更显著,90 kV的管电压较标准管电压扫描,CTDIvol降低了61.1%,DLP降低了66.0%。此外,本研究还发现,90 kV与100 kV两亚组间患者腹围存在明显差异,这表明患者的腹围与自动选择管电压间存在一定的相关性,随着腹围的增加,管电压有增加的趋势。
Eller等[12]研究发现,采用自动管电压选择技术获得的图像质量与标准管电压120 kV无明显差异,而自动管电压选择组的SNR明显高于标准管电压120 kV组;其中,自动管电压选择组中有9% 选择了80 kV,75%选择了100 kV,16%选择了120 kV,仅 1 例选择140 kV。而在Frellesen等[14]的研究中,自动选择管电压比例:100 kV为82%,120 kV为12%,140 kV为6%,100 kV为最常见的选择。本研究自动管电压选择组60例患者中,75%选择了90 kV,25%选择了100 kV,其中90 kV为最常选择的管电压,提示我国患者自动选择的管电压档更低,更有利于降低辐射剂量,推测这与我国患者体质量指数普遍相对较小有关。此外,本研究结果显示,尽管自动管电压选择组的图像噪声明显高于固定管电压组,但两组的主观评分并无明显差异,与以往研究相同。
本研究存在以下不足:(1)两组患者在两代不同的CT机器上扫描,有不同的技术要求,但本研究已经尽量保证其参数的一致性,尽管其准直器宽度不一致,但这些不一致因素不足以单独解释其辐射剂量的大幅度降低;(2)本研究没有对两组图像的对比噪声比(contrast to noise ratio,CNR)进行比较,因病灶CNR影响因素较多,除与图像质量、医生经验有关以外,还与病变本身的性质有很大关系。
综上,本研究结果显示,自动管电压选择技术在胰腺实性病变患者中可以明显降低辐射剂量,同时图像质量保持在一个较高的诊断水平。我国患者自动选择的管电压档更低,在临床工作中可常规应用自动管电压选择技术,实现患者的个体化扫描。
[1]Low G,Panu A,Millo N,et al. Multimodality imaging of neoplastic and nonneoplastic solid lesions of the pancreas [J]. Radiographics,2011,31(4):993- 1015.
[2]Rahib L,Smith BD,Aizenberg R,et al. Projecting cancer incidence and deaths to 2030:the unexpected burden of thyroid,liver,and pancreas cancers in the United States [J]. Cancer Res,2014,74(11):2913- 2921.
[3]Baskerville JR. Screening patients with multi-detector computed axial tomography (MDCT):when will we inform patients about the risk of radiation [J]. Emerg Med J,2008,25(6):323- 324.
[4]Fazel R,Krumholz HM,Wang Y,et al. Exposure to low-dose ionizing radiation from medical imaging procedures [J]. N Engl J Med,2009,361(9):849- 857.
[5]Gunn ML,Kohr JR. State of the art:technologies for computed tomography dose reduction [J]. Emerg Radiol,2010,17(3):209- 218.
[6]Yu L,Li H,Fletcher JG,et al. Automatic selection of tube potential for radiation dose reduction in CT:a general strategy [J]. Med Phys,2010,37(1):234- 243.
[7]Winklehner A,Goetti R,Baumueller S,et al. Automated attenuation-based tube potential selection for thoracoabdominal computed tomography angiography:improved dose effectiveness [J]. Invest Radiol,2011,46(12):767- 773.
[8]Brenner DJ,Hall EJ. Computed tomography-an increasing source of radiation exposure [J]. N Engl J Med,2007,357(22):2277- 2284.
[9]Shuryak I,Sachs RK,Brenner DJ. Cancer risks after radiation exposure in middle age [J]. J Natl Cancer Inst,2010,102(21):1628- 1636.
[10]Lee KH,Lee JM,Moon SK,et al. Attenuation-based automatic tube voltage selection and tube current modulation for dose reduction at contrast-enhanced liver CT [J]. Radiology,2012,265(2):437- 447.
[11]Schindera ST,Winklehner A,Alkadhi H,et al. Effect of automatic tube voltage selection on image quality and radiation dose in abdominal CT angiography of various body sizes:a phantom study [J]. Clin Radiol,2013,68(2):e79- e86.
[12]Eller A,May MS,Scharf M,et al. Attenuation-based automatic kilovolt selection in abdominal computed tomography:effects on radiation exposure and image quality [J]. Invest Radiol,2012,47(10):559- 565.
[13]张芮,高剑波,刘杰,等. 自动管电压选择技术在不同体质量指数患者腹部增强 CT 扫描中的应用 [J]. 实用放射学杂志,2014,6):1014- 1017,1034.
[14]Frellesen C,Stock W,Kerl JM,et al. Topogram-based automated selection of the tube potential and current in thoraco-abdominal trauma CT-a comparison to fixed kV with mAs modulation alone [J]. Eur Radiol,2014,24(7):1725- 1734.
Comparison of Topogram-based Automated Selection of Tube Potential and Fixed Tube Potential in Imaging Solid Pancreatic Lesions
XU Kai,ZHU Liang,XUE Huadan,LI Ping,SUN Zhaoyong,DU Yao,WANG Yun,JIN Zhengyu
Department of Radiology,PUMC Hospital,CAMS and PUMC,Beijing 100730,China
WANG Yun Tel:010- 69155509,E-mail:wangyun8637@163.com
Objective To evaluate the image quality and radiation exposure in multidetector computed tomography (MDCT) with automated topogram-based tube potential selection,compared to fixed tube potential,in patients with solid pancreatic lesions. Methods The preoperative pancreatic dual-source CT images of 113 patients who were confirmed as solid pancreatic lesions by postoperative pathology in the Peking Union Medical College Hospital from January 2014 to August 2016 were retrospectively analyzed.Among them,53 patients were examined on fixed tube potential at 120 kV,and tube current was automatically modulated (group 1). Sixty patients underwent topogram-based automatic tube potential selection (Tube voltage step:90,100 kV) and automated mA modulation (group 2). Two experienced radiologists measured the body sizes,assessed subjective and objective image quality of arterial phase and portal phase,and recorded radiation parameters including CT dose index volume (CTDIvol) and dose-length product (DLP). Results Of 60 patients in group 2,45 patients were scaned at 90 kV,15 patients were scaned at 100 kV.The average body diameter [(287±24) mm] in 90 kV group was significantly lower than that [(328±22) mm] in 100 kV group(t=0.731,P=0.0008). The mean CTDIvol[(3.9±1.0) mGy] in group 2 was significantly lower than in group 1 [(9.0±1.9) mGy],reduced by 56.7% (t=17.5,P=0.0003). The average DLP [(109±38) mGy·cm] in group 2 was significantly lower than that in group 1 [(276±83) mGy·cm],reduced by 60.5% (t=14.0,P=0.0007). In group 2,the standard deviations of images background noise in arterial and portal phase were (6.4±0.9) and (6.4±1.0)HU,respectively,which were significantly higher than those in group 1 [(5.6±1.4)HU,t=-3.757,P=0.0003;(5.5±1.4)HU,t=-3.828,P=0.0006]. In group 2,the signal to noise ratios of pancreatic lesions, abdominal aorta in arterial phase and pancreatic lesions, the portal vein in portal phase were 18.8±9.3,76.0±19.3 and 17.4±6.7,33.1±7.2,which were significantly higher than those in group 1 (13.1±8.7,t=-3.379,P=0.001;56.5±22.6,t=-2.268,P=0.025;14.1±8.1,t=-2.283,P=0.024;28.9±8.8,t=-2.613,P=0.009). Conclusion Compared with fixed tube voltage on the second-generation dual-source CT techniques,topogram-based automatic tube potential selection on third-generation dual-source CT can reduce radiation dose without decreasing image quality in imaging solid pancreatic lesions.
third-generation dual-source CT;solid pancreatic lesions;automatic tube potential selection;fixed tube potential;image quality;radiation
国家自然科学基金(81371608)和卫生公益性行业科研专项项目(201402001、201402019)Supported by the National Natural Sciences Foundation of China (81371608) and the Health Industry Special Scientific Research Project (201402001,201402019)
王 沄 电话:010- 69155509,电子邮件:wangyun8637@163.com
R814.42
A
1000- 503X(2017)01- 0088- 07
10.3881/j.issn.1000- 503X.2017.01.015
2016- 08- 29)
猜你喜欢
中国医学影像学杂志(2021年6期)2021-08-13 08:43:38
学生天地(2020年5期)2020-08-25 09:09:08
电子测试(2018年10期)2018-06-26 05:53:36
汽车博览(2016年9期)2016-10-18 13:05:41
中国继续医学教育(2015年6期)2016-01-07 07:38:42
交通建设与管理(2015年15期)2015-03-20 15:19:15
肝胆胰外科杂志(2015年5期)2015-02-27 11:12:48
肝胆胰外科杂志(2015年4期)2015-02-27 11:12:23
应用数学与计算数学学报(2014年1期)2014-09-26 12:19:08
西南军医(2014年5期)2014-04-25 07:42:27