城区成年居民体力活动模式与超重及肥胖的关系研究
李米环,李国强,江崇民
·论著·
城区成年居民体力活动模式与超重及肥胖的关系研究
李米环,李国强,江崇民
背景 增加体力活动位居健康促进措施之首,其健康效应已涉及超重、肥胖及相关慢性病的发生、发展和预后。而大量久坐行为独立于中高强度体力活动水平,增加超重、肥胖及相关慢性病的患病风险。因此,要评估体力活动与肥胖间的真实效应,仅关注中高强度活动或静坐活动是片面的,应综合考虑日常生活中多种体力活动组合形式与超重、肥胖的关联。目的 探讨城区成年居民不同体力活动模式与超重、肥胖的关系。方法 于2013年3—10月,采用多阶段随机抽样方法,在南京市和上海市选取756名成年居民进行调查。收集研究对象性别、年龄、文化程度、身高、体质量、慢性病患病情况,采用体力活动日志调查研究对象连续7 d的体力活动时间。采用因子分析评价研究对象体力活动模式,将各体力活动模式的因子得分分为等距的4组,由低到高将研究对象分为Q1组、Q2组、Q3组和Q4组。结果 研究对象超重率和肥胖率分别为33.2%(251/756)和6.3%(48/756)。男性超重率、肥胖率均高于女性(χ2=23.80、8.79,P<0.01)。各年龄段超重率比较,差异有统计学意义(χ2=23.20,P<0.05)。因子分析提取前4个为主要因子,特征值分别为2.52、2.00、1.45和1.18,累积贡献率为57.5%,分别命名为久坐模式、居家模式、均衡模式、锻炼模式。Logistic回归分析显示,经校正混杂因素后,久坐模式是超重、肥胖的危险因素,居家模式是超重、肥胖的保护因素(P<0.05)。未发现均衡模式、锻炼模式与超重、肥胖的发生风险有关(P>0.05)。久坐模式Q1组与Q4组中强度活动、高强度活动时间百分比比较,差异均无统计学意义(P>0.05);Q1组静坐活动时间百分比低于Q4组,低强度活动时间百分比高于Q4组,总能耗高于Q4组(P<0.05)。居家模式Q1组与Q4组中强度活动、高强度活动时间百分比比较,差异均无统计学意义(P>0.05);Q1组静坐活动时间百分比高于Q4组,低强度活动时间百分比低于Q4组,总能耗低于Q4组(P<0.05)。均衡模式与锻炼模式各强度活动时间百分比及总能耗比较,差异均无统计学意义(P>0.05)。结论 以静态活动为主的久坐模式是超重、肥胖的危险因素,锻炼模式并不能完全保护个体久坐对健康的消极影响,通过低强度体力活动累积而获得高水平能量消耗量增加的居家模式可补偿久坐对健康的危害。
超重;肥胖症;体力;久坐生活方式;成年人
李米环,李国强,江崇民.城区成年居民体力活动模式与超重及肥胖的关系研究[J].中国全科医学,2016,19(32):3933-3939.[www.chinagp.net]
LI M H,LI G Q,JIANG C M.Relationship between physical activity patterns and overweight and obesity in community adult residents[J].Chinese General Practice,2016,19(32):3933-3939.
肥胖是引起糖尿病、心血管疾病和代谢综合征的主要危险因素,同时也可导致残疾、寿命缩短和生活质量下降等一系列问题[1]。中国健康和营养调查数据发现,成年人体质指数(BMI)呈逐年增加趋势,超重率从1993年的9.4%增加到2009年的15.7%,增加了67%;而肥胖则从4.0%增加到10.7%,增加了168.0%[2]。因此,在根治肥胖尚无有效手段的条件下,预防肥胖发生显得更为重要。
肥胖的形成与发展主要受遗传因素和体力活动等环境因素的影响,但遗传因素对肥胖的影响仅提供了可能,改变包括体力活动模式在内的后天行为方式可能会对肥胖产生影响。在一些观察性研究和干预试验中发现,不同体力活动模式对肥胖的影响不同,成年人累积静坐行为时间与肥胖程度呈正相关[3];相比于静坐时间少于3 h/d的人群,静坐时间超过6 h/d者肥胖发生风险增高46%[4];5 d/周,45 min/d的中等强度体力活动可使成年人总体脂肪、皮下脂肪和腹腔内脂肪显著降低[5]。然而,另有证据表明,久坐独立于中高强度体力活动对健康产生消极影响[6],但低强度体力活动中断静坐行为具有降低体脂的作用[7-8]。既往研究提示,要评估体力活动与肥胖间的真实效应,应综合考虑各活动之间的交互作用,组合日常多种体力活动形式进行分析,而不应仅片面地关注单一活动或行为与肥胖的关联。因此,本研究采用体力活动模式法,探讨南京市和上海市居民体力活动习惯与超重、肥胖关系,为有针对性制定肥胖防控措施提供依据。
1 对象与方法
1.1 研究对象 于2013年3—10月,采用多阶段随机抽样方法在南京市和上海市各随机选取4个区,每个区各随机选取2个居委会,每个居委会各随机选取1个小区,每个小区各随机选取60名,共960名居民为研究对象。纳入标准:(1)年龄≥18岁;(2)本地居住时间5年及以上。排除标准:(1)有肥胖遗传史,严重急慢性疾病、残疾、神经功能受损和心理疾病;(2)告知研究内容后不能签署知情同意书。最终756名对象纳入统计分析。
1.2 方法
1.2.1 个人信息调查 个人信息调查内容包括研究对象姓名、性别、年龄、文化程度、身高和体质量以及经医院检查确诊的慢性病患病情况。依据中国肥胖问题工作组2002年推荐的BMI分类标准,BMI<18.5 kg/m2为偏低,18.5 kg/m2≤BMI<24.0 kg/m2为正常,24.0 kg/m2≤BMI<28.0 kg/m2为超重,BMI≥28.0 kg/m2为肥胖[9]。
1.2.2 体力活动调查 采用体力活动日志调查研究对象体力活动,其信度、效度均大于0.82[10]。体力活动日志是以0、1、2……22、23 h为行,以0~14 min、15~29 min、30~44 min、45~59 min为列的表格形式呈现,每一格表示15 min。研究对象填写表格时,写明从00:00~23:59结束所进行的每项体力活动,如研究对象所做的活动持续较长时间,可划一条横线直到活动改变;如果活动不足15 min,可酌情取舍,并连续记录7 d(包括2个休息日)。为方便填写,研究组依据当地居民特有的体力活动习惯,为研究对象提供一份身体活动调查参照表,包括睡觉、躺看书、躺看电视、坐看电视等活动项目。调查后发现,调查参照表中的活动项目涵盖了研究对象95%的日常活动。
1.2.3 体力活动的能量赋值与分类 依据《2011年体力活动纲要——第二次更新的活动编码和代谢当量值》[11],对体力活动日志调查到的各项活动项目进行代谢当量赋值,然后,参照静坐活动(1.0~1.5 kcal·h-1·kg-1)、低强度活动(1.6~2.9 kcal·h-1·kg-1)、中强度活动(3.0~5.9 kcal·h-1·kg-1)、高强度活动(≥6.0 kcal·h-1·kg-1)[12]分类标准对活动项目分类(见表1)。
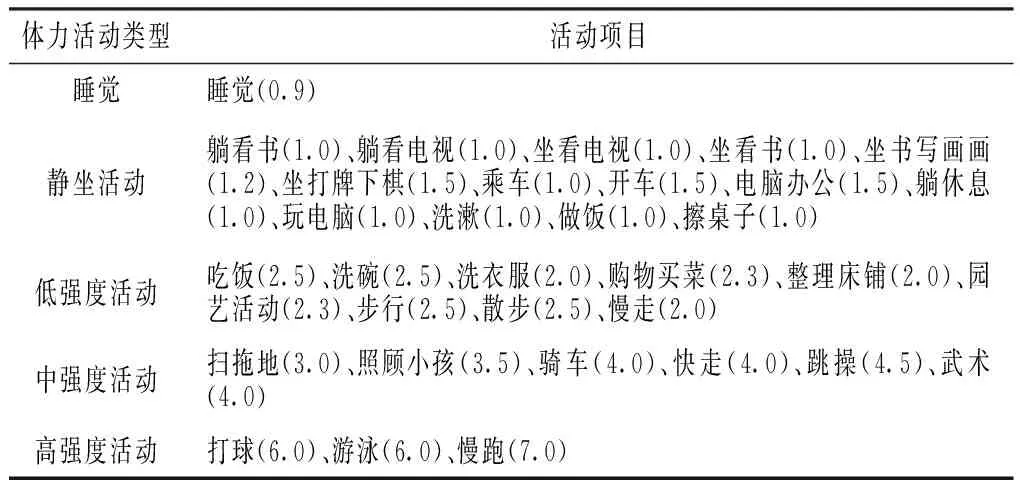
表1 各项活动项目代谢当量赋值
1.3 统计学方法 采用SPSS 17.0软件进行统计学分析。体力活动模式采用因子分析,在体力活动模式的建立中,考虑到统计学效率,将人均活动时间少于10 min/d的同类活动合并,如将躺看书和躺看电视合并为躺看书电视类,将开车和乘车合并为开乘车类,将整理床铺和园艺活动合并为整理内务庭院类,将步行、散步、慢走、快走和慢跑合并为走跑类;将跳操、武术、打球、游泳合并为球操术类,然后采用主成分分析法鉴别人群的体力活动模式。为得到具有典型意义因子结构,对初始因子采用Quartimax正交旋转,分析前进行Kaiser-Meyer-Olkin和Bartlett′s球形检验,对适合做因子分析的数据依据特征值、碎石图、因子解释的方差比例来确定体力活动模式。
将各体力活动模式的因子得分分为等距的4组,由低到高将研究对象分为Q1组、Q2组、Q3组和Q4组。个体在某种活动模式中因子得分越高,表明其体力活动习惯越倾向于该种模式。计算静坐活动、低强度活动、中强度活动、高强度活动总时间及百分比,并计算总能耗=∑(活动时间/60×体质量×代谢当量)。
2 结果
2.1 基本情况 756名研究对象中男348名、女408名,平均年龄(45.2±15.2)岁,BMI为(23.7±2.8)kg/m2。研究对象高血压、高血脂、糖尿病、冠心病患病率分别为21.6%(163/756)、8.6%(65/756)、6.2%(47/756)、3.8%(29/756),超重率和肥胖率分别为33.2%(251/756)和6.3%(48/756)。
男性超重率、肥胖率均高于女性,差异有统计学意义(χ2=23.80、8.79,P<0.01)。各年龄段超重率比较,差异有统计学意义(χ2=23.20,P<0.05);各年龄段肥胖率比较,差异无统计学意义(χ2=4.31,P>0.05)。不同文化程度者超重率、肥胖率比较,差异均无统计学意义(χ2=0.03、3.26,P>0.05,见表2)。
2.2 活动项目的因子分析 Kaiser-Meyer-Olkin和Bartlett′s球形检验结果显示,KMO=0.67,P<0.01,说明变量间存在相关性,建立的因子模型尚可接受。结合碎石图(见图1)、特征值和因子解释的方差比例,提取前4个为主要因子,特征值分别为2.52、2.00、1.45和1.18,各因子所解释的方差占总方差的百分比分别为21.2%、17.4%、10.3%和8.6%,累积贡献率为57.5%(见表3)。
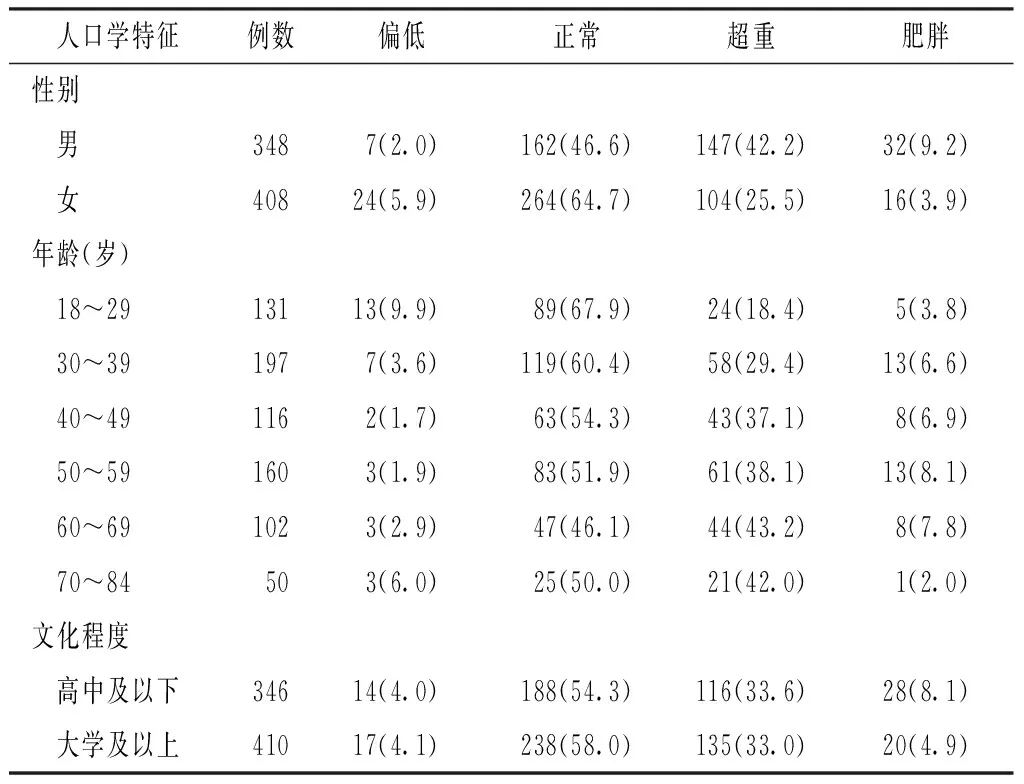
表2 不同人口学特征的研究对象BMI分布〔n(%)〕
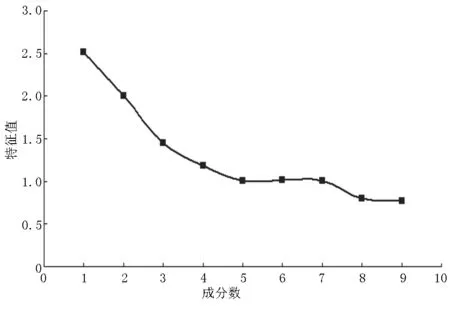
图1 各因子特征值的碎石图

表3 相关矩阵特征值
因子1显示躺看书电视类、坐看电视、坐看书、坐书写画画、坐打牌下棋、电脑办公、躺休息等静坐行为时间较高的特点,可称其为久坐模式;因子2显示擦桌子、洗碗、洗衣服、购物买菜、整理内务庭院类、扫拖地、照顾小孩等家务劳动时间较高的特点,可称其为居家模式;因子3显示各项活动时间处于中等水平,有相对平衡的趋势,可称其为均衡模式;因子4显示走跑类和球操术类活动时间较高的特点,可称其为锻炼模式(见表4)。
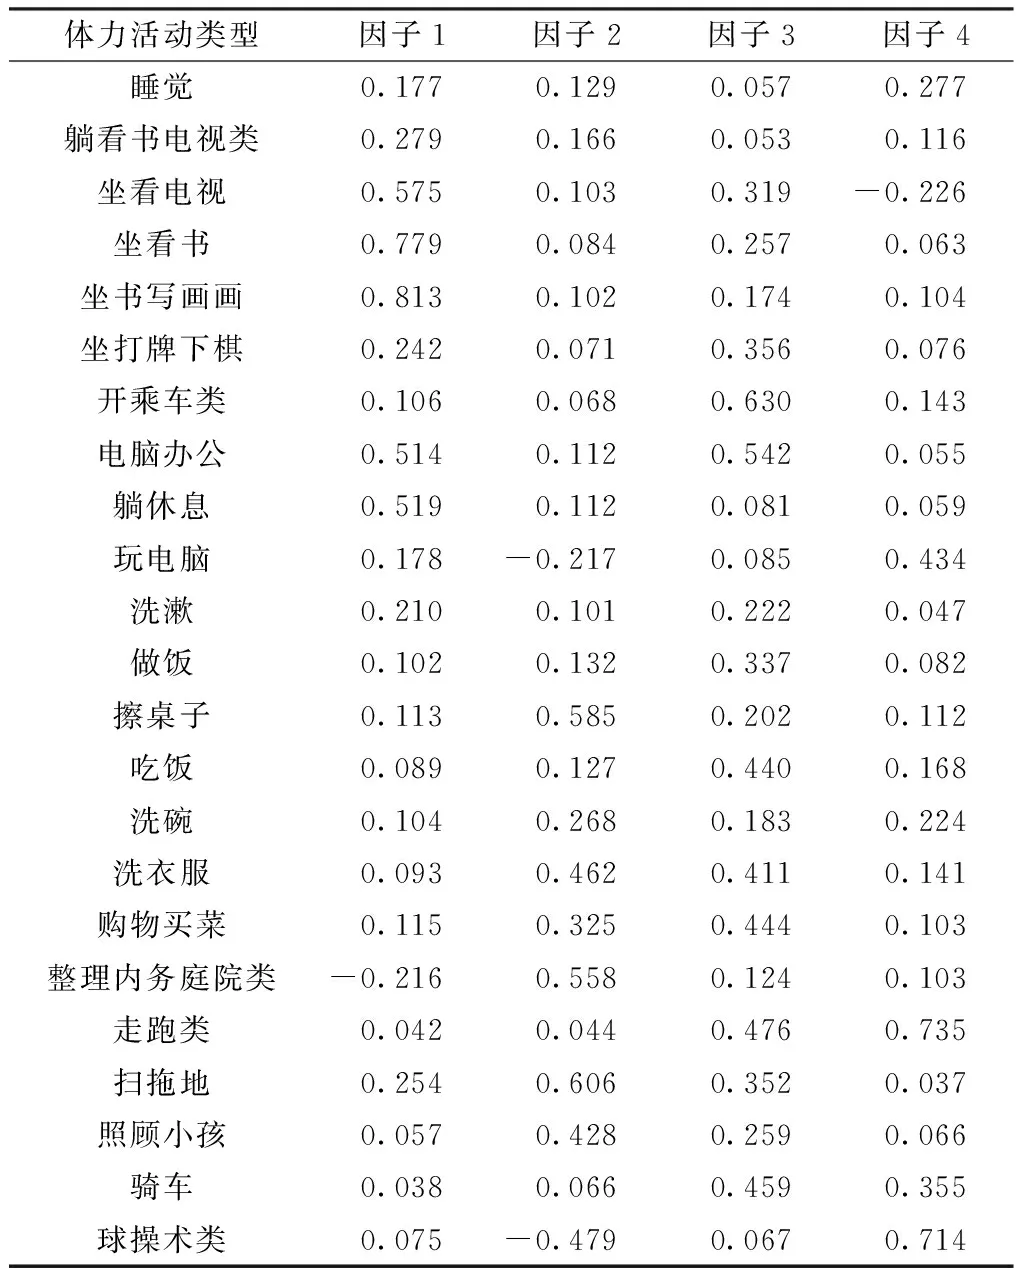
表4 研究对象体力活动模式因子载荷
2.3 体力活动模式与超重、肥胖风险的Logistic回归分析 在未调整模型中,相对于Q1组,久坐模式Q4组超重、肥胖风险增加,居家模式Q4组超重、肥胖风险降低(P<0.05)。经校正混杂因素后,久坐模式仍是超重、肥胖的危险因素,居家模式是超重、肥胖的保护因素(P<0.05)。未发现均衡模式、锻炼模式与超重、肥胖的发生风险有关(P>0.05,见表5、6)。

表5 体力活动模式与超重风险关系的Logistic回归分析

表6 体力活动模式与肥胖风险关系的Logistic回归分析
2.4 不同强度活动时间百分比及总能耗比较 久坐模式Q1组与Q4组中强度活动、高强度活动时间百分比比较,差异均无统计学意义(P>0.05);Q1组静坐活动时间百分比低于Q4组,低强度活动时间百分比高于Q4组,总能耗高于Q4组,差异均有统计学意义(P<0.05)。居家模式Q1组与Q4组中强度活动、高强度活动时间百分比比较,差异均无统计学意义(P>0.05);Q1组静坐活动时间百分比高于Q4组,低强度活动时间百分比低于Q4组,总能耗低于Q4组,差异均有统计学意义(P<0.05)。均衡模式与锻炼模式各强度活动时间百分比及总能耗比较,差异均无统计学意义(P>0.05,见表7)。
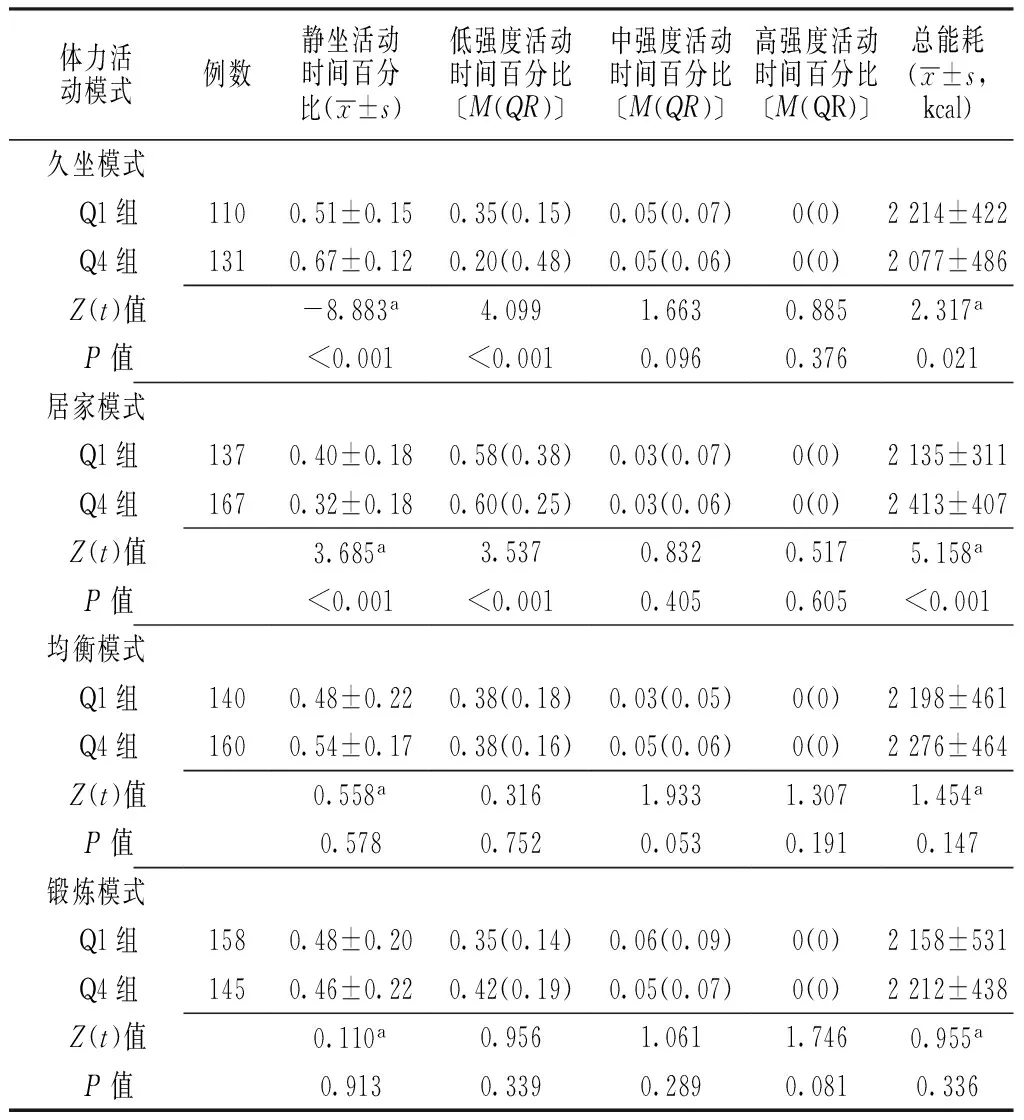
表7 体力活动模式Q1组和Q4组不同强度活动时间百分比及总能耗比较
3 讨论
本研究结果显示,南京市和上海市社区居民超重/肥胖率为39.6%,远高于全国水平(23.2%)[13],与中国和日本在2004—2007年联合进行的国民体质调查中上海成年人超重/肥胖率(39.5%)结果基本一致[14],但低于2013年孟派等[15]调查结果(43%),也低于2005年唐游春等[16]和2007年徐鹭等[17]对南京市成年居民超重/肥胖率的调查结果。然而,本研究男性超重/肥胖率为51.4%,不仅远高于日本和其他发达国家[18],甚至高于欧美发达国家[19-20],提示男性居民健康状况应引起足够重视。本研究在体力活动模式分析中发现,久坐模式是罹患超重、肥胖的危险因素,居家模式是超重、肥胖的保护因素,而传统意义上的具有健康促进效应的锻炼模式并未发现具有保护效应。而在控制混杂因素后,依然能观察到该研究人群越倾向于久坐模式,越易出现超重、肥胖,而趋向于居家模式型体力活动模式,超重、肥胖风险降低。
研究表明,静态活动时间与成年人腰围、BMI呈正相关[21-22],静态活动时间超过4 h/d,成年人超重/肥胖发生的风险显著增加[23],尤其向心性肥胖增加的风险升高80%[24]。HENSON等[25]采用加速度计客观测量法对2型糖尿病患者研究发现,静态活动时间每增加30 min,内脏和心脏脂肪分别增加183.7 cm3和15.7 cm3。如果用低强度体力活动来替代1 h的静态活动,可显著减少皮下和内脏脂肪[26]。本研究结果中,静态活动时间百分比较大的久坐模式Q4组相对于Q1组有较高的超重、肥胖风险,另外,久坐模式Q4组相对于Q1组静坐活动时间更长,占清醒状态总时间的百分比均超过50%,且Q4组能量消耗水平是Q1组的94%,也进一步证实了长时间静态活动对健康的消极作用。
尽管每日健身锻炼时间百分比较大的体力活动模式被广泛报道与超重、肥胖等慢性疾病风险降低密切相关[27-28],然而,本研究并未得出该结论。然而,本研究发现低强度活动时间百分比较大的居家模式对个体超重、肥胖的发生具有保护作用,居家模式Q4组相对于Q1组有较低的超重、肥胖风险;进一步分析发现,锻炼模式中高强度活动时间仅占该群体清醒状态下活动总时间的11%,而静态活动时间百分比近50%。分析原因认为个体在中高强度活动时间外的其他时间多用于从事静坐行为,自然减弱了运动能耗对肥胖的健康效应。美国一项研究发现,成年人平均日总能耗的52.1%来自于低强度非运动性日常活动热效应,休闲时间运动性热效应不足5%[29]。表明即使个体在日常生活中满足体力活动推荐量增加了能耗,但仍不可避免会累积大量的静坐行为[30],而久坐独立于中高强度体力活动水平可增加超重、肥胖的风险[31]。本研究结果验证了“即使个体满足至少150 min/周的中高强度体力活动推荐量,但并不能完全保护个体长时间静态活动对健康的消极影响[32];反之,即使个体未满足体力活动推荐量,一天中高水平低强度活动可补偿久坐对健康的危害[33]”这一结论。为保持能量平衡达到预防和控制肥胖的目的,相比于体力活动强度,总能耗的增加越多越好[34]。BLACK等[35]采用双标水法对以坐式活动为主的英国成年人研究发现,日总能耗的差异在个体间普遍存在,体格相似个体的差异可高达2 000 kcal。假如两个体质量70 kg的个体,即使5次/周、30 min/次参加中等强度体育锻炼(如快走),平均运动能量消耗也仅为120 kcal/d。由于基础代谢主要受体格的影响,食物热效应占总能耗的10%,相对比较固定,由此看来两个体日总能耗差异的94%可由非运动性日常活动(如购物买菜、照顾小孩和家务劳动等)的热效应来解释。进一步证实以低强度、高频率累积非运动性日常活动为主的居家模式产生的能耗量,远高于满足有限运动频率30 min/d的体力活动推荐量以外大部分时间用于静态活动为主的锻炼模式的能耗量,更易对肥胖个体产生健康效益。
综上所述,在各种体力活动模式中,以静态行为为主的久坐模式引发超重、肥胖的风险较大;居家模式通过对低强度体力活动的累积而达到体力活动总能耗的显著增加,从而在控制体质量、预防肥胖方面的健康效益更显著。因此,为有效预防和控制成年人正常体质量向超重或肥胖发生劣变,遵循“体力活动指南”是促进健康的基础,减少日常生活中的静坐行为或采用低强度活动替代静坐行为也应该被鼓励,同时还要注意控制膳食中的能量摄入量以促进能量代谢负平衡。
作者贡献:李米环进行课题设计与实施、资料收集整理、成文并对文章负责;李国强进行课题设计与实施、评估、资料收集整理;江崇民进行质量控制及审校。
本文无利益冲突。
[1]RAMACHANDRAN A,CHAMUKUTTAN S,SHETTY S A,et al.Obesity in Asia——is it different from rest of the world[J].Diabetes Metab Res Rev,2012,28(Suppl 2):47-51.
[2]XI B,LIANG Y,HE T,et al.Secular trends in the prevalence of general and abdominal obesity among Chinese adults,1993—2009[J].Obes Rev,2012,13(3):287-296.
[3]HU F B.Sedentary lifestyle and risk of obesity and type 2 diabetes[J].Lipids,2003,38(2):103-108.
[4]BLANCK H M,MCCULLOUGH M L,PATEL A V,et al.Sedentary behavior,recreational physical activity,and 7-year weight gain among postmenopausal U.S.women[J].Obesity(Silver Spring),2007,15(6):1578-1588.
[5]IRWIN M L,YASUI Y,ULRICH C M,et al.Effect of exercise on total and intra-abdominal body fat in postmenopausal women:a randomized controlled trial[J].JAMA,2003,289(3):323-330.
[6]HAWLEY J A,GIBALA M J.What′s new since Hippocrates?Preventing type 2 diabetes by physical exercise and diet[J].Diabetologia,2012,55(3):535-539.
[7]LEVINE J A.Nonexercise activity thermogenesis(NEAT):environment and biology[J].Am J Physiol Endocrinol Metab,2004,286(5):E675-685.
[8]LEVINE J A,LANNINGHAM-FOSTER L M,MCCRADY S K,et al.Interindividual variation in posture allocation:possible role in human obesity[J].Science,2005,307(5709):584-586.
[9]中国肥胖问题工作组数据汇总分析协作组.我国成人体重指数和腰围对相关疾病危险因素异常的预测价值:适宜体重指数和腰围切点的研究[J].中华流行病学杂志,2002,23(1):10-15.
[10]BOUCHARD C,TREMBLAY A,LEBLANC C,et al.A method to assess energy expenditure in children and adults[J].Am J Clin Nutr,1983,37(3):461-467.
[11]AINSWORTH B E,HASKELL W L,HERRMANN S D,et al.2011 Compendium of Physical Activities:a second update of codes and MET values[J].Med Sci Sports Exerc,2011,43(8):1575-1581.
[12]NORTON K,NORTON L,SADGROVE D.Position statement on physical activity and exercise intensity terminology[J].J Sci Med Sport,2010,13(5):496-502.
[13]武阳丰,马冠生,胡永华,等.中国居民的超重和肥胖流行现状[J].中华预防医学杂志,2005,39(5):316-320. WU Y F,MA G S,HU Y H,et al.The current prevalence status of body overweight and obesity in China:data from the China National Nutrition and Health Survey[J].Chinese Journal of Preventive Medicine,2005,39(5):316-320.
[14]王欢,蔡睿,刘新华,等.上海、东京成年人超重、肥胖状况的比较研究[J].中国体育科技,2009,45(1):129-132. WANG H,CAI R,LIU X H,et al.Comparison of prevalence of overweight/obesity of adults between Shanghai and Tokyo[J].China Sport Science and Technology,2009,45(1):129-132.
[15]孟派,贾俐挺,高曦,等.上海社区成年人群超重肥胖与膳食模式的关系探讨[J].卫生研究,2014,43(4):567-572. MENG P,JIA L T,GAO X,et al.Overweight and obesity in Shanghai adults and their associations with dietary patterns[J].Journal of Hygiene Research,2014,43(4):567-572.
[16]唐游春,邢光红,洪忻,等.南京市居民超重肥胖与体力活动相关性研究[J].江苏预防医学,2011,22(6):22-23,26. TANG Y C,XING G H,HONG X,et al.Epidemiological study on the interrelationship of physical activity and overweight and obesity in residents of Nanjing[J].Jiangsu Journal of Preventive Medicine,2011,22(6):22-23,26.
[17]徐鹭,洪忻,梁亚琼,等.南京市30岁以上居民膳食与肥胖调查[J].中国慢性病预防与控制,2012,20(6):652-655. XU L,HONG X,LIANG Y Q,et al.Investigation on diet and obesity in people aged older than 30 years in Nanjing city[J].Chinese Journal of Prevention and Control of Chronic Diseases,2012,20(6):652-655.
[18]MURAKAMI Y,MIURA K,UESHIMA H.Comparison of the trends and current status of obesity between Japan and other developed countries[J].Nihon Rinsho,2009,67(2):245-252.
[19]OGDEN C L,CARROLL M D,CURTIN L R,et al.Prevalence of overweight and obesity in the United States,1999—2004[J].JAMA,2006,295(13):1549-1555.
[20]JAMES P T.Obesity:the worldwide epidemic[J].Clin Dermatol,2004,22(4):276-280.
[21]GOLUBIC R,WIJNDAELE K,SHARP S J,et al.Physical activity,sedentary time and gain in overall and central body fat:7-year follow-up of the ProActive trial cohort[J].Int J Obes(Lond),2015,39(1):142-148.
[22]GENNUSO K P,GANGNON R E,MATTHEWS C E,et al.Sedentary behavior,physical activity,and markers of health in older adults[J].Med Sci Sports Exerc,2013,45(8):1493-1500.
[24]GARDINER P A,HEALY G N,EAKIN E G,et al.Associations between television viewing time and overall sitting time with the metabolic syndrome in older men and women:the Australian Diabetes,Obesity and Lifestyle study[J].J Am Geriatr Soc,2011,59(5):788-796.
[25]HENSON J,EDWARDSON C L,MORGAN B,et al.Associations of sedentary time with fat distribution in a high-risk population[J].Med Sci Sports Exerc,2015,47(8):1727-1734.
[26]PHILIPSEN A,HANSEN A L,JORGENSEN M E,et al.Associations of objectively measured physical activity and abdominal fat distribution[J].Med Sci Sports Exerc,2015,47(5):983-989.
[27]KESANIEMI Y K,DANFORTH E Jr,JENSEN M D,et al.Dose-response issues concerning physical activity and health:an evidence-based symposium[J].Med Sci Sports Exerc,2001,33(6 Suppl):S351-358.
[28]WARBURTON D E,CHARLESWORTH S,IVEY A,et al.A systematic review of the evidence for Canada′s Physical Activity Guidelines for Adults[J].Int J Behav Nutr Phys Act,2010,7:39.
[29]DONG L,BLOCK G,MANDEL S.Activities contributing to total energy expenditure in the United States:results from the NHAPS study[J].Int J Behav Nutr Phys Act,2004,1(1):4.
[30]KATZMARZYK P T,MASON C.The physical activity transition[J].J Phys Act Health,2009,6(3):269-280.
[31]JAKES R W,DAY N E,KHAW K T,et al.Television viewing and low participation in vigorous recreation are independently associated with obesity and markers of cardiovascular disease risk:EPIC-Norfolk population-based study[J].Eur J Clin Nutr,2003,57(9):1089-1096.
[32]DUVIVIER B M,SCHAPER N C,BREMERS M A,et al.Minimal intensity physical activity(standing and walking) of longer duration improves insulin action and plasma lipids more than shorter periods of moderate to vigorous exercise(cycling) in sedentary subjects when energy expenditure is comparable[J].PLoS One,2013,8(2):e55542.
[33]RUTTEN G M,SAVELBERG H H,BIDDLE S J,et al.Interrupting long periods of sitting:good STUFF[J].Int J Behav Nutr Phys Act,2013,10:1.
[34]林坚,赵红勤,黄雄昂,等.高强度间歇训练对肥胖女大学生体成分和血脂及空腹胰岛素水平的影响[J].中国全科医学,2016,19(18):2139-2144. LIN J,ZHAO HQ,HUANG X A,et al.Effect of high intensity interval training on the body composition,blood lipid and fasting insulin level of obese female college students[J].Chinese General Practice,2016,19(18):2139-2144.
[35]BLACK A E,COWARD W A,COLE T J,et al.Human energy expenditure in affluent societies:an analysis of 574 doubly-labelled water measurements[J].Eur J Clin Nutr,1996,50(2):72-92.
(本文编辑:吴立波)
Relationship between Physical Activity Patterns and Overweight and Obesity in Community Adult Residents
LIMi-huan,LIGuo-qiang,JIANGChong-min.SchoolofKinesiology,ShanghaiUniversityofSport,Shanghai200438,China
JIANGChong-min,InstituteofSportScience,GeneralAdministrationofSportofChina,Beijing100061,China;E-mail:jiangchongmin@263.net
Background Increasing physical activity is the top measure for promoting health,and its health effects have been observed in the incidence,development,and prognosis of overweight,obesity,and related chronic diseases.However,many sedentary behaviors,separated from levels of medium to high physical activities,can increase the risks of overweight,obesity,and related chronic diseases.Therefore,only focusing on medium to high physical activities or sedentary behaviors is insufficient for evaluating the real relationships between physical activities and obesity.Association between combinations of various physical activities in daily life and overweight and obesity should be taken into consideration.Objective To explore the relationship between different physical activity patterns and overweight and obesity of adult residents in urban areas.Methods A total of 756 adult residents in Nanjing and Shanghai were the objects of the study.They were selected through multistage random sampling method from March to October in 2013.Data on gender,age,education level,height,weight,and history of chronic diseases were collected.Physical activity log investigation was used to gather the activity duration time of the objects for consecutive seven days.Factor analysis was applied to analyze the objects′ physical activity patterns.The objects were divided into four groups(Q1,Q2,Q3,and Q4),based on factor scoring of the physical activity patterns with equal interval.Results Overweight and obesity rates accounted for 33.2%(251/756) and 6.3%(48/756),respectively.The overweight and obesity rates of male objects were higher than those of female objects(χ2=23.80,8.79;P<0.01).When the overweight rates of objects among different age groups were compared,the differences were statistically significant(χ2=23.20,P<0.05).The first four factors were selected as the main factors through factor analysis.The characteristic roots were 2.52,2.00,1.45,and 1.18,with an accumulative contribution rate of 57.5%.The four factors were named as sedentary pattern,the housebound pattern,the balance pattern,and the exercise pattern.The Logistic regression analysis showed that,after correction of confounding factors,the sedentary pattern was the risk factor of overweight and obesity,and the housebound pattern was the protective factor of overweight and obesity(P<0.05).Association between the balance pattern and overweight and obesity or association between the exercise pattern and overweight and obesity was not found(P>0.05).When the time percentage of medium intensity activities and high intensity activities between group Q1 and group Q4 in the sedentary pattern were compared,the differences were not statistically significant(P>0.05).The time percentage of sedentary activities of group Q1 was lower than that of group Q4,the low intensity activities time percentage of group Q1 was higher than that of group Q4,and the total energy consumption of group Q1 was higher than that of group Q4 in the sedentary pattern(P<0.05).When the time percentage of medium intensity activities and high intensity activities were compared between group Q1 and group Q4 in the housebound pattern,the differences were not statistically significant(P>0.05).The time percentage of sedentary activities of group Q1 was higher than that of group Q4,the time percentage of low intensity activities of group Q1 was lower than that of group Q4,and the total energy consumption of group Q1 was lower than that of group Q4 in the housebound pattern(P<0.05).When the time percentage of activities of all intensity levels and total energy consumption were compared between group Q1 and group Q4 in the balance pattern and the exercise pattern,the differences were not statistically significant(P>0.05).Conclusion The sedentary pattern dominated by sedentary activities is the risk factor of overweight and obesity.The exercise pattern cannot completely protect individuals from the negative effect of sedentary activities on health.The housebound pattern,in which high amount of energy can be consumed through accumulation of low intensity physical activities,can offset the negative effect of sedentary activities on health.
Overweight;Obesity;Physical effort;Sedentary lifestyle;Adult
国家科技支撑计划资助项目(2012BAK23B02)
200438上海市,上海体育学院运动科学学院(李米环);陕西理工大学体育学院(李国强);国家体育总局体育科学研究所(江崇民)
江崇民,100061北京市,国家体育总局体育科学研究所;E-mail:jiangchongmin@263.net
R 194.3
A
10.3969/j.issn.1007-9572.2016.32.008
2016-02-15;
2016-08-03)

