Flapping dynamics of a flexible propulsor near ground
Jaeha Ryu·Sung Goon Park·Boyoung Kim·Hyung Jin Sung
Flapping dynamics of a flexible propulsor near ground
Jaeha Ryu1·Sung Goon Park1·Boyoung Kim1·Hyung Jin Sung1
©The Chinese Society of Theoretical and Applied Mechanics;Institute of Mechanics,Chinese Academy of Sciences and Springer-Verlag Berlin Heidelberg 2016
The flapping motion of a flexible propulsor near the ground was simulated using the immersed boundary method.The hydrodynamic benefits of the propulsor near the ground were explored by varying the heaving frequency (St)of the leading edge of the flexible propulsor.Propulsion near the ground had some advantages in generating thrust and propelling faster than propulsion away from the ground.The mode analysis and flapping amplitude along the Lagrangian coordinate were examined to analyze the kinematics as a function of the ground proximity(d)and St. The trailing edge amplitude(atail)and the net thrustwere influenced by St of the flexible propulsor.The vortical structures in the wake were analyzed for different flapping conditions.
Flexible propulsor·Ground effect·Immersed boundary method·Mode analysis
DOI 10.1007/s10409-016-0571-5
1 Introduction
Many biological propulsors,such as birds,fish,and micro-flies,exhibit a lower cost of transport[1]or require less power to achieve a certain propulsion speed[2]near the ground. Certain advantages achieved by propelling near the ground are called ground effects.Well-known examples of ground effects are gliding birds,sediment particles,and benthic fish. To reveal the hydrodynamic benefits of a flexible propulsornear the ground,some questions are posed:How does the ground offer hydrodynamic benefits to flexible propulsors? Which parameters of flexible propulsors influence the ground effect?What is the relation between the dynamics and kinematics of flexible propulsors near the ground?
The ground effects are classified into steady and unsteady ground effects.A steady ground effect is achieved by a static lifting object moving parallel to the ground,while an unsteady ground effect is created when an object oscillates perpendicular to the ground.The hydrodynamic benefits of the steady ground effect are a large lift force induced by slow flow beneath a static lifting object and a smaller drag induced by the vortices between a flexible propulsor and the ground. These benefits of the steady ground effect are widely utilized by gliding birds and fish in schools[3,4].The ground effect acts to decrease the induced drag and increase the liftto-drag ratio of the wings for birds gliding horizontally near the ground[5].The ground proximity influences the gliding performance of birds as they glide near solid boundaries. Hainsworth[6]showed a ground effect related to various flight formations.Wing tip spacing,which is the distance perpendicular to the flightpath between the wing tips of adjacent birds at a maximum span,is the major parameter.The propelling performance of the benthic fish Agonopsis vulsa was examined by Nowroozi et al.[7].The fish overcomes substantial negative buoyancy while generating forward thrust. The wing performance associated with its morphometry for identifying the characteristics of flight was determined by Park and Choi[8],who explored the hydrodynamic benefits,reduced drag,and fast propelling speed achieved by means of the ground effect in various configurations of flying fish.In contrast,the unsteady ground effect has been less explored than the steady ground effect.A few theoretical [9]and experimental[10,11]studies have been performed.Iosilevskii[12]addressed unsteady aerodynamic forces acting on a wing oscillating in a uniform flow in the presence of a distant flag ground.An asymptotic theory was applied to obtain hydrodynamic loads acting on a hydrofoil oscillating below the water.Quinn et al.[13]investigated the unsteady ground effect by measuring net thrust and self-propelled swimming speed.Many hydrodynamic benefits were obtained for a flexible propulsor propelling near the ground.Except for Quinn et al.[13],most earlier studies were conducted on rigid objects.
In the present study,the immersed boundary(IB)method was adopted to simulate a flexible propulsor near the ground. Using the IB method,the structure was separated into the massive part and the massless part.The fluid governing equations and the solid governing equations were independently solved using the interaction momentum forcing term[14–16].The momentum forcing was added to induce the fluid velocity equivalent to the velocity of the IB and to enforce the no-slip boundary condition along the IB[17,18].The IB method can resolve the dynamics of a flexible body without grid regeneration.Many studies have been conducted using the IB method for applications.The dynamics of an oscillating cascade in turbomachinery was explored using the IB method[19].Kim et al.[20]exhibited the interaction modes between two tandem flexible flags and examined the optimal modes for drag reduction.Biomimetic studies using the IB method are numerous.Uddin et al.[21,22]investigated the efficiency offish schooling for drag reduction.Fish schooling behaviors are not merely a social behavior but a smart way to improve movement efficiency.Zhu et al.[23]simulated a self-propelled plunging foil using the IB method.The foil moved forward with a heaving motion of the leading edge in a quiescent flow.Zhu et al.[24]fleshed out a rationale for the hydrodynamic benefits experienced by the downstream flag in a system comprising two self-propelling flags.The IB method was extended to heat transfer problems[25–27]. Liao and Lin[25]discussed the difference between natural and forced convection flows with a moving rigid embedded object.
The objective of the present study was to explore the ground effect of a flexible propulsor using the IB method. The kinematics of a flexible propulsor near the ground were analyzed by varying the trailing edge amplitude(atail),the modal contributions,the ground proximity(d),and the flapping amplitude(a)along the Lagrangian coordinate.We explored dynamics such as the net thrustthe propulsive efficiency(η),and the self-propelled swimming speed(uSPS)by varying the heaving frequency(St)of the leading edge.The flow field around a flexible propulsor near the ground was visualized.The hydrodynamic benefits obtained from the unsteady ground effect were examined.

Fig.1 Schematic diagram of flexible propulsor near ground
2 Problem formulation
A schematic diagram of the flexible propulsor and the coordinate system is shown in Fig.1.A flexible flag with a heaving motion was subjected to the near-wall region.Noslip boundary conditions were applied at the wall,and a Poiseuille flow with a maximum velocity U∞was applied to the upstream flow[13].The interaction between the flexible propulsor and the surrounding fluid was modeled using the IB method,in which the momentum forcing was added to the Navier–Stokes equations.The fluid was governed by the continuity equation and the incompressible Navier–Stokes equations

where u is the velocity vector,p is the pressure,ρ0is the flow density,μ is the dynamic viscosity,and f is the momentum forcing used to enforce the no-slip boundary conditions along the immersed boundary.
The position of the flexible propulsor is denoted by X(s) and governed by the equation

where s is the arc length,ρ1is the density difference between fluid and flag,T is the tension force along the flag axis, γ is the bending rigidity,and F is the Lagrangian forcing exerted on the flag by the flow.Equations(1)–(3)were nondimensionalized using various characteristic scales.The flow density ρ0was used for normalizing the density,the flexible flag length L for the length,the maximum velocity of a Poiseuille flow U∞for the velocity,L/U∞for the time,for the pressure p,for the tension force T,/L for the momentum exerted on the fluid f,for the Lagrangian momentum F,andfor the bend-ing rigidityγ.The nondimensionalized forms of Eqs.(1)and (3)are
where R e indicates the Reynolds number normalized by ρ0U∞L/μ,set to 200 in the present simulation.The nondimensional continuity equation took the form of Eq.(2).The flexible propulsor had a clamped leading edge and a free trailing edge.A heaving motion was applied at the clamped leading edge(s=0),

where aheadis the heaving amplitude of the leading edge, and S t is the frequency normalized by 2πU∞/L.We set ahead/L=0.1 in the present simulation.As shown in Fig.1, X0is(0,d),where d is the ground proximity.At the free trailing edge(s=L),

The momentum forcing term,F,which was added to the solid governing equation,was derived using the feedback law,

where α and β are large negative free constants(α=−1.74×10⁷,β=−2.60×10²)defined by Shin et al.[28], UIBis the fluid velocity on the IB obtained by interpolation, and U is the velocity of a flexible propulsor expressed by U=d X/d t.In Eq.(8),the fluid on the IB and the flexible propulsor are connected by a virtual stiff spring with damping.The IB and the flexible propulsor moved together owing to a stiff connection applied between the IB and the flexible propulsor.For this reason,the velocities of the fluid on the IB and the flexible propulsor were equal,leading to no-slip boundary conditions on the surface of the flexible propulsor.
The interaction force between the surrounding fluid and the flexible propulsor was obtained using the Dirac delta function.The velocity on the IB was interpolated according to

The Lagrangian forcing was distributed to the nearby grid points,

where the density ratio ρ=ρ1/(ρ0L)comes from nondimensionalization.We set ρ=1,indicating that the density of the flexible propulsor is two times larger than that of the fluid density(ρ0).Equations(8)and(10)show that the IB was forced to move along with the local fluid.In this study,the fluid equation was solved using the fractional step method[29],and the structure equation was solved based on the IB method[17]).Details regarding the numerical procedure can be found in Ref.[17].The Eulerian grid was uniformly distributed in the streamwise direction.In the spanwise direction,the Eulerian grid was uniformly distributed for 0≤ y/L≤8 and was stretched otherwise.The physical and numerical parameters for the present simulation are summarized in Table 1.Several trial calculations were repeated to reveal the sensitivity of the results to the domain and grid sizes.A domain size of8 L×8 L was chosen to show the vortical structures behind the flexible propulsor. Three grids were tested for the displacement of the trailing edge(Fig.2):Nx×Ny=257×257,513×513,and1025×1025.The outcome with the 513×513 grid was satisfactory in this simulation.

Table 1 Physical and numerical parameters
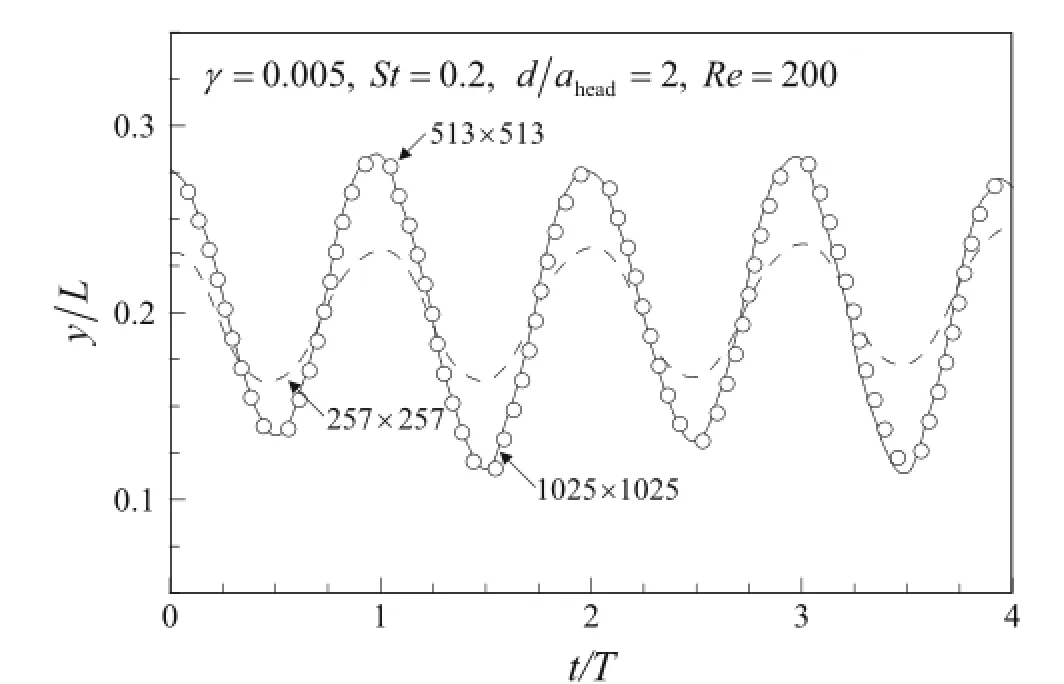
Fig.2 Grid convergence test
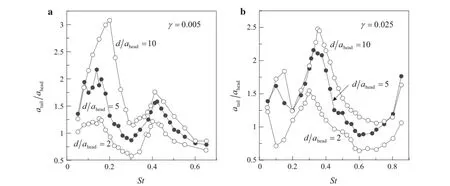
Fig.3 atailfor various d/ahead
3 Results and discussion
3.1 Kinematics of flexible propulsor
The hydrodynamic benefits for many biological swimmers cruising near the ground have recently attracted research interests,and those benefits are related to their swimming kinematics.The trailing edge amplitude(atail)is an important factor when it comes to analyzing the kinematics of propulsors.atailis a function of the Strouhal number(S t)normalized by 2πU∞/L,where L is the flexible flag length,and U∞is the maximum velocity of the flow.atailhas a local maximum at which the net thrustreaches a plateau[13,30]. Figure 3 shows the trailing edge amplitudes with various ground proximities(d)and bending rigidities(γ).When St is very low,atailshows a lack of consistency by varying the ground proximity(d/ahead).When St is high enough,atailhas a local maximum(high peak)and a local minimum(low peak).In Fig.3a,b,the values of St are almost the same for different ground proximities when the local high peaks and low peaks change withγ.atailis not large when the propulsor is close to the ground since the flow between the propulsor and the ground restrains flapping behavior.For γ=0.005, the low peaks appear at St of 0.3 and the high peaks at St of 0.15 and 0.4.For γ=0.025,the low peaks are present at St of 0.6 and the high-peaks are at St of 0.3.

Fig.4 Time-averaged modal contributions

Fig.5 Time-averaged flapping amplitudes along Lagrangian coordinate
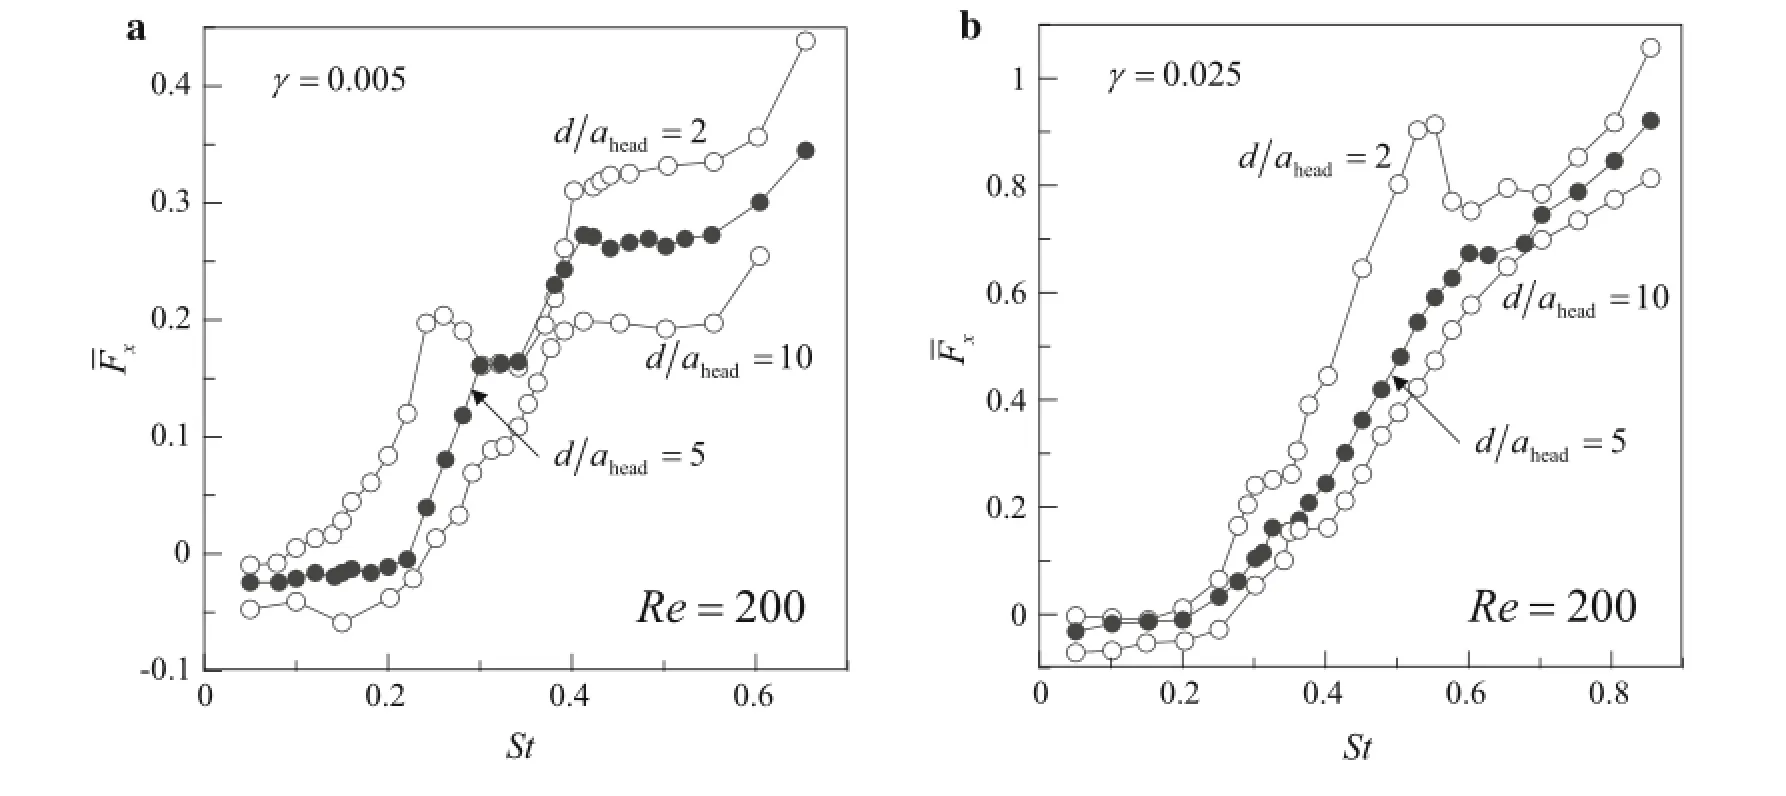
Fig.6 Time-averaged net thrust for St
Quinn et al.[30]showed that flexible propulsors near the ground experienced several dynamical modes as St varied. The orthonormal eigenfunctions(ξi)were defined from the Euler–Bernoulli beam equation[30].The modal contribution (Θi)was calculated by taking an inner product of the flag position with each eigenfunction(0<ξi<1).The modal contribution(Θi)was taken into account only when the leading edge passed through y=d and the time averaging was was conducted over the course of more than 20 heaving periods.Figure 4 shows the time-averaged modal contributions of each orthonormal eigenfunction for γ=0.005 and d/ahead=2.For the low St region(St<0.1),the flag flaps very slowly and is deflected very little during the flapping sequence.The first mode is dominant at St<0.1(Fig.3). When atailreaches the high peaks,i.e.,St=0.15 and 0.4 in Fig.3,the second and third modes are dominant(Fig.4). As St increases,the modes are excited sequentially.For St= 0.3,several orthonormal eigenfunctions are overlapped and mutually correlated.While multiple orthonormal eigenfunctions are interrupted,the kinematics of the flag is disturbed and ataildecreases.The overlapped mode restrains the flapping motion of the flag,leading to a decreased thrust(Fig.6). The modal contributions were generally lower than those in Quinn et al.[30]regardless of the value of St.Since the present simulation was conducted at relatively low Re,the flapping motion of the flexible propulsor was interrupted by the viscous incoming flow.
The time-averaged flapping amplitude along the flexible propulsor is one of the key factors in representing the flapping kinematics.Figure 5 illustrates the time-averaged flapping amplitudes along the Lagrangian coordinate(a)with various St.As illustrated in Fig.3,the trailing edge of the propulsor shows high peaks at St=0.15 and 0.4,and both atailand a are high.The a measured at St=0.2,0.3,and 0.35 are relatively low compared to those at St=0.15 and 0.4.Regardless of the value of St,a local minimum is present at the first extreme value from the trailing edge.As St increases,every local minimum or local maximum is shifted to the trailing edge. The first local minimum point is shifted from s/L=0.8 to s/L=0.9 as St increases.When the dominant dynamical mode is transitioned from the second mode(St=0.15) to the third mode(St=0.4),an additional local maximum point appears near the leading edge(s/L=0.3).As the dynamical mode is shifted to the next mode,the additional local maximum point or minimum point appears alternately near the leading edge.The superimposed dynamical modes emerge at the low peaks,while one dominant dynamical mode is observed at the high peak.The flapping amplitude along the Lagrangian coordinate is low at the low peak since the dynamical modes are significantly superimposed.At the lower peak(St=0.3),the flapping amplitude is minimizedowing to the superimposition of the dynamical modes.
3.2 Hydrodynamic benefits due to ground effect


Fig.7 Propulsive efficiency
As discussed in Fig.6,a slow oncoming flow is beneficial for a propulsor to generate a thrust since the drag force exerted on the propulsor by the surrounding fluid is reduced.Quinn et al.[30]showed that the flow velocity has an inversely proportional relation with the net thrust.In the present study,the net thrust is reduced as the flow velocity increases.Figure 8 demonstrates time-averaged net thrust with respect to various flow velocities at the high peaks.The flow velocity(u)at X0(0,d)was chosen as one of the governing parameters and was increased as Re increased.The high flow velocity disturbed the flapping motion of the flag and led to a decrease in the thrust.The drag increased as the flow velocity increased. For those reasons,the net thrust generation was disturbed by a high flow velocity(Fig.8).When the flow velocity increased, the net thrust decreased gradually and finally reached a negative net thrust region.The decrease in the net thrust was mainly affected by the flow velocity,not the ground proximity.The flow velocity with zero net thrust was defined as the self-propelled swimming speed(uSPS)[13].When the propulsor moved at the self-propelled swimming speed,it experienced no external forces from the upstream flow.
As mentioned earlier,the self-propelled swimming speed is the flow velocity when the thrust generated by the propulsors is equivalent to the drag exerted on the propulsors by the upstream flow.A high self-propelled swimming speed indicates that the flag propels quickly for a given input force. Figure 9 shows self-propelled swimming speeds as a function of the ground proximity at the high peak.The self-propelled swimming speed was normalized by the flow velocity at Re of 200.As depicted in Fig.8,the self-propelled swimming speed was high when the flag flapped near the ground for the highpeaks.The self-propelled swimming speed decreased linearly as the ground proximity increased.The self-propelled swimming speed near the ground(d/ahead=2)increased by about 58%of the self-propelled swimming speed far from the ground(d/ahead=10)for different bending rigidities. The propulsors can propel about 58%faster near the ground when the equivalent heaving power is given.The propulsors propelling near the ground can take advantages of the increased propulsion velocity for a given input force or the reduced input force to achieve the same propulsion velocity.

Fig.8 Time-averaged net thrust at high peaks
Only the high-peak case was considered to measure the self-propelled swimming speed[13].The net thrust generated at the low-peak was meaningful as the flow velocity increased and related to the trailing edge amplitude.Figure 9 depicts time-averaged net thrust and trailing edge amplitude with respect to various flow velocities at the low peaks.As shown in Fig.10a,b,the trailing edge amplitude increased continuously and plateaud as the flow velocity increased. All the plateaus appeared when the trailing edge amplitude was equivalent to the heaving amplitude(atail/ahead=1.0). When the trailing edge amplitude was lower than the heaving amplitude,the transverse fluttering behavior of the trailing edge was confined to the wake region affected by the heaving leading edge.The flow velocity in the wake region was lower than that of open flow owing to the reduced drag exerted on the trailing edge.For this region(atail/ahead<1.0),the net thrust and the trailing edge amplitude increased as the flow velocity increased.Since the kinematics of the trailing edge was interrupted by upstream flow,the trailing edge amplitude reached a plateau(atail/ahead=1.0)as the flow velocity increased.The fast flow velocity outside of the wake region increased drag and disturbed the kinematics of the trailing edge.The net thrust was maximized,while the trailing edge amplitude reached a plateau.When the trailing edge amplitude was higher than the heaving amplitude (atail/ahead> 1.0),the net thrust decreased continuously because of the increased drag.After the plateau,the net thrust also decreased gradually(Fig.10).This maximized net trust was present at the low peak.As shown in Fig.10a,the net thrust at d/ahead=5 was larger than that at d/ahead=2. This is consistent with that of St=0.35(low-peak)in Fig.5. The net thrust at d/ahead=5 was maximized in the region u/uRe=200=1,but the net thrust at d/ahead=2 was not in the region.
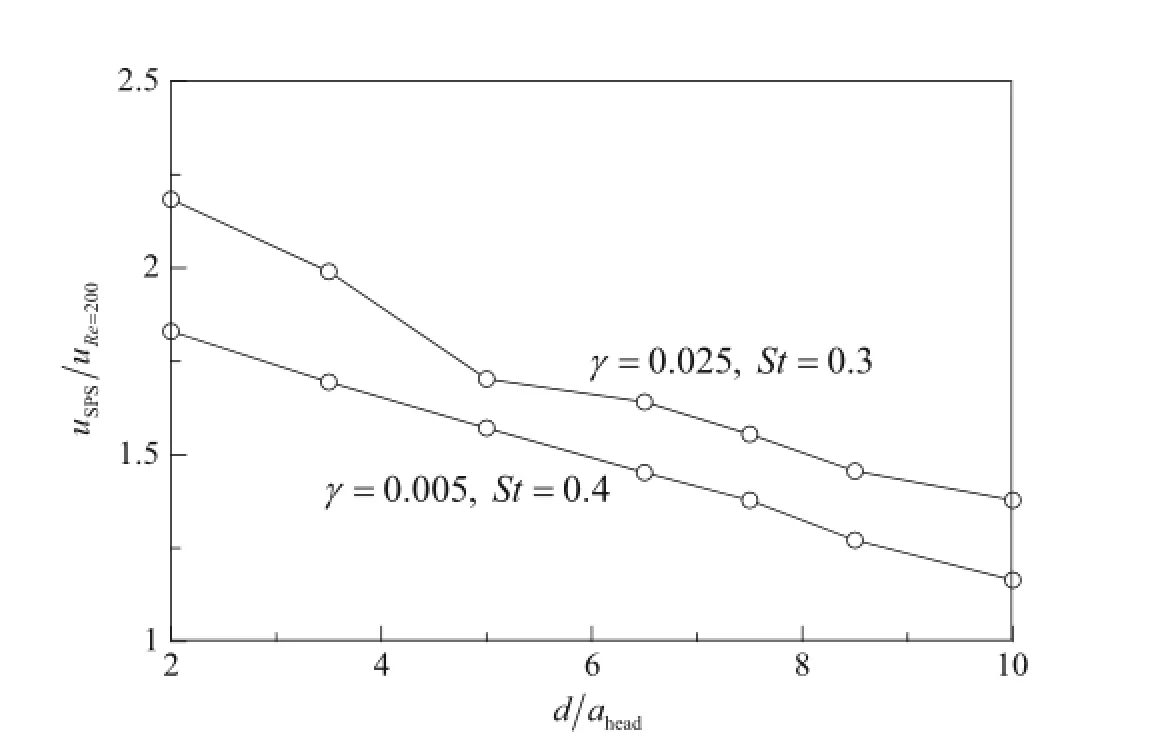
Fig.9 Self-propelled swimming speed against d/ahead
3.3 Vortical structure interaction
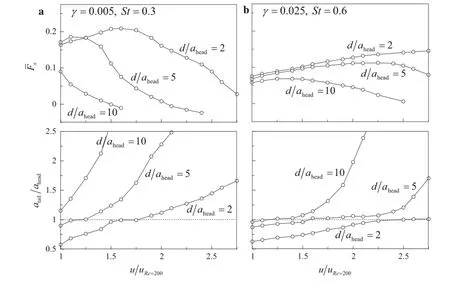
Fig.10 Time-averaged net thrust and trailing edge amplitude at low peaks
Figure 11 displays vortical structures around a flexible propulsor with various ground proximities when the leading edge of the propulsor crossed the line,y=d.The vorticity contour is identified when the absolute vorticity is higher than 10%of the maximum vortex strength.Poiseuille flow at the inlet leads to negative vortical structures(red contour) being generated near the bottom channel wall and positive vortical structures(green contour)formed underneath the propulsor(Fig.11b).When the propulsor was positioned at d/ahead=2,a back flow was generated near the ground and the flow velocity at the space between the propulsor and the ground became slow.This back flow generation induced the drag reduction.This gave rise to high net thrust near the ground.The back flow separated the positive vortical structure on the underside of the propulsor.The negative vortical structure was induced underneath the propulsor by the back flow generated near the ground,unlike the positive vortical structures that formed only on the underside of the propulsor at d/ahead=10.When the propulsor was far from the wall (d/ahead=10),the upstream flow easily penetrated into the gap between the propulsor and the ground.A counter vortical structure was formed only while the propulsor was positioned near the ground.

Fig.11 (Color online)Vortical structures around flexible propulsor and ground
Figure 12 displays sequential vortical structures at the low peak(St=0.3)and high peak(St=0.4)during one flapping period.For both cases,negative votical structures were generated at the leading edge when the leading edge moved downwardand positive vortical structures were generated at the upward movement of the leading edge.As shown in Fig.5,the flapping amplitude of the propulsor at the low peak was low for all flag positions and reduced the strength of the vortical structures. The back flow was accordingly weakened and the hydrodynamic benefit was not obtained by the back flow for the low peak(Fig.12a).For the high peak(Fig.12b),the back flow was intensified and the advantage was greatest.Only for the high peak did the positive vortical structures detached at the trailing edge move upward since the positive vortical structure was intensified[31].The negative vortical structures on the ground were absorbed into the positive vortical structures when those vortical structures escaped the space between the propulsor and the ground.The high net thrust was generated when its leading edge moved downward[30].The back flow was induced only when the leading edge moved downward.
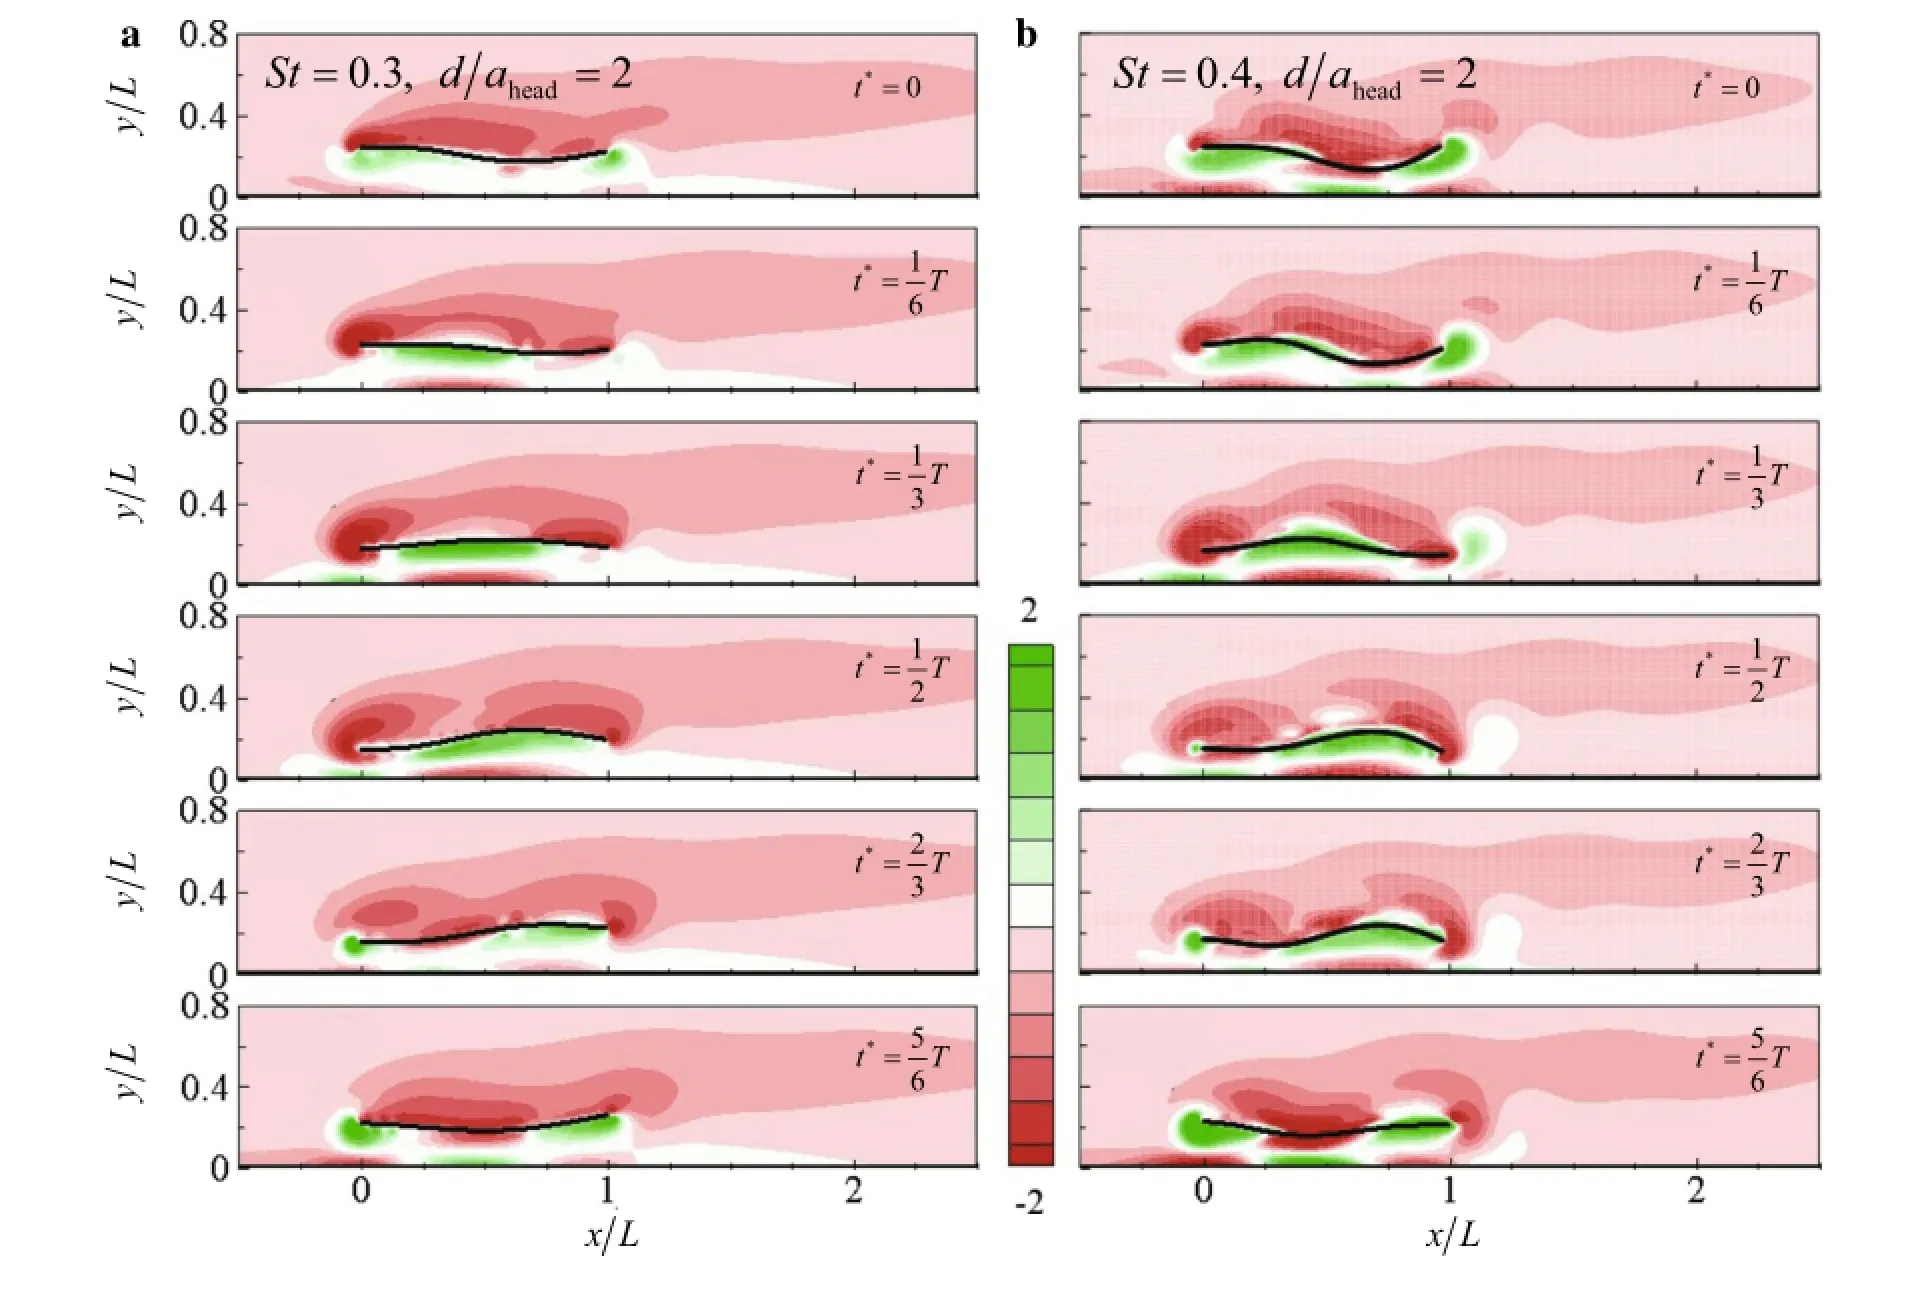
Fig.12 (Color online)Sequential vortical structure formation process around flexible propulsor and ground.?(low peak).? (high peak)
4 Conclusions
We simulated the dynamics of a flexible propulsor with a clamped leading edge and a free trailing edge.The simulation was conducted using the IB method,in which the solid motion equation and the fluid motion equation were solved separately by adding the interaction momentum forcing term.The hydrodynamic benefits of the flexible propulsor by the ground effect were discussed within the framework of dynamics and kinematics.The trailing edge amplitude presented the high and low peaks.Each peak showed distinct differences in terms of both the dynamics and the kinematics.The high peak of the trailing edge amplitude showed the domination of the orthonormal eigenfunctions.The orthonormal eigenfunctions were defined from the Euler–Bernoulli beam theory,and the modal contributions were calculated by taking an inner product of the flag position with each eigenfunction.As the mode changed,the kinematics of the propulsor were affected accordingly.The time-averaged net thrust reached a plateau at the high peak;otherwise the time-averaged net thrust was influenced dramatically by the ground proximity.When the propulsor was close to the ground(d/ahead=2),the flow between the propulsor and the ground interrupted the kinematics and disturbed the thrust production.The disturbance of the thrust production did not show when the propulsors were positioned far enough from the ground(d/ahead=10).The self-propelled swimming speed near the ground(d/ahead=2)increased by approximately 58%of the self-propelled swimming speed far from the ground(d/ahead=10)for both the different bending rigidity cases.The propulsors could propel approximately 58%faster near the ground with the equivalent heaving power.All the plateaus for the net thrust generated at the low peak appeared when the trailing edge amplitude was equivalent to the heaving amplitude(atail/ahead=1.0).When the propulsor was positioned at d/ahead=2,a back flow was generated near the ground and the flow velocity at the space between the propulsor and the ground became slow.The back flow was accordingly weakened and the hydrodynamic benefit was not obtained by the back flow for the low peak.For the high peak,the back flow was intensified and the advantage was the greatest.
Acknowledgments This work was supported by the Creative Research Initiatives(Grant 2016-004749)program of the National Research Foundation of Korea(MSIP).
References
1.Webb,P.W.:The effect of solid and porous channel walls on steady swimming of steelhead trout Oncorhynchus mykiss.J.Exp.Biol. 178,97–108(1993)
2.Blake,R.W.:The energetics of hovering in the mandarin fish(synchropus picturatus).J.Exp.Biol.82,25–33(1979)
3.Baudinette,R.V.,Schmidt-Nielsen,K.:Energy cost of gliding flight in herring gulls.Nature 248,83–84(1974)
4.Rayner,J.M.V.:On the aerodynamics of animal flight in ground effect.Philos.Trans.R.Soc.B 334,119–128(1991)
5.Blake,R.W.:Mechanics of gliding birds with special reference to the influence of ground effect.J.Biomech.16,649–654(1983)
6.Hainsworth,F.R.:Induced drag savings from ground effect and formation flight in brown pelicans.J.Exp.Biol.135,431–444 (1988)
7.Nowroozi,B.N.,Strother,J.A.,Horton,J.M.,et al.:Whole-body lift and ground effect during pectoral fin locomotion in the northern spearnose poacher(agonopsis vulsa).J.Zool.112,393–402(2009)
8.Park,H.,Choi,H.:Aerodynamic characteristics of flying fish in gliding flight.J.Exp.Biol.213,3269–3279(2010)
9.Tanida,Y.:Ground effect in flight.JSME Int.J.Ser.B.44,481–486 (2001)
10.Truong,T.V.,Byun,D.,Kim,M.J.,et al.:Aerodynamic forces and flow structures of the leading edge vortex on a flapping wing considering ground effect.Bioinspiration Biomim.8,036007(2013)
11.Blevins,E.,Lauder,G.V.:Swimming near the substrate:a simple robotic model of stingray locomotion.Bioinspiration Biomim.8, 016005(2013)
12.Iosilevskii,G.:Asymptotic theory of an oscillating wing section in weak ground effect.Eur.J.Mech.B/Fluids 27,477–490(2008)
13.Quinn,D.B.,Lauder,G.V.,Smits,A.J.:Flexible propulsors in ground effect.Bioinspiration Biomim.9,036008(2014)
14.Peskin,C.S.:The immersed boundary method.Acta Numer.11, 479–517(2002)
15.Zhu,L.,Peskin,C.S.:Simulation of a flapping flexible filament in a flowing soap film by the immersed boundary method.J.Comput. Phys.179,452–468(2002)
16.Kim,Y.,Peskin,C.S.:Penalty immersed boundary method for an elastic boundary with mass.Phys.Fluids 19,053103(2007)
17.Huang,W.-X.,Shin,S.J.,Sung,H.J.:Simulation of flexible filaments in a uniform flow by the immersed boundary method.J. Comput.Phys.226,2206–2228(2007)
18.Huang,W.-X.,Sung,H.J.:An immersed boundary method for fluid-flexible structure interaction.Comput.Methods Appl.Mech. Eng.198,2650–2661(2009)
19.Zhong,G.,Sun,X.:New simulation strategy for an oscillating cascade in turbomachinery using immersed-boundary method.J. Propul.Power 25,312–321(2009)
20.Kim,S.,Huang,W.-X.,Sung,H.J.:Constructive and destructive interaction modes between two tandem flexible flags in viscous flow.J.Fluid Mech.661,511–521(2010)
21.Uddin,E.,Huang,W.-X.,Sung,H.J.:Interaction modes of multiple flexible flags in a uniform flow.J.Fluid Mech.729,563–583(2013)
22.Uddin,E.,Huang,W.-X.,Sung,H.J.:Actively flapping tandem flexible flags in a viscous flow.J.Fluid Mech.780,120–142(2015)
23.Zhu,X.,He,G.,Zhang,X.:Numerical study on hydrodynamic effect of flexibility in a self-propelled plunging foil.Comput.Fluids 97,1–20(2014)
24.Zhu,X.,He,G.,Zhang,X.:Flow-mediated interactions between two self-propelled flapping filaments in tandem configuration. Phys.Rev.Lett.113,238105(2014)
25.Liao,C.-C.,Lin,C.-A.:Simulation of natural and forced convection flows with moving embedded object using immersed boundary method.Comput.Methods Appl.Mech.Eng.213–216,58–70 (2012)
26.Liu,Y.Z.,Kang,W.,Sung,H.J.:Assessment of the organization of a turbulent separated and reattaching flow by measuring wall pressure fluctuations.Exp.Fluids 38,485–493(2005)
27.Nagendra,K.,Tafti,D.K.,Viswanath,K.:Anew approach for conjugate heat transfer problems using immersed boundary method for curvilinear grid based solvers.J.Comput.Phys.267,225–246 (2014)
28.Shin,S.J.,Huang,W.-X.,Sung,H.J.:Assessment of regularized delta functions and feedback forcing schemes for an immersed boundary method.Int.J.Numer.Methods Fluids 58,263–286 (2008)
29.Kim,K.,Baek,S.-J.,Sung,H.J.:An implicit velocity decoupling procedure for incompressible Navier-Stokes equations.Int. J.Numer.Methods Fluids 38,125–138(2002)
30.Quinn,D.B.,Lauder,G.V.,Smits,A.J.:Scaling the propulsive performance of heaving flexible panels.J.Fluid Mech.738,250–267 (2014)
31.Park,T.S.,Sung,H.J.:Development of a near-wall turbulence model and application to jet impingement heat transfer.Int.J.Heat Fluid Fl.22,10–18(2001)
✉ Hyung Jin Sung hjsung@kaist.ac.kr
1Department of Mechanical Engineering,Korea Advanced Institute of Science and Technology,291 Daehak-ro, Yuseong-gu,Daejeon 34141,Korea
3 February 2016/Revised:21 March 2016/Accepted:11 April 2016/Published online:1 June 2016
- Acta Mechanica Sinica的其它文章
- Plaque components affect wall stress in stented human carotid artery:A numerical study
- Time-delay identification for vibration systems with multiple feedback
- Thermoelastic analysis of multiple defects with the extended finite element method
- Static and dynamic responses of a microcantilever with a T-shaped tip mass to an electrostatic actuation
- Closed-form solutions for free vibration of rectangular FGM thin plates resting on elastic foundation
- A semi-analytical approach for calculating the equilibrium structure and radial breathing mode frequency of single-walled carbon nanotubes

