Empirical analysis of airport network and critical airports
Cong Wei,Hu Minghua,Dong Bin,Wang Yanjun,*,Feng Cheng
aCollege of Civil Aviation,Nanjing University of Aeronautics and Astronautics,Nanjing 211106,China
bNational Key Laboratory of Air Traffic Flow Management,Nanjing 211106,China
cThe 28th Research Institute of China Electronics Technology Group Corporation,Nanjing 210000,China
Empirical analysis of airport network and critical airports
Cong Weia,b,Hu Minghuaa,b,Dong Bina,b,Wang Yanjuna,b,*,Feng Chengc
aCollege of Civil Aviation,Nanjing University of Aeronautics and Astronautics,Nanjing 211106,China
bNational Key Laboratory of Air Traffic Flow Management,Nanjing 211106,China
cThe 28th Research Institute of China Electronics Technology Group Corporation,Nanjing 210000,China
Airport network;Critical airport;Spatial correlation;Spectral clustering;Power-law distribution;Power spectra
Air transport network,or airport network,is a complex network involving numerous airports.Effective management of the air transport system requires an in-depth understanding of the roles of airports in the network.Whereas knowledge on air transport network properties has been improved greatly,methods to find critical airports in the network are still lacking.In this paper,we present methods to investigate network properties and to identify critical airports in the network.A novel network model is proposed with airports as nodes and the correlations between traffic flow of airports as edges.Spectral clustering algorithm is developed to classify airports.Spatial distribution characteristics and intraclass correlation of different categories of airports are carefully analyzed.The analyses based on the fluctuation trend of distance-correlation and power spectrum of time series are performed to examine the self-organized criticality of the network.The results indicate that there is one category of airports which dominates the self-organized critical state of the network.Six airports in this category are found to be the most important ones in the Chinese air transport network.The flights delay occurred in these six airports can propagate to the other airports,having huge impact on the operation characteristics of the entire network.The methods proposed here taking traffic dynamics into account are capable of identifying critical airports in the whole air transport network.
1.Introduction
As the important components of air transport network,airports have a great impact on the operational performance of the air transport system.For instance,the European Organization for the Safety of Air Navigation(EUROCONTROL)holds a view that ‘‘understanding the variety of airports in Europe,their distribution,their traffic patterns,their aircraft mix,their strengths and their weakness is essential to understanding the strengths of the whole air traffic network”.1Giventhe geographic locations,demographics and economics,airports play different roles in the air transport system.Special states of an airport,such as flights delay and congestion,can propagate to the other airports,and may finally disseminate over the whole network.There is a ‘‘do less for more” effect of identifying critical airports in the network when managing the air transport system.However,there is no existing universal method or criteria to identify whether an airport is critical.
In the past decades,researchers and engineers have long sought the way to assess the performance of airport.In the field of performance assessment,key performance areas(KPAS)are determined based on airport operation characteristics at first.Then key performance indicators(KPIS)are selected according to the KPAS.2,3Capacity,delay,and safety are the most common KPAS that have been widely investigated in the past.As one of the most important KPAS,capacity is normally evaluated based on mathematical models or simulation models.Airport’s efficiency can be reflected by capacities under certain time horizons and operating conditions.4–6Parameters,such as punctuality,predictability,flight ef ficiency,and on-time performance,can be derived from flights delays.7–9Blom et al.constructed multi-agent models to assess safety risk of airport operation.10–12Safety level of airports can also be reflected through statistics such as rate of accidents/serious incidents/incidents.2,3Integrated comprehensive transportation capability of an airport can be analyzed in terms of instrument flight rules(IFR)flights,average number of annual IFR movements,average number of annual passengers,passengers per IFR movement,annual IFR movements per runway,and so on.2,3While some researchers apply data envelopment analysis to assess productivity,others decompose efficiency into production and efficiencies then assess them separately.13–15It is thought that critical airports can be identified by comparing these KPIS.A major drawback of such methods is that airports are treated as isolated objects rather than inter-connected parts in the network.
Research on complex networks has been advancing our knowledge of air transport network.The airport network structure has been widely studied both at the international levels and at domestic levels.Network properties have been examined,including degree distribution,average path length,diameter,clustering coefficient,in-out degree correlation,degree–degree correlation,clustering coefficient–degree correlation,betweenness,and rich-club coefficient.Empirical analyses show that air transport networks of Italy,Brazil,India,China,and the entire world are small-world networks.16–25From complex network perspective,airports with higher degree or betweenness are the important nodes in the air transport network.Although topological structures of the network may reveal the importance of the airport,it is unable to identify the dominant airports due to the lack of consideration of traffic flow and the interactions among airports.
Here we propose a novel method to analyze airport network and to identify the most critical airports.Airport-pair correlations are calculated using traffic flow data.Airport network is then constructed with airports as nodes and airportpair correlations as edges.All airports are categorized into groups by the proposed spectral clustering algorithm.Network topological structure is illustrated preliminarily.Distancecorrelation and power spectra are used to demonstrate whether airport network is a self-organized critical system.We assume that the network criticality originates from a certain group of airports.Finally,the most critical airports are identified by analyzing the distribution of critical state(delay)transition intervals.In a critical system,there should be critical components influencing the whole system.
The rest of this paper is organized as follows.In Section 2,the original data and processing principles are presented.In Section 3,spectral clustering algorithm is developed and applied to classify airports into different categories.Section 4 analyzes the relationships between airport-pair correlation and spatial distance.In Section 5,1/fspectra is used to probe the long-range memory effects of traffic flow time series.Section 6 gives the transition intervals distributions for the highest delay contribution rate of critical airports or critical airportpairs.Conclusions are presented in Section 7.
2.Data
Empirical flights data operated within mainland China from January 1st,2011 to June 30th,2011 was obtained from the Operation Center of Air Traffic Management Bureau.After data cleaning,there are about two million pieces of record of flight data left for analysis.Each piece of record contains key information of a flight,including departure airport,arrival airport,scheduled time of arrival/departure,and actual time of arrival/departure.
Since the main focus of this study is to identify critical airports in the network,the following airports are out of scope of analysis:
(1)International airports(including Hong Kong,Macao,and Taiwan).
(2)Airports without traffic flow.
(3)Airports with arriving traffic flow or departure traffic flow only.
In total,161 airports are examined in the presented work.
3.Airport network topology
Clustering algorithms have been used in various airport networks to discover potential community structures or to group airports with the maximum similarity.26–29To analyze airport network topology,airports with similar traffic patterns should be identified according to one or more characteristics.The spectral clustering algorithm is widely used which derives from spectral graph theory.It is assumed that each sample is regarded as nodeV.We assign weighted valueWto the edgeEaccording to the similarity among samples.Therefore,there is an undirected weighted graphG= (V,E).Clustering is then transformed to the optimal partitioning of the graph.30
Here we develop a spectral clustering algorithm to study airport network based on the correlations between time series of traffic flow of airports.We can uncover spatial topology of the correlation among airports through the clustering results and compare correlation characteristics of different categories of airports.30We assume that the sample set containsNairports,and letfi(t)represent the traffic flow value of theith airport at thetth slot.Tis number of time slots every day.The spectral clustering algorithm is depicted in the following.

Table 1 Clustering results.
Step 1.Calculate correlation ρijbetween each airport-pair’s traffic flow time seriesfiandfjbased on pearson correlation coefficient as,

where ρij∈ [-1,1].The flow time series of each airport lasts six months and has a temporal resolution of 15 min.
Step 2.Form the similarity matrix S ∈ Rn×n,whereSij=exp[-sin2(arccos(ρij)/2)/σ2].σ is a scaling parameter(which is usually taken as σ=1).31,32

Step 4.Calculate the eigenvectors{v0,v1,v2,···,vn-1}and corresponding eigenvalues 0 ≤ λ1≤ λ2≤ ···≤ λn-1ofL.
Step 5.In matrix perturbation theory,the gap between thekth and (k+1)th eigenvalues is defined as eigengap.33Here we form eigengap series{g1,g2,···,gn-1|gi=λi- λi+1}based on obtained eigenvectors.Then we find the first maximum value of the eigengap series in the sequence.The subscript of the value is the number of clusters:K.The larger the maximum value of eigengap is,the more stable the subspace formed by selectedknumber of eigenvectors is.33
Step 6.Selectklargest eigenvectors{v1,v2,···,vk}corresponding to eigenvalues and construct new matrix V=[v1,v2,···,vk]with eigenvectors.Form V′by normalizing each row of matrix V:

Step 7.Each row of V′is viewed as a point.Thenk-means clustering algorithm is performed on these points.
All airports in the investigated dataset are clustered into 6 categories.Clustering results are presented in Table 1,in which airports are given by International Civil Aviation Organization(ICAO)codes.
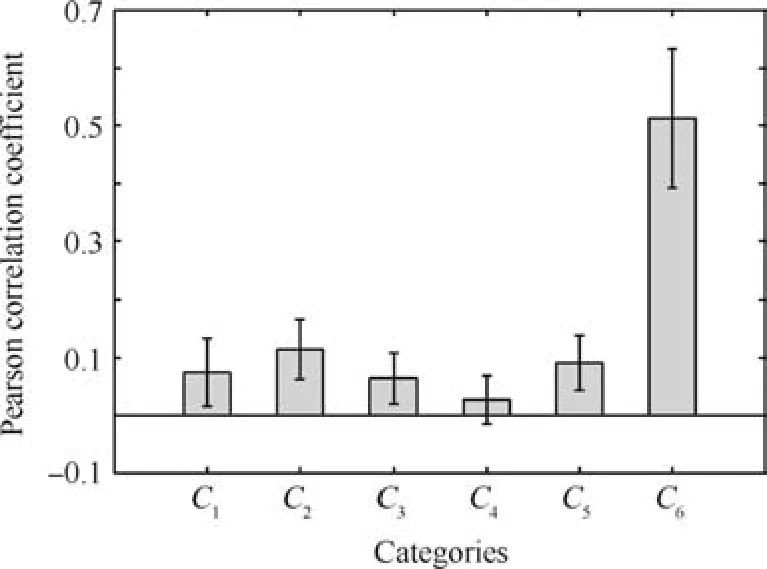
Fig.1 shows the spatial distribution of 6 categories of airports respectively.While the purple circles indicate the airports in the category,the black circles represent other airports in the network.The number of airports in each category varies from 18 to 34.Compared with partitioning clustering results,spatial distributions of spectral clustering results are overlapping.Multiple regions are involved in the distribution of each category.The overall range is large though most airports are concentrated in certain regions.The busiest airports in China mainland are classified into categoryC6(for instance,Beijing Capital international airport-ZBAA,Shanghai Pudong international airport-ZSPD,Shanghai Hongqiao international airport-ZSSS,Shenzhen Bao’an internationalairport-ZGSZ,Guangzhou Baiyun international airport-ZGGG,Chengdu Shuangliu international airport-ZUUU,etc.).Most of these airports are located in the southeastern coastal regions.Few airports are found to be in the central and northern parts of China.In western China,only urumchi diwopu international airport is inC6.Compared with other categories,airports inC4andC5are scattered nationwide.Airports ofC6are with the highest intraclass correlation,much higher than other categories.Airports ofC4are of the lowest intraclass correlation.All the five categories of airports show similar intraclass correlation fluctuation,except thatC6shows comparatively wider intraclass correlation fluctuation(Fig.2).
Clustering results indicate that air transport network has the following three features:(1)Since spectral clustering is based on the correlations between flow time series,airports in the same category have similar traffic features.(2)Traffic features are influenced by geographical positions.For example,most of the cities inC6are capital cities of the provinces or municipalities.(3)Similarities among airports are not affected by the geometrical distances.Therefore,airport network is characterized by a complex multi-core topology.
4.Spatial correlation
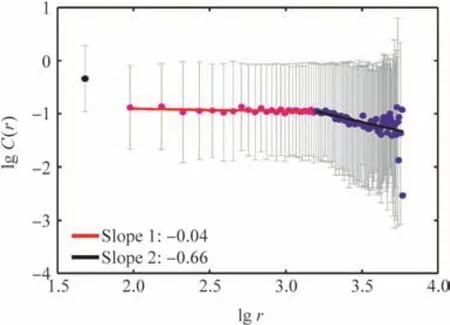
In order to further investigate spatial fluctuation of the correlations between airport-pairs,fluctuation trends of airport-pair correlation along with distance change are analyzed.Here we calculate the distancerbetween any two airports and the corresponding pearson correlationC(r).C(r)are the correlation coefficients ρijof the airport-pairs whose distance between the airports isr.Fig.3 shows the relationship betweenC(r)andr.Error bars indicate the standard deviations of ρijof the airports with the samer.C(r)=r-β,β =0.66.It is suggested that there exists power-law correlation at the level of the airport network.Long-range correlations usually emerge in systems with local interactions in the vicinity of a critical point.31The interactions between critical points and the effect of critical points on other points will disseminate in the entire network.Critical points are determined by the distance-correlation fluctuation trends of 6 categories of airports.

Fig.1 Spatial distribution of clustering results.

Fig.2 Means and standard deviations of correlation.

Fig.3 Fluctuation trend of distance-correlation.
The distance-correlation trends of each category of airports are plotted in Fig.4,while the exponents of six categories lie within[0.17,1.00].In previous section,correlation results show that intraclass correlation between airport-pairs ofC6(≈0.5)is much higher than the airports in other categories(Fig.2).The correlation,however,does not decay when increasing distance.In contrast,airports inC4exhibit power law decay with exponent higher than that of the entire network(exponent:1>0.66),while they have the lowest intraclass correlation.Except thatC5is with the smallest exponent,intraclass correlations in other classes decay faster than those in the entire network.According to the traffic characteristics and correlation ofC6,it can be concluded that airports ofC6should be critical points in the network.They share similar traffic features,and their strong mutual effect do not weaken when increasing distance.On the contrary,C4contains small regional airports with light traffic flow.These airports are influenced by critical ones in the network and propagate the influence to other relevant airports.Therefore,the correlation decays as distance increases.The decay may be faster due to the absence of critical points in these categories.
As shown in Fig.3,spatial correlation is divided into two ranges:(1)When the distancer<1585 km,the correlationC(r)between airport-pairs does not decay while increasing distancer(the slope is-0.04);(2)Whenr≥1585 km,there is a power-law relationship betweenC(r)andr:
5.Temporal correlation
Characteristics of flow time series can be explored with the power spectra from another perspective.Power spectra analysis is a frequency domain analysis method based on Fourier transform.PowerSpectraanswersthequestion ‘‘which frequencies contain the signal’s power?”.In power spectra analysis,the total energy of a time series is decomposed into components at various frequencies.The prominent period hidden in the time series can be judged according to variance contributions of various frequency waves.The corresponding frequency of the maximum value of the power spectra is the prominent frequency of the time series.34,35
The data of each airport lasts NUM days,withTtime slots per day.Let yfibe the traffic flow time series of theith airport with the length ofT×NUM.The classical spectral estimation method is described as follows.
Step 1.Calculate the average traffic flow time series of all airports in the network.


Fig.4 Distance-correlation trends of 6 categories of airports.
Step 2.Suppose that the average flow time series is a set of stationary random signals.Then,we calculate the autocorrelation function of the time series as

Step 3.Based on Wiener-Khinchin theorem,estimate the power spectra by taking the Fourier transform of autocorrelation function.

Power spectra of the average flow time series of entire network shows a clear power-law scaling behavior with scaling exponent α=-0.90 which is approximately equivalent to 1/f.Research hasshown that1/fspectraisan important phenomenon of self-organized criticality.Besides,1/fspectra indicates that long-range memory effects of time series transmit within a wide range of time scales.The results obtained here clearly indicate that air transport system is a critical system.
In the following,we further investigate the power spectra of 6 categories of airports.Power exponent ofC6is-0.9,while the exponents of the other categories lie within[-0.81,-0.66],which are shown in Fig.5.Therefore,the average traffic time series ofC6can be interpreted as 1/fspectra suggesting self-organized criticality.It can be concluded that the airport network is with self-organized criticality because of the 6th category of airportsC6,which dominates the overall characteristics of the entire airport network.This is in accordance with previous results on the evolution of the spatial correlation.The airports inC6,as key nodes of the airport network,have a great impact on the entire network.
6.Distribution of state transition intervals
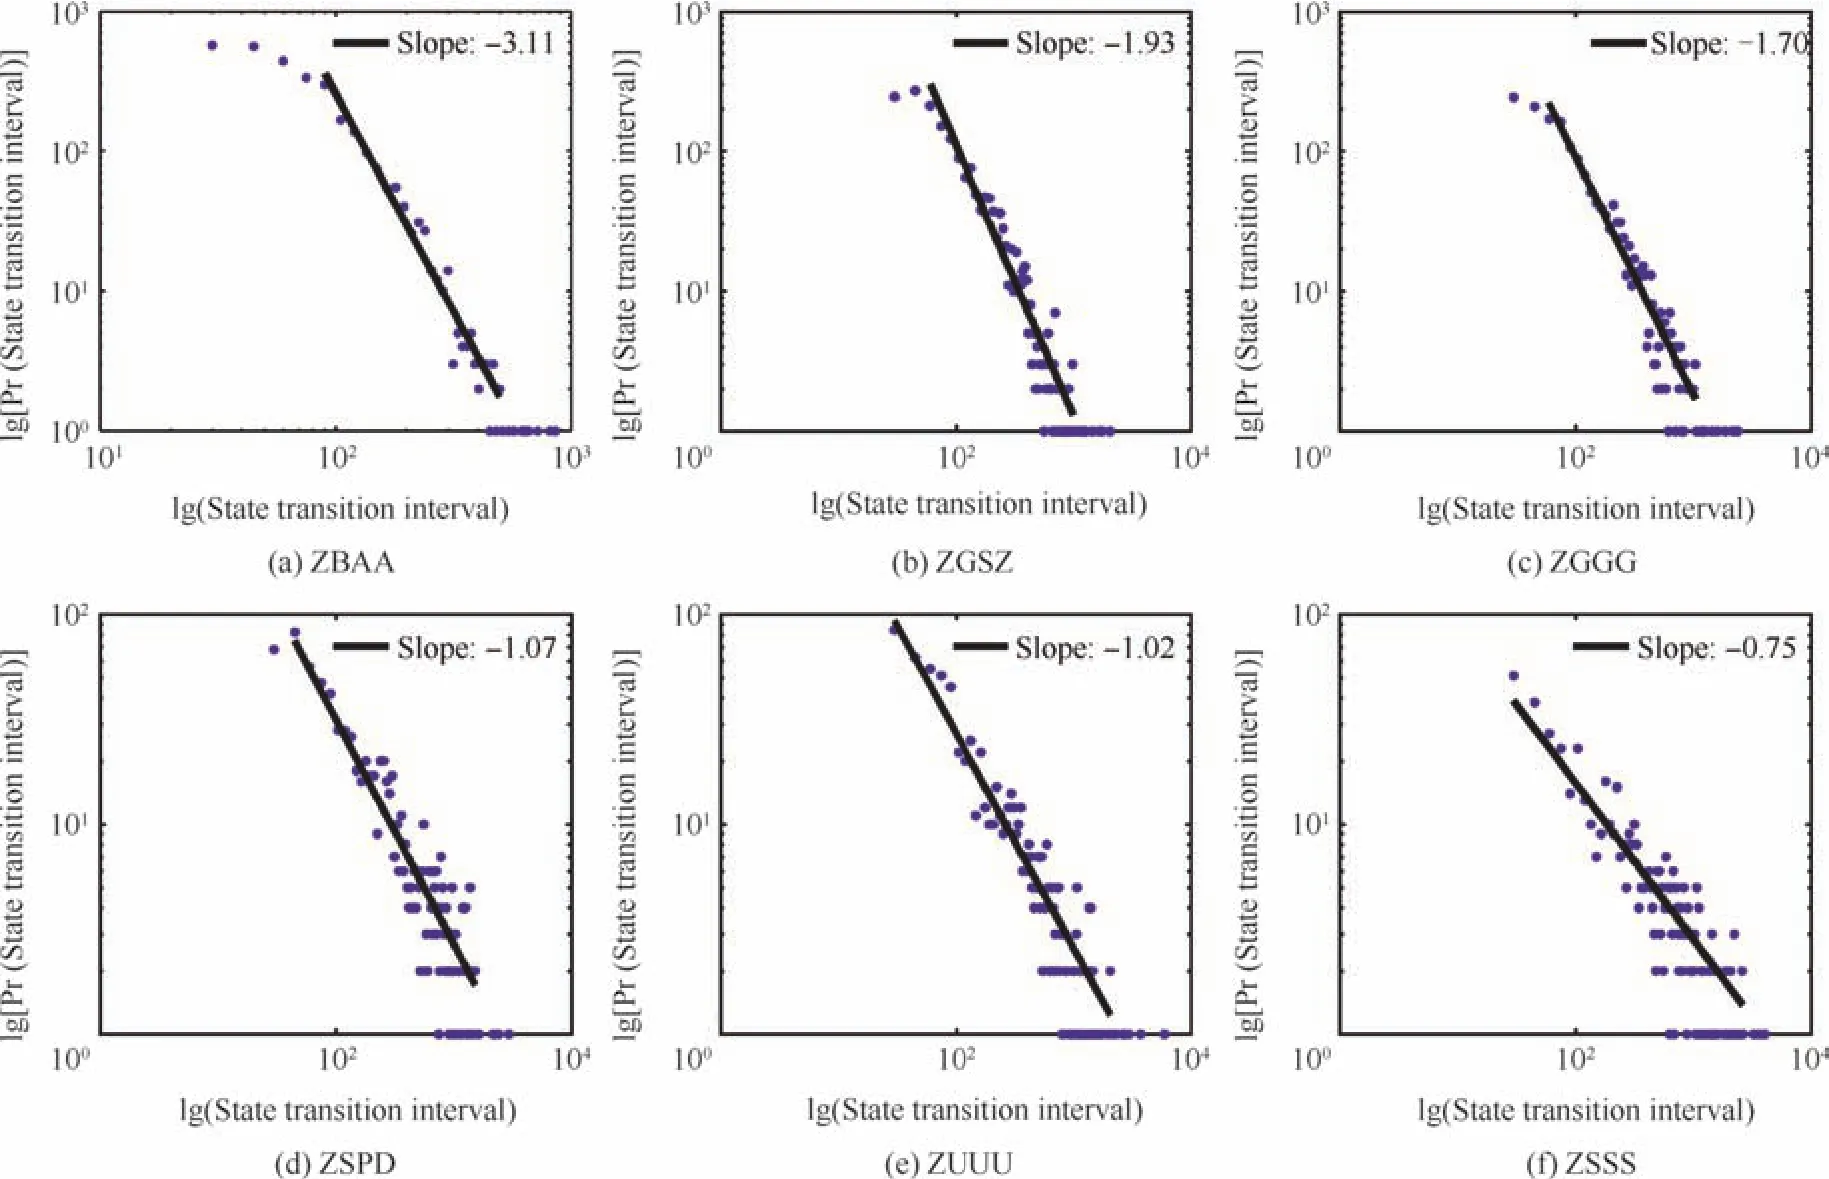
Even for airports inC6,they play different roles in the network.As a key indicator of airport performance analysis,delay often occurs in special or extreme operational conditions,such as military activities,severe weather,and major security concerns.Therefore,delay can be,to a greater extent,considered as an indicator of the critical operation state of airport.To uncover the core airports inC6,we turn to the study of state transition based on delay.The brief idea is as follows.Firstly,we calculate the number of delayed flights for each airport inC6with temporal resolution of 15 min.Then,we calculate contribution rate of airport as the rate of number of delayed flights of each airport to the total number of delayed flights of the network in each time slot.The airports are sorted in descending order according to their contribution rates.Finally,the airport with the highest contribution rate can be found in each slot,and then there will be a new time series formed by the highest airports, for instance,{ZBAA,ZGGG,ZUUU,ZSPD,ZBAA,.,ZGSZ}.When one airport contributes most to the delay at network level,it is regarded as the core of the network.According to the time series,the intervals between the same airports are obtained to estimate the distribution of critical state transition.As shown in Fig.6,the state transition intervals of these 6 airports do exhibit power law decay,while the others do not(‘Pr(·)’in the Fig.6 represents the probability).The exponents of these 6 airports lie within[0.75,3.11].
7.Conclusions and future work
(1)A novel aviation network is constructed with airports as nodes and the correlations between traffic flow of airportpairs as edges.All airports are classified into 6 categories by the proposed spectral clustering algorithm.Among the 6 categories,airports inC6are of the highest intraclass correlation,and they have quite similar features in terms of traffic characteristics and geographical locations.

Fig.5 Power spectra of average traffic flow time series.

Fig.6 Distributions of state transition intervals.
(2)It is found that the spatial correlations among airports exhibit power law decay when the distance between airports is larger than 1585 km.Besides,1/f spectra is observed in average traffic flow time series of airport network.Spatial and temporal correlations analyses show that air transport system is a critical system with self-organized criticality.After further comparison of spatial and temporal correlation among 6 categories of airports,a group of critical airports have been identified fromC6.They are the primary source of self-organized criticality.
(3)Airport’s delay is analyzed with the assumption that the critical state of the airport network can be reflected by airport’s delay.The distributions of state transition intervals for airports inC6are estimated based on the highest delay contribution rate.There are 6 airports with state transition intervals showing power-law distributions.Beijing capital international airport(ZBAA)is with the highest scaling exponent.It can be concluded that these 6 airports are the most critical ones in the network.The frequently occurred delay in these airports will propagate to other airports.Thus,the performance of these airports has a great impact on the performance of the entire network.
The identification of critical airports in the critical airport network has potential implications for the management of air transport system,for instance,to improve operation eff iciency of the system.We have presented the method to identify critical airports in the network.Further efforts will be given to the comparative study of identified critical airports,to profoundly analyze their similarities and differences.The presented method here will be performed with the data of other countries to validate whether their aviation networks are of self-organized criticality.
Acknowledgements
The authors thank anonymous reviewers for their critical and constructive suggestions and comments on the manuscript.This work was co-supported by the National Natural Science Foundation of China(No.61304190),the Fundamental Research Funds for the Central Universities of China(No.NJ20150030),and the Natural Science Foundation of Jiangsu Province of China(No.BK20130818).
1.Eurocontrol Statistics and Forecast Service.A place to stand:Airports in the European air network,Volume 3.Brussels,Belgium:Eurocontrol;2007.p.15.
2.Eurocontrol Performance Review Commission,Federal Aviation Administration Air Traffic Organization System Operations Services.U.S./Europe comparison of ATM-related operational performance.Brussels,Belgium:Eurocontrol;2012.p.8–51.Report No.:2012-AJR-018.
3.EurocontrolPerformanceReview Unit.Performancereview report:an assessment of air traffic management in Europe during the calendar year 2014.Brussels,Belgium:Eurocontrol;2015.p.4–31.
4.Simpson RW,Odoni AR,Salas R,Francisco J.Potential impacts on advanced technologies on the ATC capacity of high-density terminal areas.Cambridge,MA:MIT,Dept.of Aeronautics&Astronautics,Flight Transportation Laboratory;1986.p.65–70.Report No.:R86-10.
5.Lee DA,Nelson C,Shapiro G.The aviation system analysis capability:Airport capacity and delay models.Hampton,Virginia:NationalAeronauticsand Space Administration,Langley Research Center;1998.p.1–7.Report No.:NASA/CR-1998-20765.
6.Odoni AR,Bowman J,Delahaye D,Deyst JJ,Feron E,Hansman RJ,et al.Existing and required modeling capabilities for evaluating ATM systems and concepts.Cambridge,MA:MIT International Center for Air Transportation;1998.p.12–72.Report No.:NASA-CR-204978.
7.Mueller ER,Chatterji GB.Analysis of aircraft arrival and departure delay characteristics.Proceedings of AIAA’s aircraft technology,integration and operations(ATIO)technical forum;2002 October 1–3;Los Angeles,California.Reston:AIAA;2002.p.1–14.
8.Krozel J,Hoffman B,Penny S,Butler T.Aggregate statistics of the national airspace system.Proceedings of AIAA guidance,navigation,and control conference;2003 August 11–14;Austin,Texas.Reston:AIAA;2003.p.1–15.
9.Abdel-Aty M,Lee C,Bai Y,Li X,Michalak M.Detecting periodic patterns of arrival delay.J Air Transp Manage2007;13(6):355–61.10.Stroeve SH,Blom HAP,Bakker GJB.Systemic accident risk assessment in air traffic by Monte Carlo simulation.Saf Sci2009;47(2):238–49.
11.Stroeve SH,Blom HAP,Bakker GJB.Contrasting safety assessments of a runway incursion scenario:event sequence analysis versus multi-agent dynamic risk modelling.Reliabil Eng Syst Saf2013;109:133–49.
12.Blom HAP,Stroeve SH,Bosse T.Modelling of potential hazards in agent-based safety risk analysis.Proceedings of the tenth USA/Europe air traffic management research and development seminar;2013 June 10–13;Chicago,USA.2013.p.1–35.
13.Gillen D,Lall A.Developing measures of airport productivity and performance:an application of data envelopment analysis.Transp Res Part E:Logistics Transp Rev1997;33(4):261–73.
14.Pacheco RR,Fernandes E,de Sequeira Santos MP.Management style and airport performance in Brazil.J Air Transp Manage2006;12(6):324–30.
15.Yu MM.Assessment of airport performance using the SBMNDEA model.Omega2010;38(6):440–52.
16.Guida M,Maria F.Topology of the Italian airport network:a scale-free small-world network with a fractal structure.Chaos Solitons Fractals2007;31(3):527–36.
17.da Rocha LEC.Structural evolution of the Brazilian airport network.J Stat Mech:Theory Exp2009;4:P04020.
18.Bagler G.Analysis of the airport network of India as a complex weighted network.Physica A2008;387(12):2972–80.
19.Chi LP,Wang R,Su H,Xu XP,Zhao JS,Li W,et al.Structural properties of US flight network.Chin Phys Lett2003;20(8):1393–6.
20.Ru W,Xu C.Hierarchical structure,disassortativity and information measures of the US flight network.Chin Phys Lett2005;22(10):2715–8.
21.Li W,Cai X.Statistical analysis of airport network of China.Phys Rev E2004;69(4):046106.
22.Zhang J,Cao XB,Du WB,Cai KQ.Evolution of Chinese airport network.Physica A2010;389(18):3922–31.
23.Li SM,Xu XH.Vulnerability analysis for airport networks based on fuzzy soft sets:from the structural and functional perspective.Chin J Aeronaut2015;28(3):780–8.
24.Amaral LAN,Scala A,Barthelemy M,Stanley HE.Classes of small-world networks.Proc Natl Acad Sci2000;97(21):11149–52.
25.Guimera R,Mossa S,Turtschi A,Amaral LAN.The worldwide air transportation network:anomalous centrality,community structure,and cities’global roles.Proc Natl Acad Sci2005;102(22):7794–9.
26.Adikariwattage V,de Barros AG,Wirasinghe SC,Ruwanpura J.Airport classification criteria based on passenger characteristics and terminal size.J Air Transp Manage2012;24(3):36–41.
27.Rodrı´guez-Déniz H,Suau-Sanchez P,Voltes-Dorta A.Classifying airports according to their hub dimensions:an application to the US domestic network.J Transp Geogr2013;33(33):188–95.
28.Gegov E,Postorino MN,Atherton M,Gobet F.Community structure detection in the evolution of the United States airport network.Adv Complex Syst2013;16(1):1350003.
29.Postorino MN,Versaci M.A geometric fuzzy-based approach for airport clustering.Adv Fuzzy Syst2014;2014:1–12.
30.von Luxburg U.A tutorial on spectral clustering.Stat Comput2007;17(4):395–416.
31.Petri G,Expert P,Jensen HJ,Polak JW.Entangled communities and spatial synchronization lead to criticality in urban traffic.Sci Rep2013;3(5):1798.
32.Braun R,Leibon G,Pauls S,Rockmore D.Partition decoupling for multi-gene analysis of gene expression profiling data.BMC Bioinformatics2011;12(1):497.
33.Kong WZ,Sun ZH,Yang C,Dai GJ,Sun CSH.Automatic spectral clustering based on eigengap and orthogonal eigenvector.Acta Electronica Sinica2010;38(8):1880–91[Chinese].
34.Choi MY,Lee HY.Traffic flow and 1/ffluctuations.Phys Rev E1995;52(6):5979–84.
35.Zhang X,Hu G.1/fnoise in a two-lane highway traffic model.Phys Rev E1995;52(5):4664–8.
31 August 2015;revised 24 November 2015;accepted 25 December 2015
Available online 23 February 2016
ⓒ2016 Chinese Society of Aeronautics and Astronautics.Published by Elsevier Ltd.This is an open access article under the CC BY-NC-ND license(http://creativecommons.org/licenses/by-nc-nd/4.0/).
*Corresponding author.Tel.:+86 25 52112039.
E-mail address:ywang@nuaa.edu.cn(Y.Wang).
Peer review under responsibility of Editorial Committee of CJA.
Cong Weiis a Ph.D.student in College of Civil Aviation,Nanjing University of Aeronautics and Astronautics(NUAA).He received his B.S.degree from the same university in 2011.His area of research includes air traffic performance evaluation and air traffic complexity theory.
Wang Yanjunis an associate professor in College of Civil Aviation,Nanjing University of Aeronautics and Astronautics(NUAA).He is the director of the Office of International Affairs,deputy director of Airspace Assessment Lab.of the National Key Laboratory of Air Traffic Flow Management.He received the B.S.degree in Air Traffic Management and Dispatch and the M.S.degree in Transportation Engineering from NUAA in 2004 and 2007,respectively.He was a doctoral researcher at EUROCONTROL Experimental Center from 2009 to 2012,and received his Ph.D.from Télécom ParisTech(ENST),France in 2012.His current research interests cover human factors,complex systems modeling and analysis,and data science.
 CHINESE JOURNAL OF AERONAUTICS2016年2期
- CHINESE JOURNAL OF AERONAUTICS的其它文章
- Hypersonic starting flow at high angle of attack
- Advances and trends in plastic forming technologies for welded tubes
- Instability and sensitivity analysis of flows using OpenFOAM®
- Numerical simulations of high enthalpy flows around entry bodies
- Modeling and simulation of a time-varying inertia aircraft in aerial refueling
- Experimental investigations for parametric effects of dual synthetic jets on delaying stall of a thick airfoil
