生存资料的二次研究系列之八:使用R软件netmeta程序包实现生存资料的网状Meta分析
刘小平,黄静宇,李胜,翁鸿,孟详喻,曾宪涛
•循证理论与实践•
生存资料的二次研究系列之八:使用R软件netmeta程序包实现生存资料的网状Meta分析
刘小平1,2,黄静宇1,2,李胜1,2,翁鸿1,2,孟详喻1,2,曾宪涛1,2
近年来基于直接与间接证据合并的网状Meta分析越来越流行。R语言netmeta程序包是基于频率学图论模型的网状Meta分析软件,可应用于二分类、连续性以及生存资料等多种数据类型的Meta分析,并提供相应异质性与一致性检测方法及将干预措施进行优劣排序的方法。本文通过实例演示如何使用R软件netmeta程序包实现生存资料的网状Meta分析。
网状Meta分析;netmeta程序包;频率学图论模型;R软件
网状Meta分析越来越多的受到广大科研工作者的欢迎[1,2]。目前国内外研究人员常用的网状Meta分析方法包括基于贝叶斯统计的网状Meta分析[3]和基于频率学图论模型的网状Meta分析[4,5]。贝叶斯网状Meta分析涉及较深的马尔科夫链·蒙特卡罗(MCMC)统计理论,对于初学者不易掌握。在本系列前一篇文章中,介绍了以R软件gemtc程序包实现生存资料的贝叶斯网状Meta分析的方法[5],本文以老年初治多发性骨髓瘤患者行诱导治疗后患者的无进展生存期(PFS)为研究指标,通过使用R软件netmeta程序包以实现基于频率学图论模型的生存资料网状Meta分析[6,7]。
1 软件及相关程序包的安装和加载
在进行网状Meta分析之前,首先要在R语言官方网站(https://www.r-project.org/)下载安装目前最新版本的R软件。
R软件安装完毕后,可通过在R软件控制端键入install.packages(“netmeta”)安装目前最新版本的netmeta程序包(version 0.8-0),系统将自动安装运行netmeta程序包所必须的目前最新版本的meta程序包(version 4.3-0)。通过在R软件控制端键入library(netmeta)加载R语言netmeta程序包。至此,R语言netmeta程序包安装及加载完毕。
2 数据准备
在进行网状Meta分析前,需要将每个研究的风险比(HR)及其相应95%可信区间转换为log(HR)及其标准误[selog(HR)]。将HR直接进行log转换即可计算出logHR,selogHR的计算公式为:

其中ULHR与LLHR分别为HR的95%可信区间的上限和下限。本例演示中的原始数据和log(HR)及selog(HR)整理如表1。
3 结果呈现
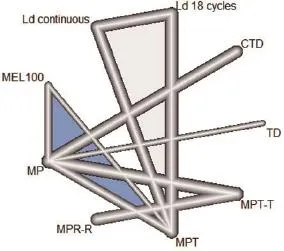
3.1网状关系图的绘制通过在R软件控制端键入以下命令即可绘制网状关系图:
netmeta<-netmeta(logHR, selogHR, treat1,treat2, data=data, comb.random=TRUE, sm="HR",stu dlab=Study,reference.group="MP")
netgraph(netmeta)
其中logHR表示log(HR),selogHR表示Selog(HR),treat1,treat2分别表示治疗措施1和2,comb.random=TRUE表示采用随机效应模型,sm="HR"表示最后合并的效应量为HR,reference.group=表示以“MP”方案为参照。本例绘制的网络关系图如图1。

表1 原始数据和经转换后的log(HR)及selog(HR)

图1 实例分析的网络关系图
3.2异质性及一致性评价在进行正式分析前,需要对整个研究的异质性和一致性进行评价。运用decomp.design函数计算Q统计量(Cochran's Q statistic)[9]。通过在R软件控制端键入以下命令:
Q.decomp<-round(decomp.design(netmeta)$Q. decomp,3)
可以计算整个网状分析、研究内部及各研究间的异质性(表2)。同时,可通过在R软件控制端键入以下命令:
Q.het.design<-print(decomp.design(netmeta)$Q. het.design,degitl=2)
Q.inc.random<-round(decomp.design(netmeta)$Q.inc.random,3)
计算各研究内部的异质性(表3)和各研究间的异质性(表4),此外我们通过netmeta函数直接计算出研究的I2(本例研究I2=65.1%)。另一方面,nemeta程序包可提供netheat函数对网状Meta分析的一致性进行评价[10],通过在R软件控制端键入netheat(netmeta),可以绘制出一致性评价网状热图(net heat plot)。本例研究所绘制的网状热图见图2,图中对角线上方块代表其相应治疗方案的不一致性。对角线以外的方块代表在放宽方块所对应的列的研究的一致性假设后其所对应行的研究的不一致性变化(冷色代表增加,暖色代表减小)。综上所述,本例研究并无明显异质性和不一致性。

表2 异质性Q统计表

表3 各研究内部异质性表

表4 各研究间异质性
3.3网状Meta分析及结果呈现如前所述本例研究同质性和一致性良好,可采用固定效应一致性模型进行网状Meta分析。通过在R软件控制端键入:
netmeta<-netmeta(logHR, selogHR, treat1,treat2, data=data, comb.random=TRUE, sm="HR",studlab=Study, reference.group="MP")
同时可以利用forest函数绘制森林图,本例研究绘制的森林图如图3。另一方面,netmeta程序包可通过计算研究中各干预措施的P-score,对各干预措施的优劣次序进行排序[11]。通过在R软件控制端键入nr<-netrank(netmeta,small. value="good")绘制本例研究的P-score。

图2 网状热力图

图3 森林图

表6 P-score表
4 结语
由于直接证据的缺乏,基于间接比较的网状meta分析凭借其成熟的统计学基础及节约资源的优势,目前越来越多地受到广大科研工作者的青睐。如前所述,netmeta程序包是一种基于频率学图论模型进行网状Meta分析的R语言程序包。netmeta程序包不仅操作简单,而且其功能比较强大。众所周知,一致性和异质性评价对于网状Meta分析结果可靠性至关重要。在一致性评价方面,netmeta程序包可通过绘制网状热图将整个研究的一致性评价可视化,并将其不一致性来源精确定位;在异质性评价方面,netmeta程序包应用考克兰Q统计不仅分析整个研究的异质性,还将其异质性分解成各研究内部及研究间的异质性,这样可以方便研究人员明确异质性来源,并进行后续分析。同时,有别于Bayesian网状Meta分析提供SUCRA曲线以评价各干预措施优劣次序,netmeta程序包通过netrank函数计算各干预措施的P-score评价其优劣次序。与SUCRA曲线相比,P-score不仅简单明了而且更加能够提供具体数值以进行量化评价[11,12]。
[1] 曾宪涛,曹世义,孙凤,等. Meta分析系列之六: 间接比较及网状Meta分析[J]. 中国循证心血管医学杂志,2012,4(5):399-402.
[2] Lu G,Ades AE. Combination of direct and indirect evidence in mixed treatment comparisons[J]. Stat Med,2004,23(20):3105-24.
[3] van Valkenhoef G,Lu G,de Brock B,et al. Automating network metaanalysis[J]. Res Synth Methods,2012,3(4):285-99.
[4] Rücker G. Network meta-analysis, electrical networks and graph theory[J]. Res Synth Methods,2012,3(4):312-24.
[5] 刘小平,孟详喻,尹晓红,等. R软件gemtc程序包实现生存数据网状Meta分析[J]. 中国循证心血管医学杂志,2016,8(6):in press.
[6] R Core Team. R: A language and environment for statistical computing[Internet]. R Foundation for Statistical Computing, Vienna,Austria, 2016. URL https://www.R-project.org/.
[7] Rücker G,Schwarzer G,Krahn U,et al. netmeta: Network Meta-Analysis using Frequentist Methods[Internet]. version 0.8-0.[cited 2016 Mar 20].Available from:http://CRAN.R-project.org/ package=netmeta.
[8] Rücker G,Schwarzer G. Automated drawing of network plots in network meta-analysis[J]. Res Synth Methods,2015,6(2):143-75.
[9] Higgins JPT,Jackson D,Barrett JK,et al. Consistency and inconsistency in network meta-analysis: concepts and models for multi-arm studies[J]. Res Synth Methods,2012,3(2):98-110.
[10] Krahn U,Binder H,König J. A graphical tool for locating inconsistency in network meta- analyses[J]. BMC Med Res Methodol,2013,13(4):1211.
[11] Rücker G,Schwarzer G. Ranking treatments in frequentist network meta-analysis works without resampling methods[J]. BMC Med Res Methodol,2015,15(1):1-9.
[12] Salanti G,Ades AE,Ioannidis JP. Graphical methods and numerical summaries for presenting results from multiple-treatment meta-analysis:an overview and tutorial[J]. J Clin Epidemiol,2011,64(2):163-71.
本文编辑:姚雪莉
Realization of network Meta-analysis of survival data by using netmeta package in R software
LIU Xiao-ping*, HUANG Jing-yu, LI Sheng, WENG Hong, MENG Xiang-yu, ZENG Xian-tao.*Center for Evidence-Based and Translational Medicine, Zhongnan Hospital, Wuhan University, Wuhan 430071, China.
ZENG Xian-tao, E-mail: zengxiantao1128@163.com
The network Meta-analysis based on direct and indirect evidence has been more and more popular in recent years.R netmeta package is a software of network Meta-analysis based on frequency study graph-theory model, and it can be applied in the Meta-analysis of multiple data types including binary and continuous variable and network Meta-analysis of survival material, and provides the methods of heterogeneity and consistency checking and merit sorting of different interventional measures.The methods of achieving network Meta-analysis of survival data by using netmeta package in R software were demonstrated with examples in this paper.
Network Meta-analysis; Netmeta package; frequency study graph-theory model; R software
R4
A
1674-4055(2016)08-0904-03
国家重点研发计划“数字诊疗装备研发”试点专项基金(2016YFC0106300)
1430071武汉,武汉大学中南医院循证与转化医学中心;2430071武汉,武汉大学循证与转化医学中心
曾宪涛,E-mail:zengxiantao1128@163.com
10.3969/j.issn.1674-4055.2016.08.03

