基于多台站OH全天空气辉成像仪观测的中国中纬地区重力波传播特性
王翠梅, 李钦增, 徐寄遥, 袁韡
1 中国科学院空间科学与应用研究中心天气学国家重点实验室, 北京 100190 2 中国科学院大学, 北京 100049
基于多台站OH全天空气辉成像仪观测的中国中纬地区重力波传播特性
王翠梅1,2, 李钦增1, 徐寄遥1, 袁韡1
1 中国科学院空间科学与应用研究中心天气学国家重点实验室, 北京100190 2 中国科学院大学, 北京100049
摘要利用位于中国中纬地区6个OH气辉成像仪2012年1月至2013年12月两年的观测数据, 我们研究分析了重力波传播特征.结果表明重力波的水平波长、观测周期和水平相速度分别主要分布于10~35 km, 4~12 min和30~100 m·s-1范围. 夏季,重力波主要沿极向方向传播. 然而, 冬季, 他们有向赤道方向和平行于赤道方向的传播趋势. 同时, 我们结合TRMM卫星和ECMWF数据, 发现在夏季重力波的北向传播趋势可能主要由观测台站南方的对流活动导致. 然而, 对流层顶附近的急流可能在冬季重力波的主要传播方向方面做出较大贡献. 分析结果也表明, 低层-中层大气背景风的滤波效应仅在夏季与中国中纬地区重力波纬向传播方向各向异性吻合较好.
关键词气辉成像仪; 大气重力波; 传播; 波源; 滤波效应
1引言
大气重力波在中层-低热层动力学过程中起到重要作用(Nakamura et al., 2003).普遍的观点认为,中层-低热层大气重力波产生于低层大气且向上传播(Taylor and Hapgood, 1988).因此,在重力波向上传播过程中,低层-中层大气风场对重力波的通量和方位角分布起到重要作用(Taylor et al., 1993).
近几十年,研究者利用气辉成像观测数据对不同纬度地区的中层-低热层高频重力波传播特征进行了研究.气辉成像仪具有获取二维水平结构的能力,被广泛用于短周期(<1 h) 和小尺度重力波观测(水平波长<100 km).
中纬地区,研究者(Taylor et al., 1993; Nakamura et al., 1999; Walterscheid et al., 1999; Hecht et al., 2001, 2004; Ejiri et al., 2003; Suzuki et al., 2004; Tang et al., 2005, 2014; Dou et al., 2010; Kim et al., 2010; Li et al, 2011b)利用气辉成像观测数据,发现重力波在夏季主要沿东向和极向传播.然而,很多观测报道了中纬地区的重力波在冬季主要沿赤道方向传播(Walterscheid et al., 1999; Ejiri et al., 2003; Suzuki et al., 2004; Tang et al., 2005, 2014; Dou et al., 2010; Kim et al., 2010; Li et al., 2011b).
低纬地区,Li等(2011a)和Suzuki等(2004)利用OH气辉成像数据分别报道了Maui(20.7°N,156.3°W)和Australia(12°S)台站的重力波在夏季(冬季)趋向于极向(赤道方向)传播.
赤道附近,Narayanan和Gurubaran(2013)报道了Tirunelveli(8.7° N)地区的重力波在夏季几乎都向南和西南方向传播.Medeiros等(2004a)的研究结果表明,在夏季和冬季,Cariri(7°S,35°W)地区的重力波分别主要沿东南和东北方向传播.
影响重力波传播方向的因素有很多.其中,波源位置被广泛认为是影响重力波传播方向的主要因素之一,且对流活动是产生高频重力波的重要波源之一.模拟(Fovell et al., 1992; Alexander et al., 1995, 2004; Lane et al., 2001; Vadas and Fritts, 2001, 2009; Walterscheid et al., 2001; Song et al., 2003; Vadas et al., 2009)和观测(Walterscheid et al., 1999; Hecht et al., 2001; Ejiri et al., 2003; Suzuki et al., 2004; Pautet et al., 2005; Yue et al., 2009)研究给出了对流活动产生重力波的有力证据.另外,有研究表明导管传播和波源位置共同影响重力波主要传播方向.Walterscheid等(1999)报道了Adelaide(35°S)地区上空的重力波在夏季(冬季)主要沿极向(赤道方向)传播.他们解释了产生这种现象是由于重力波陷入导管传播.Hecht等(2001)通过分析 Urbana,Illinois(40°N,80°W)台站的的气辉成像观测数据,报道了重力波在夏季的北向传播趋势是因为热导管和风剪切的存在。
另一个产生重力波的重要机制是急流.Shiokawa等(2007)利用FPI干涉仪和557.7 nm气辉成像仪在Shigaraki(34.8°N,136.1°E)台站观测到一个强烈的重力波事件.他们的分析结果表明,观测的重力波产生于日本的东北方向,该处对流层顶附近存在一个低压系统(968 hPa)和急流.
另外,研究者(Taylor et al., 1993; Stockwell and Lowe, 2001a,2001b; Medeiros et al., 2003,2004a, 2004b, 2005)发现临界层滤波效应在决定重力波纬向传播方向各向异性方面起到重要作用.Taylor等(1993)假设波源位于对流层且使用CIRA-1986纬向风数据报道了Colorado(40.0°N 105.6°W)台站的重力波从低层向高层大气传播过程中有可能被临界层滤波效应滤除.Stockwell和Lowe(2001a,2001b)认为临界层的纬向风的滤波效应解释了重力波在夏季和冬季分别主要沿东向和西向传播的现象.Medeiros等(2003, 2004a, 2004b, 2005)使用Taylor等(1993)中的滤波理论和HWM93水平风场模型(Hedin et al., 1996)报道了滤波效应决定重力波传播方向各向异性方面起主要作用.然而,Li等(2011b)利用Xinglong(40.2°N,117.4°E)台站的观测数据对重力波传播特性进行研究,结果表明临界层滤波效应仅在夏季与重力波传播方向吻合较好.他们指出,波源的非均匀分布和导管传播也同时影响重力波传播方向各向异性.
Medeiros等(2005)通过分析Atlantic附近的多台站观测数据,发现重力波主要从陆地向海洋传播.他们认为来自陆地的对流活动在决定沿海地区重力波传播方向起重要作用.
Kim等(2010)利用射线追踪技术研究大气重力波,发现大部分波动来自于中层高度,他们认为这些重力波为二次波.
本文利用2012年1月至2013年12月两年位于中国中纬地区6个台站的OH气辉成像仪观测数据,对中国中纬地区重力波传播特征进行了分析.同时,我们结合TRMM(Tropical Rainfall Measuring Mission)卫星观测数据,ECMWF(the European Center for Medium-Range Weather Forecasts)和 MERRA(the Modern Era Retrospective-analysis for Research and Applications)风场数据重点讨论了波源位置和滤波效应在重力波传播方向季节变化方面的影响.文章结构安排如下: 第2部分给出观测数据和处理方法.结果和讨论将在第3部分呈现.第4部分是全文总结.
2数据和方法
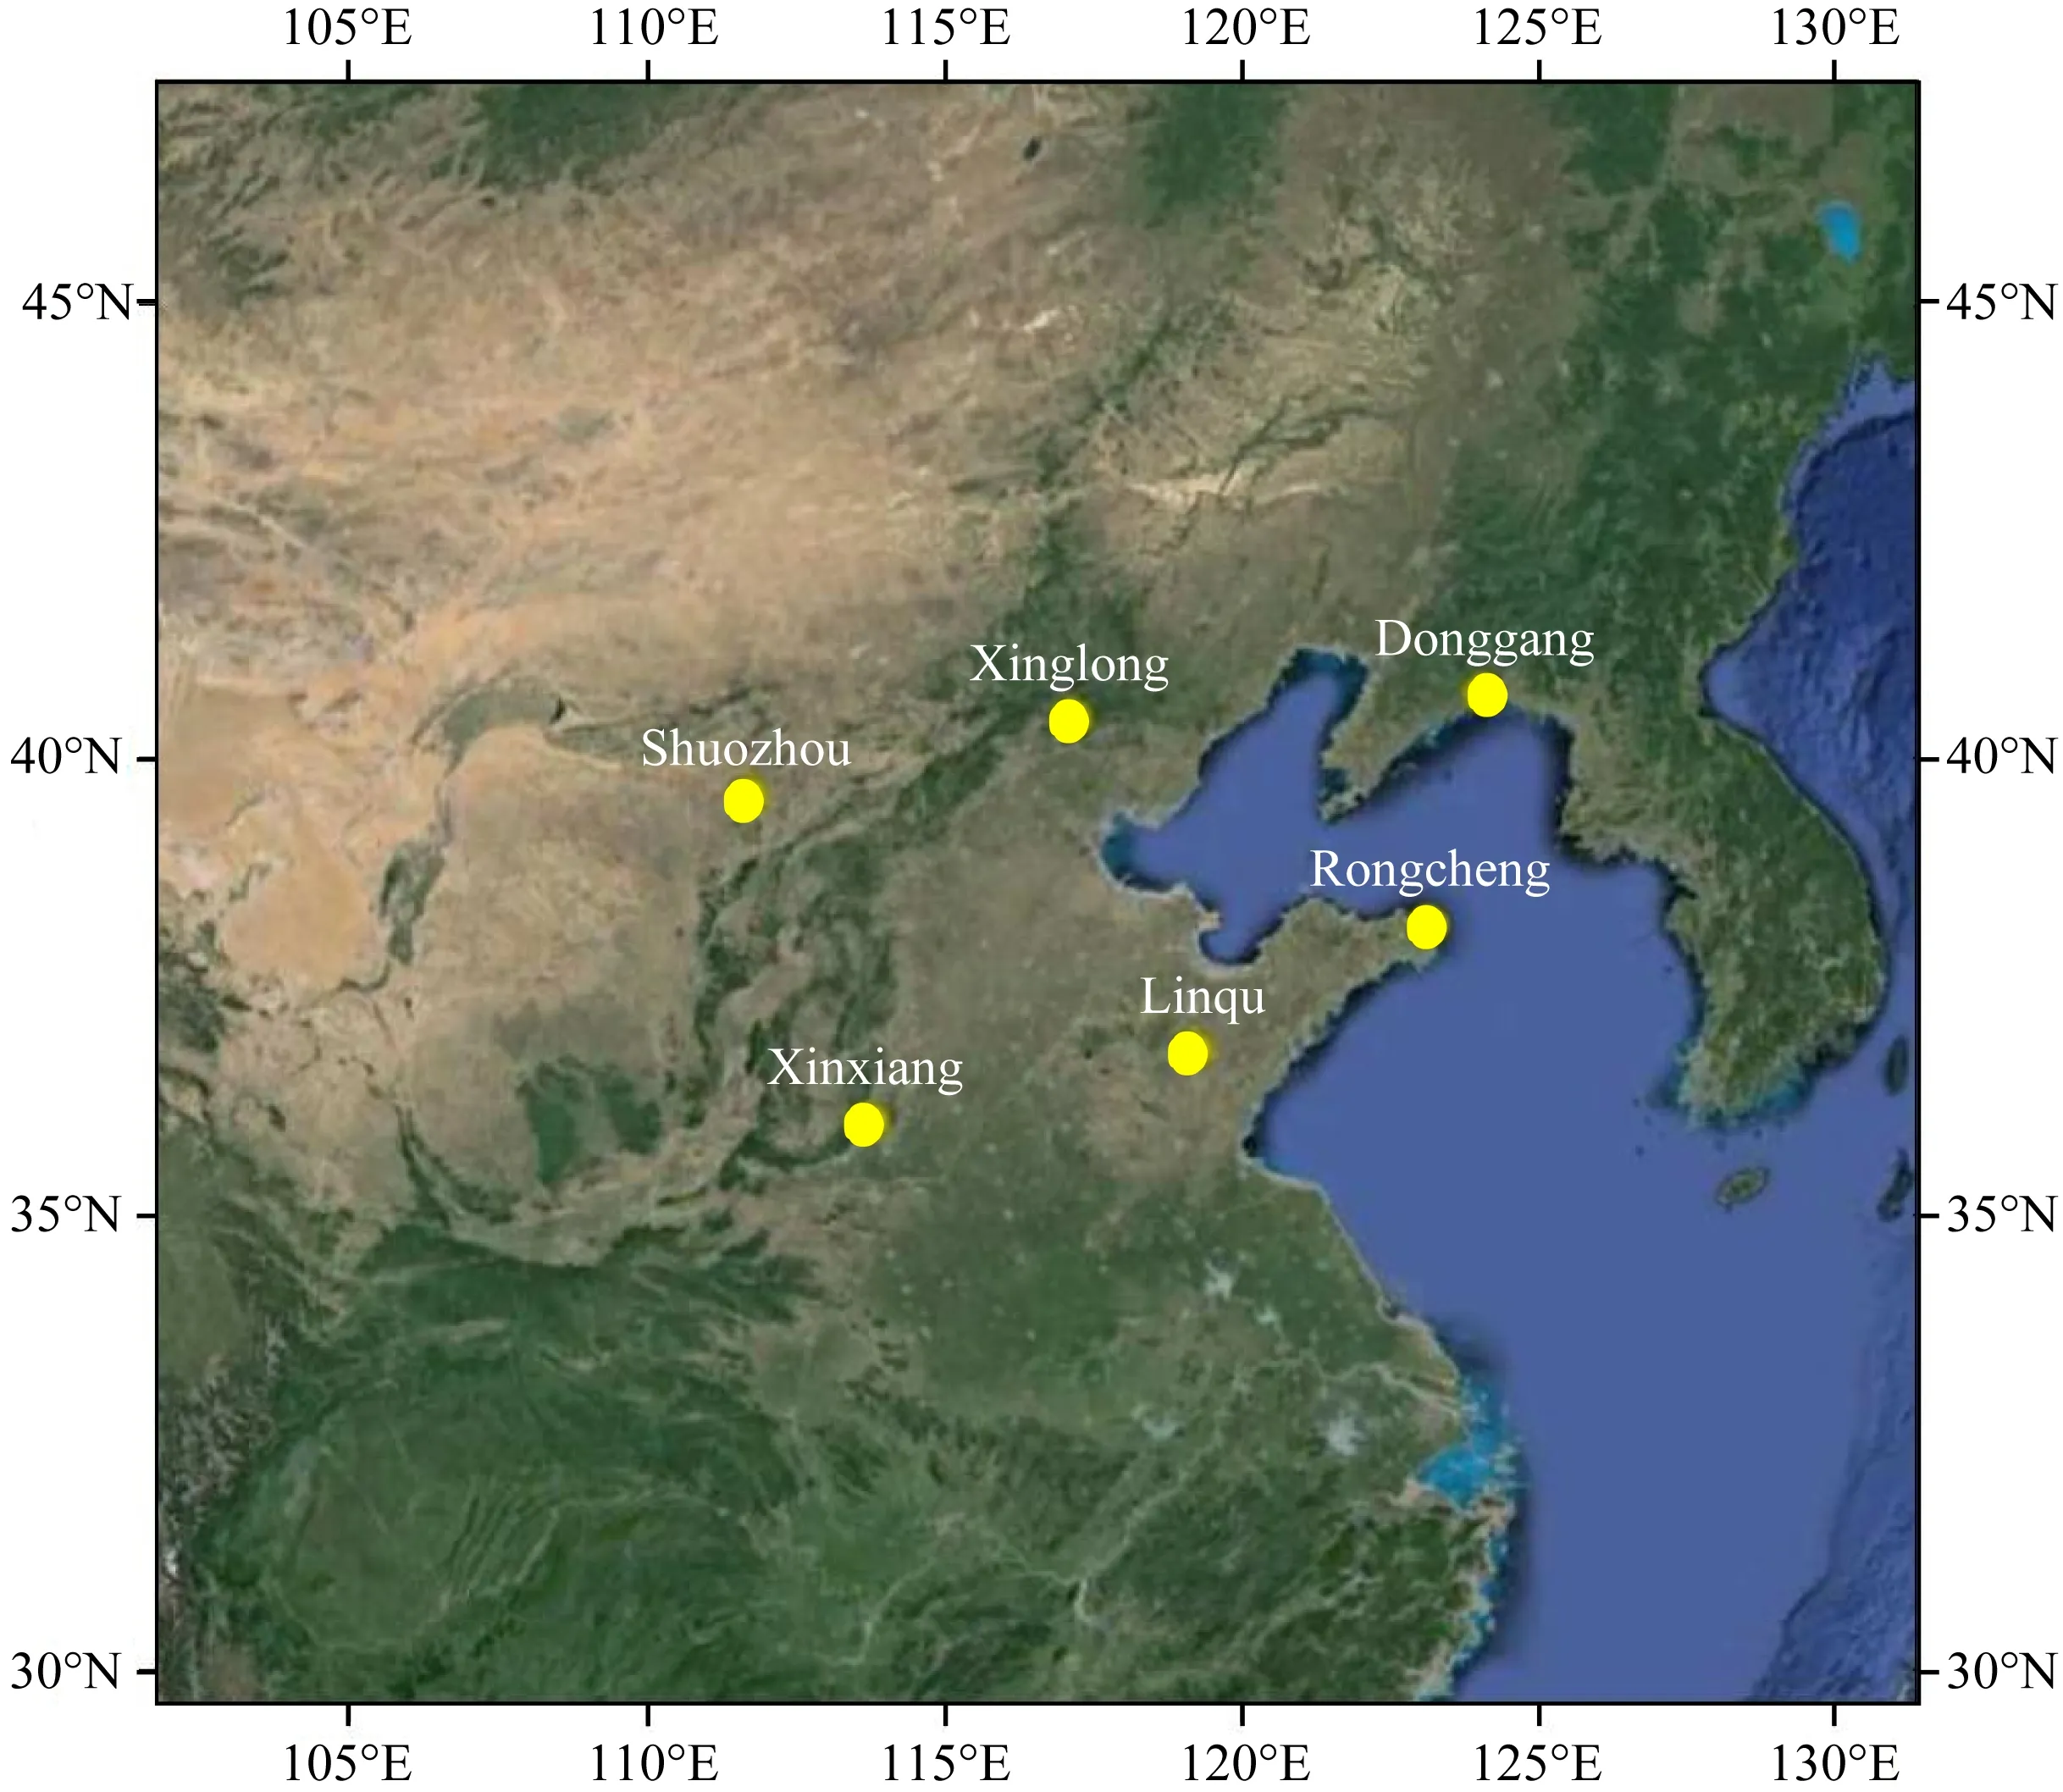
用于研究重力波传播特征的数据来自位于中国中纬地区6个台站2012年1月至2013年12月的OH气辉成像仪,它们分别位于: Shuozhou(39.8°N,112.1°E), Xinglong(40.4°N,117.6°E),Donggang(40.0°N,124.0°E),Xinxiang(35.7°N,113.7°E),Linqu(36.2°N,118.7°E)和 Rongcheng(37.3°N,122.5°E).其中,Xinglong(40.4°N,117.6°E)台站的OH气辉成像仪是子午工程(Wang,2010)地基光学观测仪中的一种.每个OH气辉成像仪包含温度稳定的滤波轮子,使用Nikon 16mm/2.8D 鱼眼镜头,视场角为180°,且由像元数为1024 pixel×1024 pixel的CCD感光元件组成.整个观测过程由软件来自动控制.曝光时间是1 min.且OH气辉辐射波段位于715~930 nm,观测高度为87±5 km.图1为OH气辉成像仪的地理位置示意图.
这篇文章中使用的重力波参数(水平波长、观测周期和水平相速度)是按照如下的步骤提取: 第一步,利用中值滤波法去除原始图像中星光的污染(Suzuki et al.,2007).第二步,去除Van Rhijin效应和大气消光效应(Kubota et al.,2001).第三步,假设OH气辉层的高度为87 km,且将气辉图像投影到800 km×800 km 的地理坐标平面内(Baker and Stair,1988).第四步,把连续的两幅图片进行相减得到差分(TD)图像(Tang et al.,2005).最后,我们对差分图像进行去势处理且利用2-D FFT光谱分析方法提取重力波参数(Garcia et al., 1997; Coble et al, 1998).

图1 OH气辉成像仪地理位置示意图Fig.1 A map showing locations of OH all-sky airglow imagers
3结果和讨论
为了研究重力波的季节变化特征,我们将全年划分为四个季节: 春季(3月—4月)、夏季(5月—8月)、秋季(9月—10月)和冬季(11月—次年2月).利用OH气辉成像仪对重力波传播特征研究的文章(Dou et al.,2010; Ejiri et al., 2003; Li et al., 2011a, 2011b; Medeiros et al., 2004a, 2004b, 2005; Nakamura et al., 2003; Narayanan and Gurubaran, 2013; 王翠梅等, 2014)几乎呈现出重力波的观测周期<1 h,因此在这篇文章中,我们用于研究重力波传播特征的事件不包含水平相速度趋近于0(观测周期远大于1 h)和圆心能被看见的环形重力波(因为圆心被看见的环形重力波,其传播分布于各个方向).3.1重力波的传播特征
表1列出了各个观测台站的重力波观测条件以及观测的重力波事件数目.这里,晴空夜晚定义为半小时及以上的观测图像没有云的污染的夜晚.表1表明,夏季的晴空夜晚数最少.且晴空夜晚数在Shuozhou,Xinglong 和Donggang(这3个台站在40°N)明显多于其他3个台站(36°N附近).
图2(a—f)分别是2012年1月至2013年12月期间各个观测台站的晴空(波动)小时数月分布图.结果表明冬季的晴空时间明显长于夏季的,因为中国中纬地区夏季多雨.然而,几乎每个月的晴空时间>20 h(除了Xinglong台站6月晴空时间<20 h,因为该月观测天数较少),所以我们对重力波传播特征研究的可信度是比较高的.
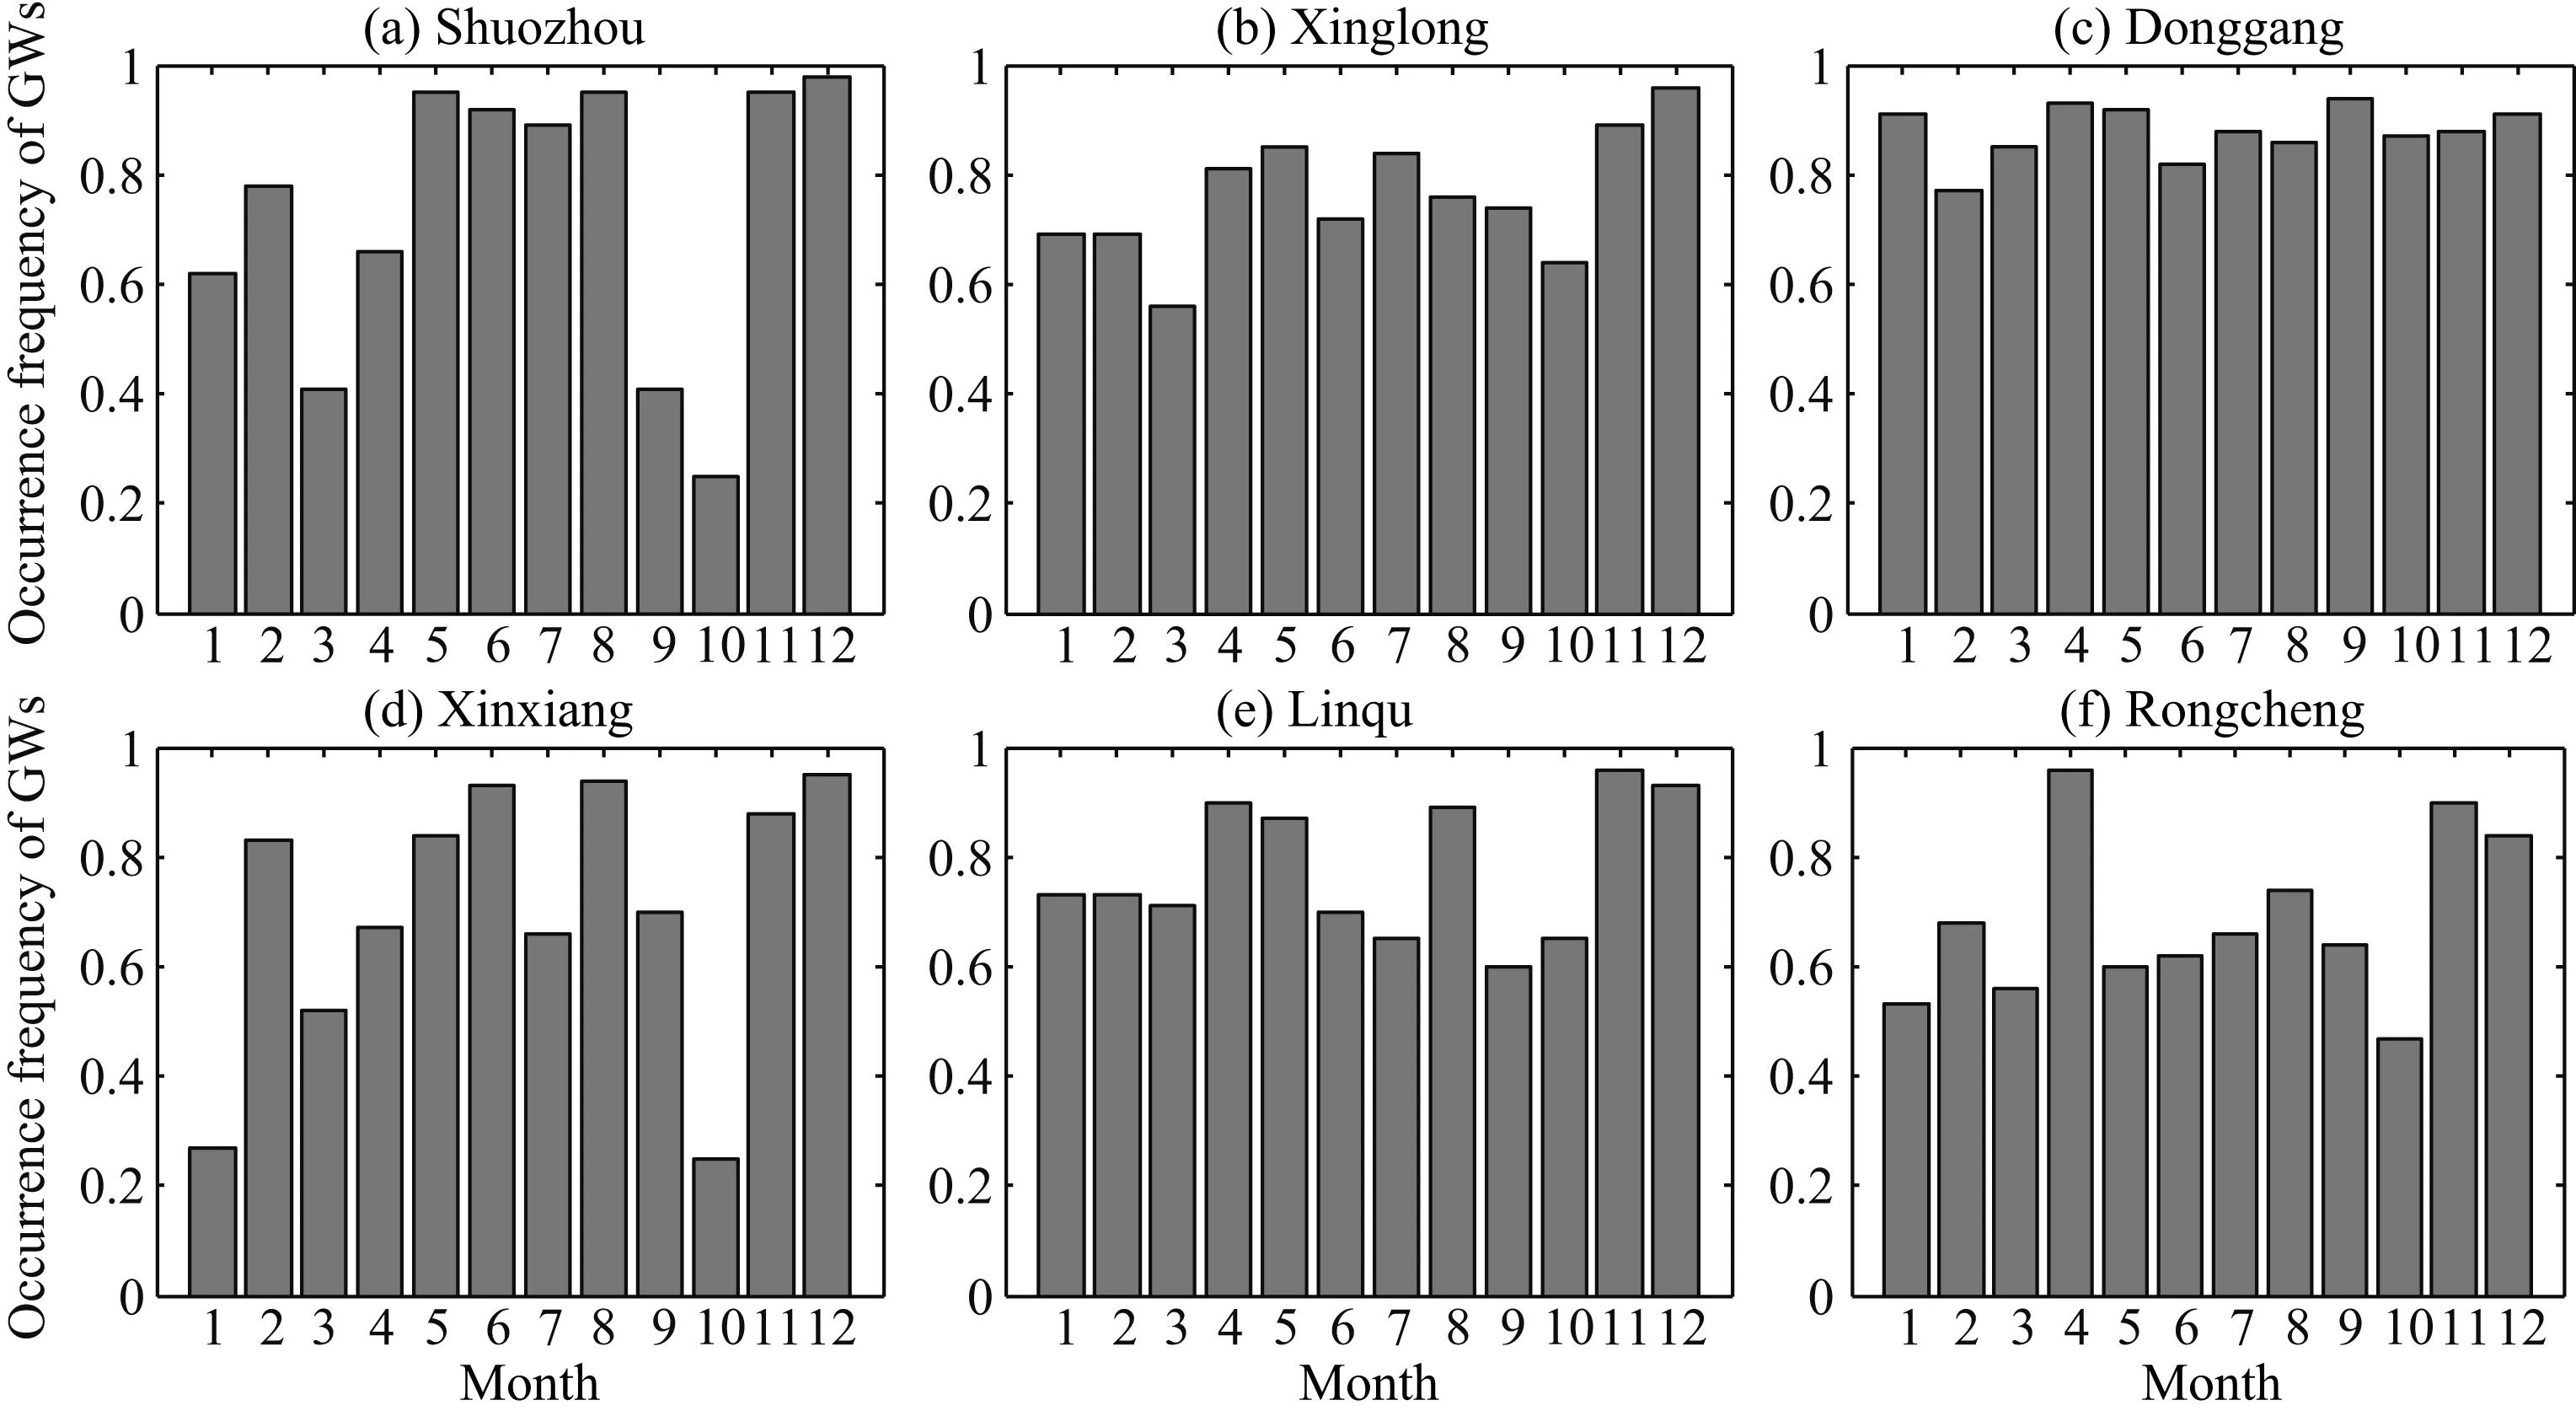
图3(a—f)反映了各个观测台站重力波发生频率的月分布情况.这里,重力波发生频率定义为产生波动的时间与晴空时间的比例.结果表明,Donggang台站的重力波发生频率在各个月份几乎相等.然而,在其他观测台站,重力波发生频率在夏季和冬季高于春季和秋季.这可能由于波源的季节变化和传播环境导致.且后者结果与几个之前的研究结果相似(Nakamura et al., 1999; Medeiros et al., 2004a, 2004b; Kim et al., 2010; Tang et al., 2014).Nakamura等(1999)和Kim等(2010)分别发现Shigaraki(34.9°N,136.1°E)和Mt.Bohyun, Korea(36.2°N,128.9°E)地区的重力波发生频率最大值在夏季和冬季.Medeiros等(2004a,2004b)报道了Cariri(7°S,35°W)和 Brazil(23°S,45°W)台站的重力波发生频率在夏季和冬季大于春季和秋季.Tang等(2014)的研究结果表明在CO(40.7°N,104.9°W)观测台站的重力波发生频率表现出明显的半年变化,且最大值在夏季和冬季,最小值在春季和秋季.

表1 各个台站的重力波观测条件以及观测的重力波事件数

图2 晴空时间(蓝色)和波动时间(红色)月分布图(a) Shuozhou; (b) Xinglong; (c) Donggang; (d) Xinxiang; (e) Linqu; (f) Rongcheng.Fig.2 Monthly distributions of clear hours (blue bars) and wave structure hours (red bars) at every observed station

图3 重力波发生频率月分布图(a) Shuozhou; (b) Xinglong; (c) Donggang; (d) Xinxiang; (e) Linqu; (f) Rongcheng.Fig.3 The monthly distribution of AGWs occurrence frequency
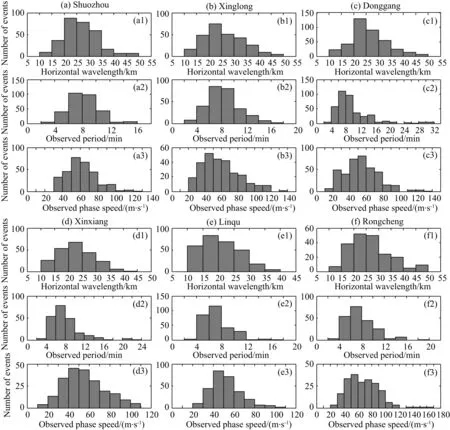
图4(a—f)分别给出每个观测台站的重力波参数分布(其中下标1,2和3分别代表水平波长、观测周期和水平相速度).结果表明水平波长、观测周期和水平相速度分别主要分布于10~35 km,4~12 min和30~100 m·s-1范围.
图5(a—f)分别是每个观测台站观测的所有重力波事件的传播方向极向分布.从图中发现Rongcheng(37.3°N,122.5°E)和Donggang(40.0°N,124.0°E)台站的重力波趋向于东向传播,可能是因为这两个台站更接近于沿海且重力波主要来自大陆对流.然而,其他四个观测台站的重力波传播方向主要表现为沿经向方向,产生这一现象的原因将在3.2节和3.3节做出讨论.
图6—9表明重力波传播方向具有明显的季节变化.夏季,重力波在Donggang和Rongcheng趋向于东北方向传播.在其他4个观测台站,几乎所有的重力波沿北向传播.冬季,重力波具有强烈的沿赤道(向南)方向和平行于赤道(向西或向东)方向传播的趋势.另外,重力波在春季(除了Shuozhou台站无明显优势传播方向)和秋季主要分别沿东北和西北方向传播.与同纬度的观测结果相比较,几个研究者(Wu and Killeen, 1996; Walterscheid et al., 1999; Hecht et al., 2001; Ejiri et al., 2003; Nakamura et al., 2003; Stockwell and Lowe, 2001a; Li et al., 2011a)报道了重力波在夏季和冬季分别主要沿极向和赤道方向传播.他们解释重力波在夏季趋向于极向传播主要是因为赤道附近对流源的影响.然而,中纬和高纬地区的地形因素和大气条件可能导致冬季重力波趋向于赤道方向传播.为了解释重力波传播方向在经向方向的季节变化,卫星观测(Wu and Waters,1996; Nakamura et al.,2003)和环流模型(Richter et al., 2010)研究结果表明,夏季多对流活动,冬季多急流和锋系.
3.2重力波传播方向影响因素分析
3.2.1波源
过去几十年,数值计算(Horinouchi et al., 2002; Lane et al., 2003; Alexander et al., 2004; Vadas and Fritts, 2009)利用三维模型模拟了对流活动产生重力波,加强了我们对重力波产生机制的理解.且随后的观测也验证了重力波产生于对流活动.Dewan和Picard(1998)利用天基观测数据,首次报道了对流雷暴可以产生重力波.Yue等(2009)利用Yucca Ridge Field Station(40.7°N,104.9°W)台站的OH气辉成像仪观测数据报道了强对流活动产生了环形重力波.
降雨是反映深对流活动的重要指标(Walterscheid et al., 1999; Nakamura et al., 2003).图10(a—d)是重力波事件发生前及期间的降雨量季节分布.结果表明,观测台站南方在夏季和春季秋季多降雨,可能在重力波北向传播趋势方面起主要作用.然而,由于观测台站附近在冬季的降雨较少,因此降雨分布

图4 重力波参数直方图(a) Shuozhou; (b) Xinglong; (c) Donggang; (d) Xinxiang; (e) Linqu; (f) Rongcheng.(下标1,2和3分别代表水平波长、观测周期和水平相速度)Fig.4 Histograms of gravity wave parametersThe subscript of 1,2 and 3 represents horizontal wavelength, observed period and horizontal phase speed, respectively.
不能反映冬季的重力波传播特征.这里,降雨数据从TRMM卫星获得,其空间分辨率为0.25°latitude×0.25°longitude,观测覆盖的范围是180°W—180°E,50°S—50°N.
Buss等(2004)利用ECMWF 数据给出Greenland上空对流层顶附近的急流产生重力波的有力证据.Shiokawa等(2007)利用FPI干涉仪和557.7 nm气辉成像仪在Shigaraki(34.8°N,136.1°E)台站观测到一个与急流有关的重力波事件.然而,我们通过ECMWF观测数据获得的风场矢量图发现观测台站附近上空约300 hPa(~9.2 km)处在冬季经常出现两支急流: 西风急流(20°N—45°N)和西北风急流(105°E—130°E)(这里没有给出冬季平均风场矢量图).这两支急流可能在影响冬季重力波的主要传播方向方面起到重要作用.
3.2.2背景风的滤波效应
很多研究表明,低层-中层风场的滤波效应在决定重力波纬向传播方向各向异性方面起重要作用(Taylor et al., 1993; Stockwell and Lowe, 2001b; Medeiros et al., 2003).夏季/冬季,重力波传播方向的东向/西向传播趋势与临界层西向风/东向风的滤波效应一致(Nakamura et al., 1999).
为了探究低层-中层大气滤波效应在中层-低热层观测的重力波的纬向传播方向的影响,图11(a—d)给出了与各个季节在6个观测台站的重力波事件相对应的在12UT和18UT的平均纬向风剖面(位置: 40°N,120°E).这里,纬向风数据来自MERRA,其包含自地面至0.015 hPa 的72个垂直等压层,空间分辨率为1/2° latitude×2/3° longitude.图中表明,在20~70 km高度,夏季盛行西向风,冬季盛行东向风.然而风的方向在春季和秋季季节发生逆转.且结果也表明,低层-中层大气滤波效应与重力波传播方向仅在夏季吻合较好.正如 Li等(2011a)指出的低层-中层大气滤波效应仅能部分解释重力波传播方向各向异性,且波源的非均匀分布和波导传播对重力波传播方向各向异性也起到重要作用.

图5 观测的所有重力波事件极向分布图(a) Shuozhou; (b) Xinglong; (c) Donggang; (d) Xinxiang; (e) Linqu; (f) Rongcheng.Fig.5 Polar histograms of propagation directions of all gravity wave events

图6 春季重力波传播方向极向图(a) Shuozhou; (b) Xinglong; (c) Donggang; (d) Xinxiang; (e) Linqu; (f) Rongcheng.Fig.6 Polar histograms of propagation directions in spring

图7 夏季重力波传播方向极向图(a) Shuozhou; (b) Xinglong; (c) Donggang; (d) Xinxiang; (e) Linqu; (f) Rongcheng.Fig.7 Polar histograms of propagation directions in summer

图8 秋季重力波传播方向极向图(a) Shuozhou; (b) Xinglong; (c) Donggang; (d) Xinxiang; (e) Linqu; (f) Rongcheng.Fig.8 Polar histograms of propagation directions in autumn

图9 冬季重力波传播方向极向图(a) Shuozhou; (b) Xinglong; (c) Donggang; (d) Xinxiang; (e) Linqu; (f) Rongcheng.Fig.9 Polar histograms of propagation directions of all gravity wave events in winter

图10 降雨季节分布(a) 春季; (b) 夏季; (c) 秋季; (d) 冬季.Fig.10 The seasonal distribution of precipitation(a) Spring; (b) Summer; (c) Autumn; (d) Winter.

图11 纬向风剖面图(a) 春季; (b) 夏季; (c) 秋季; (d) 冬季.Fig.11 The profile of zonal wind velocity
4结论
本文基于分布在中国中纬地区2012年1月至2013年12月6个台站的OH气辉成像仪观测数据,研究分析了重力波的传播特征.同时,我们结合TRMM卫星观测、ECMWF和MERRA风场数据讨论了影响重力波传播方向各向异性的因素.主要结果总结如下:
(1) 重力波发生频率在夏季和冬季高于春季和秋季季节.
(2) 水平波长、观测周期和水平相速度分别主要分布于10~35 km,4~12 min和30~100 m·s-1范围.
(3) 重力波传播方向表现出明显的季节变化.重力波在夏季主要沿极向方向传播.然而,在冬季主要沿赤道方向和平行于赤道方向传播.
(4) 重力波在夏季和春季秋季的北向传播趋势可能主要由观测台站南方对流活动导致.然而,对流层附近急流可能在决定冬季重力波主要传播方向方面起到重要作用.
波源的非均匀分布、临界层的滤波效应和导管传播均在重力波传播方向各向异性方面起重要作用.在未来的工作中,我们将结合风场观测和温度数据对产生重力波传播方向各向异性的因素进行更深入的分析.
致谢我们非常感谢ECMWF和MERRA提供水平风场数据.我们也感谢TRMM团队提供降雨数据.同时,我们也非常感谢中国子午工程提供数据.
References
Alexander M J, Holton J R, Durran D R. 1995. The gravity wave response above deep convection in a squall line simulation.J.Atmos.Sci., 52(12): 2212-2226.
Alexander M J, May P T, Beres J H. 2004. Gravity waves generated by convection in the Darwin area during the Darwin Area Wave Experiment.J.Geophys.Res., 109: D20S04, doi: 10.1029/2004JD004729.
Baker D J, Stair A T. 1988. Rocket measurements of the altitude distributions of the hydroxyl airglow.Phys.Scripta, 37(4): 611-622.
Buss S, Hertzog A, Hostettler C, et al. 2004. Analysis of a jet stream induced gravity wave associated with an observed ice cloud over Greenland.Atmos.Chem.Phys., 4: 1183-1200.
Coble M R, Papen G C, Gardner C S. 1998. Computing two-dimensional unambiguous horizontal wavenumber spectra from OH airglow images.IEEET.Geosci.RemoteSensing, 36(2): 368-382.
Dewan E M, Picard R H. 1998. Mesospferic bores.J.Geophys.Res., 103(D6): 6295-6305.
Dou X K, Li T, Tang Y H, et al. 2010. Variability of gravity wave occurrence frequency and propagation direction in the upper mesosphere observed by the OH imager in Northern Colorado.J.Atmos.Sol.Terr.Phys., 72(5-6): 457-462.
Ejiri M K, Shiokawa K, Ogawa T, et al. 2003. Statistical study of short-period gravity waves in OH and OI nightglow images at two separated sites.J.Geophys.Res., 108(D21): 4679, doi: 10.1029/2002JD002795.
Fovell R, Durran D, Holton J R. 1992. Numerical simulations of convectively generated stratospheric gravity waves.J.Atmos.Sci., 49(16): 1427-1442.
Garcia F J, Taylor M J, Kelley M C. 1997. Two-dimensional spectral analysis of mesospheric airglow image data.Appl.Optics, 36(29): 7374-7385.
Hecht J H, Walterscheid R L, Hickey M P, et al. 2001. Climatology and modeling of quasi-monochromatic atmospheric gravity waves observed over Urbana Illinois.J.Geophys.Res., 106(D6): 5181-5195, doi: 10.1029/2000JD900722.
Hecht J H, Kovalam S, May P T, et al. 2004. Airglow imager observations of atmospheric gravity waves at Alice Springs and Adelaide, Australia during the Darwin Area Wave Experiment (DAWEX).J.Geophys.Res., 109: D20S05, doi: 10.1029/2004JD004697.
Hedin A E, Fleming E L, Monson A H, et al. 1996. Empirical wind model for the upper, middle and lower atmosphere.JournalofAtmosphericandTerrestrialPhysics, 58(13): 1421-1447.
Horinouchi T, Nakamura T, Kosaka J I. 2002. Convectively generated mesoscale gravity waves simulated throughout the middle atmosphere.GeophysRes.Lett., 29(21): 3-1-3-4, doi: 10.1029/2002GL016069. Kim Y H, Lee C S, Chung J K, et al. 2010. Seasonal variations of mesospheric gravity waves observed with an airglow all-sky camera at Mt. Bohyun, Korea (36° N).J.Astron.SpaceSci., 27(3): 181-188, doi: 10.5140/JASS.2010.27.3.181. Kubota M, Fukunishi H, Okano S. 2001. Characteristics of medium- and large-scale TIDs over Japan derived from OI 630-nm nightglow observation.Earth,PlanetsSpace, 53(7): 741-751.
Lane T P, Reeder M J, Clark T L. 2001. Numerical modeling of gravity wave generation by deep tropical convection.J.Atmos.Sci., 58(10): 1249-1274.
Lane T P, Sharman R D, Clark T L, et al. 2003. An investigation of turbulence generation mechanisms above deep convection.J.Atmos.Sci., 60(10): 1297-1321, doi: 10.1175/1520-0469.
Li Q, Xu J, Yue J, et al. 2011b. Statistical characteristics of gravity wave activities observed by an OH airglow imager at Xinglong, in northern China.Ann.Geophys., 29(8): 1401-1410.
Li Z H, Liu A Z, Lu X, et al. 2011a. Gravity wave characteristics from OH airglow imager over Maui.J.Geophy.Res., 116: D22115, doi: 10.1029/2011JD015870.
Medeiros A F, Taylor M J, Takahashi H, et al. 2003. An investigation of gravity wave activity in the low-latitude upper mesosphere: propagation direction and wind filtering.J.Geophys.Res., 108(D14): 4411. Medeiros A F, Buriti R A, Machado E A, et al. 2004a. Comparison of gravity wave activity observed by airglow imaging at two different latitudes in Brazil.J.Atmos.Sol.-Terr.Phys., 66(6-9): 647-654. Medeiros A F, Takahashi H, Batista P P, et al. 2004b. Observations of atmospheric gravity waves using airglow all-sky CCD imager at Cachoeira Paulista, Brazil (23°S, 45°W).GeofisicaInternational, 43(1): 29-39. Medeiros A F, Takahashi H, Buriti R A, et al. 2005. Atmospheric gravity wave propagation direction observed by airglow imaging in the South American sector.J.Atmos.Sol.-Terr.Phys., 67(17-18): 1767-1773. Nakamura T, Higashikawa A, Tsuda T, et al. 1999. Seasonal variations of gravity wave structures in OH airglow with a CCD imager at Shigaraki.EarthPlanetsSpace, 51(7-8): 897-906.
Nakamura T, Aono T, Tsuda T, et al. 2003. Mesospheric gravity waves over a tropical convective region observed by OH airglow imaging in Indonesia.Geophys.ResLett., 30(17): 1882, doi: 10.1029/2003 GL017619.
Narayanan V L, Gurubaran S. 2013. Statistical characteristics of high frequency gravity waves observed by OH airglow imaging from Tirunelveli (8.7°N).J.Atmos.Sol.-Terr.Phys., 92: 43-50.
Pautet P D, Taylor M J, Liu A Z, et al. 2005. Climatology of short-period gravity waves observed over northern Australia during the Darwin area wave experiment (DAWEX) and their dominant source regions.J.Geophys.Res., 110: D03S90.
Richter J H, Sassi F, Garcia R R. 2010. Toward a physically based gravity wave source parameterization in a general circulation model.J.Atmos.Sci., 67(1): 136-156.
Shiokawa K, Suzuki S, Otsuka Y, et al. 2007. An intense gravity wave near the mesopause region observed by a Fabry-Perot interferometer and an airglow imager.J.Geophys.Res., 112: D07106, doi: 10.1029/2006JD007385.
Song I S, Chun H Y, Lane T P. 2003. Generation mechanisms of convectively forced internal gravity waves and their propagation to the stratosphere.J.Atmos.Sci., 60(16): 1960-1980.
Stockwell R G, Lowe R P. 2001a. Airglow imaging of gravity waves: 1. Results from a small network of OH nightglow scanning imagers.J.Geophys.Res., 106(D15): 17185-17203, doi: 10.1029/2001JD900035. Stockwell R G, Lowe R P. 2001b. Airglow imaging of gravity waves: 2. Critical layer filtering.J.Geophys.Res., 106(D15): 17205-17220, doi: 10.1029/2001JD900036.
Suzuki S, Shiokawa K, Otsuka Y, et al. 2004. Statistical characteristics of gravity waves observed by an all-sky imager at Darwin, Australia.J.Geophys.Res., 109: D20S07, doi: 10.1029/2003JD004336. Suzuki S, Shiokawa K, Otsuka Y, et al. 2007. Gravity wave momentum flux in the upper mesosphere derived from OH airglow imaging measurements.EarthPlanetsSpace, 59(5): 421-428.
Tang J, Swenson G R, Liu A Z, et al. 2005. Observational investigations of gravity wave momentum flux with spectroscopic imaging.J.Geophys.Res., 110: D09S09, doi: 10.1029/2004JD004778.
Tang Y H, Dou X K, Li T, et al. 2014. Gravity wave characteristics in the mesopause region revealed from OH airglow imager observations over Northern Colorado.J.Geophys.Res., 119(1): 630-645, doi: 10.1002/2013JA018955. Taylor M J, Ryan E H, Tuan T F, et al. 1993. Evidence of preferential directions for gravity wave propagation due to wind filtering in the middle atmosphere.J.Geophys.Res., 98(A4): 6047-6057, doi: 10.1029/92JA02604.
Taylor M J, Hapgood M A. 1988. Identification of a thunderstorm as a source of short period gravity waves in the upper atmospheric nightglow emissions.Planet.SpaceSci., 36(10): 975-985.
Vadas S L, Fritts D C. 2001. Gravity wave radiation and mean responses to local body forces in the atmosphere.J.Atmos.Sci., 58(16): 2249-2279.
Vadas S L, Fritts D C. 2009. Reconstruction of the gravity wave field from convective plumes via ray tracing.Ann.Geophys., 27(1): 147-177.
Vadas S L, Yue J, She C Y, et al. 2009. A model study of the effects of winds on concentric rings of gravity waves from a convective plume near Fort Collins on 11 May 2004.J.Geophys.
Walterscheid R L, Schubert G, Brinkman D G. 2001. Small-scale gravity waves in the upper mesosphere and lower thermosphere generated by deep tropical convection.J.Geophys.Res., 106(D23): 31825-31832, doi: 10.1029/2000JD000131.
Wang C. 2010. New chains of space weather monitoring stations in China.SpaceWeather, 8: S08001, doi: 10.1029/2010SW000603.Wang C M, Li Q Z, Xu J Y, et al. 2014. Statistical characteristics analysis of atmospheric gravity waves with OH all-sky airglow imagers at low-latitude region of China.ChineseJ.Geophys. (in Chinese), 57(11): 3659-3667, doi: 10.6038/cjg20141120.
Wu D L, Waters J W. 1996. Satellite observations of atmospheric variances: A possible indication of gravity waves.Geophys.Res.Lett., 23(24): 3631-3634.
Wu Q, Killeen T L. 1996. Seasonal dependence of mesospheric gravity waves (<100 km) at Peach Mountain Observatory, Michigan.Geophys.Res.Lett., 23(17): 2211-2214.
Yue J, Vadas S L, She C Y, et al. 2009. Concentric gravity waves in the mesosphere generated by deep convective plumes in the lower atmosphere near Fort Collins, Colorado.J.Geophys.Res., 114: D06104, doi: 10.1029/2008JD011244.
附中文参考文献
王翠梅, 李钦增, 徐寄遥等. 2014. 基于OH全天空气辉成像仪观测的中国低纬地区的重力波传播统计特征. 地球物理学报, 57(11): 3659-3667, doi: 10.6038/cjg20141120.
(本文编辑胡素芳)
Gravity wave characteristics from multi-stations observation with OH all-sky airglow imagers over mid-latitude regions of China
WANG Cui-Mei1,2, LI Qin-Zeng1, XU Ji-Yao1, YUAN Wei1
1StateKeyLaboratoryofSpaceWeather,CenterforSpaceScienceandAppliedResearch,
ChineseAcademyofSciences,Beijing100190,China2UniversityofChineseAcademyofSciences,Beijing100049,China
AbstractGravity waves were observed by 6 OH airglow all-sky imagers at mid-latitude regions of China from January 2012 to December 2013. The result shows that the horizontal wavelengths, observed periods, and horizontal phase speeds were typically in the range of 10~35 km, 4~12 min, and 30~100 m/s, respectively. Gravity waves prefer to polarward propagation in summer. However, they tend to equatorward and parallel to the equator propagation during winter. Through TRMM satellite and ECMWF data sets, we find that the convective activity at the south of observation stations might mainly explain the northward propagation preference in summer. However, the jet streams near tropopause might play dominant role in determining preferred propagation direction of gravity waves during winter. Simultaneously, the result also suggests that the filtering effect of background wind from the low and middle atmospheric is matched well with propagation direction of AGWs just in summer in the mid-latitude of China in MLT region.
KeywordsAirglow imager; Atmospheric gravity waves; Propagation; Wave source; Filtering effect
基金项目国家自然科学基金(41229001,41331069,41404121)和国家重点基础研究专项经费(2011CB811405)联合资助.
作者简介王翠梅,女,1989年生,中国科学院大学博士研究生,研究方向是中高层大气. E-mail:cmwang@spaceweather.ac.cn
doi:10.6038/cjg20160502 中图分类号P421 Res., 114: D06103, 10.1029/2008JD010753. Walterscheid R L, Hecht J H, Vincent R, et al. 1999. Analysis and interpretation of airglow and radar observations of quasi-monochromatic gravity waves in the upper mesosphere and lower thermosphere over Adelaide, Australia (35°S, 138°E). J. Atmos. Sol.-Terr. Phys., 61(6): 461-478, 10.1016/S1364-6826(99)00002-4.
收稿日期2015-11-13,2016-02-25收修定稿
王翠梅, 李钦增, 徐寄遥等. 2016. 基于多台站OH全天空气辉成像仪观测的中国中纬地区重力波传播特性.地球物理学报,59(5):1566-1577,doi:10.6038/cjg20160502.
Wang C M, Li Q Z, Xu J Y, et al. 2016. Gravity wave characteristics from multi-stations observation with OH all-sky airglow imagers over mid-latitude regions of China.ChineseJ.Geophys. (in Chinese),59(5):1566-1577,doi:10.6038/cjg20160502.

