Mixture temperature prediction of waxy oil–water two-phase system flowing near wax appearance temperature☆
Ali Piroozian *,Muhammad A.Manan Issham IsmailRahmat Mohsin ,Ali Esfandyari Bayat,Mac Darlington Uche Onuoha ,Mahmoud Hemmati
1 Department of Petroleum Engineering,Faculty of Petroleum and Renewable Energy Engineering,Universiti Teknologi Malaysia,Johor 81310,Malaysia
2 Malaysia Petroleum Resources Corporation(UTM-MPRC)Institute for Oil and Gas,Universiti Teknologi Malaysia,Johor 81310,Malaysia
3 Offshore Oil and Gas Research Center,College of Mechanical and Oil/Gas Transportation Engineering,China University of Petroleum,Beijing 102249,China
1.Introduction
Temperature plays a vital role in the determination of flow behaviour of crude oils in oil–water two-phase flow systems.Despite the fact that great effort has been devoted to the study of oil–water two-phase flow,few studies have paid heed to the role of temperature.The temperature sensitivity of such systems reaches its highest intensity especially in cases of dealing with waxy crude oils at temperatures near their wax appearance temperatures(WAT).Lack of necessary precaution to control the mixture temperature causes the existing colloidal particles within the crude oil,such as paraffin wax,to find the chance of being separated into solid form.This phenomenon will change the rheological properties of the crude oil as well as the mixture of oil–water[1].Accordingly,the produced pressure drop,which is the main parameter to be determined in most studies,along the pipeline is also affected.This,in turn,leads to complication of study along with high level of uncertainty in outcome.Therefore,controlling the mixture temperature especially in waxy crude oils and water integration in two-phase flow system is crucial.This is fundamental to avoid any uncontrolled abrupt changes in temperature which could trigger undesirable effects in operational conditions.
As for the influence of temperature,available literatures on oil–water two-phase flow are divided into two major groups.Firstly,those studies in which the role of temperature has been completely ignored,such as research works carried out by[2–10].The second group comprises those studies taking the effect of temperature into account in the absence of wax components[11–13].This could be due to the use of synthetic or treated oil samples where no parraffin wax presented in their systems,similar to the works of[11,12].Even though wax may be found as a constituent of the oil sample in some previous research works[13],as an example,the operational temperatures were set much higher than the WAT.Therefore,a key limitation of prior studies is that they do not address the temperature conditions at which problems associated with waxy crude oils may occur in oil–water two-phase flow systems.
Another key factor to be considered is temperature variations in two-phase flow systems that are highly dependent on geographical positions and seasonal changes.This is of higher importance especially in tropical regions since temperature changes during a full day may be as high as 10°C[14].As a matter of fact,variations in ambient temperature will directly affect input temperature of each phase when fluids are stored in open-surface tanks.Disregarding changes in ambient temperature result in obtaining unreliable data.Accordingly,the findings in two-phase flow studies might be mistakenly ascribed to other parameters rather than rheological alterations caused by the temperature changes.
One solution to control the mixture temperature in order to achieve the pre-planned temperature is feeding the system with fluids having identical temperature.If the system is assumed to be adiabatic,the mixture of fluids is also expected to have the same temperature as its individual component throughout the system.This condition is approachable if the participant fluids have relatively close heat capacity and their respective magazines are equipped with a cooling system which comprises a chiller and copper tubes.Concerning crude oil and water,not only have they different heat capacities but also wax crystals may form on the surface of the copper tube.This happens when high cooling rate is required and therefore the temperature of cooling agent within the copper tube has to fall below WAT.At this point,wax crystals growth on the surface of the copper tube is expected by further cooling which forms a covering layer of insulation around the pipe[1].Hence,a very slow cooling flow rate,which is a time-consuming process,is required to chill the crude oil to prevent the appearance of wax particles in the oil tank.Accordingly,the major drawback of this approach is that crude oil and water will not reach the same temperature at a reasonable time.
Based on the fact that paraffinic waxes are present in all types of crudes regardless of their proportion,it highlights the significance of the study with respect of waxes in two-phase flow research works[15].In order to determine the effect of wax particles on the behaviour of two-phase flow,the characteristics of flow should be investigated at temperatures close to WAT.This encompasses a range of temperatures at which crude oil retains its flowability and is transported in actual operational conditions.
This paper presents a new method of controlling the mixture temperature of waxy crude oil and water in a horizontal two-phase flow system at temperatures close to the WAT.In this regard,two analytical models have been derived from calorimetry equation based on the two existing correlations for crude oil heat capacity to predict the mixture temperatures prior to experimental tests.Three predetermined mixture temperatures Tm,prd(26 °C,28 °C and 30 °C)were defined as desired thermal conditions.Mixture temperatures were also experimentally measured via a horizontal two-phase flow facility.The outcome from the two models,as predicted mixture temperatures,is then evaluated against the experimental results.Besides,the functionality of the new approach to obtain the desired temperatures is also assessed by comparing the experimental results with the predetermined temperatures.Finally,the performance of the two models is discussed.
2.Methods and Materials
2.1.Prediction of mixture temperature
The basis for derivation of the models used in this research is the law of energy conservation.The fact that energy is conserved in an insulated system implies that in an isothermal two-phase flow the total heat lost by the warmer phase is gained by the volume of the cooler phase.In addition,the mixture will reach a thermal equilibrium if the pipeline is long enough.Eq.(1)which is known as calorimetry formula expresses the heat loss from a liquid to its surroundings:

where Q is the quantity of the transferred energy as heat,m,c,Tfand Tiare the mass,specific heat capacity, final and initial temperature of the liquid respectively.For simplicity's sake,ΔT is sometimes substituted for the temperature change.The positive and negative signs before the energy indicate either the liquid sample is giving off or gaining heat.Eq.(1)was then evolved to represent the mixture temperature of oil and water through the test section based on the law of energy conservation as follows:

where the subscript“c”is for the calefactory phase and“e”for the endothermic phase.
Eq.(4)shows that the mixture temperature is a function of three initial physical properties of the two phases.Therefore,the initial temperatures were empirically measured in the first place for the purpose of predicting mixture temperatures.In the second place,heat capacities were calculated whilst the input masses could be determined by knowing the prearranged flow rates.In the following sections,the methods and models which have been utilised to determine such characteristics are discussed.
The temperatures of the fluids in their magazines were detected by a digital thermometer(Model:SK-1250MC;measuring range:-30.0 to 150.0 °C and resolution of 0.1 °C at-30.0 to 150.0 °C)and the values were simultaneously recorded.The collected data were considered as the initial temperature of those phases.
The input mass flow rate of each phase was determined by solving Eq.(5)for a preset of volumetric flow rates(range from 137×10-6to 137×10-5m3⋅s-1)and measured densities at input temperatures.

The specific heat capacity of the fluids is the crucial part to be specified for a precise prediction of the mixture temperature.To date,there are few correlations for prediction of such properties which have been mostly used in commercial pipeline software,such as PVTSIM,OLGA,OPSIM and PIPESIM[16].To this end,the following sections explore the selected correlations utilised in this study to compute the heat capacities as a function of temperature.
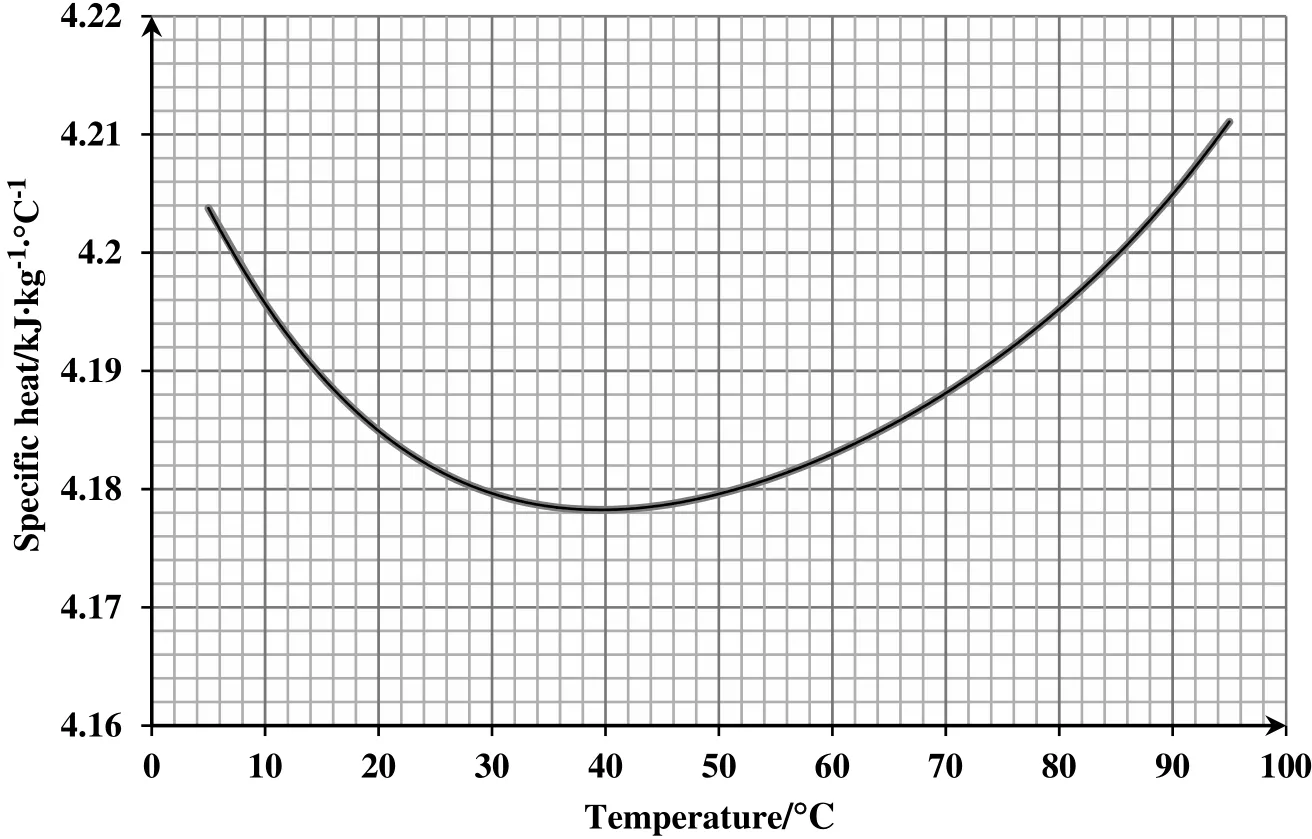
An empirical correlation is obtained based on the presented data for water heat capacity reported by Wagner et al.[17].Eq.(6)is a polynomial fit to the aforementioned data driven in SI unit.Fig.1 shows the dependency of water heat capacity to temperature for a temperature range between 5 °C and 95 °C.

Similar attempts have been made to develop equations for estimation of changes in the specific heat of crude oils as a function of API gravity and temperature.This study exploits the two most commonly used predictive correlations which have been proposed by Manning and Thompson[15]and Speight[18].For such an aim,Eq.(7)is made by regression of the extracted heat capacity of oil and temperature data which are graphically published by Manning and Thompson[15].In their work,the characterisation factor(UOP K)of crude oils has been considered as the correction factor and Eq.(7)has been developed for a UOP index of11.8.Therefore,classifying the types of crudes according to their components has been taken into account in the published work.Moreover,the technical data represent heat capacity of petroleum liquids based on the experimental results for several crude oils as reported in API Re finery Data Book[19].Eq.(8),on the other hand,was applied as the second correlation which is adapted from a recently published model by Speight[18].

Fig.1.Water specific heat capacity vs.temperature(data extracted from Wagner et al.[17]).

where the initial oil temperature Tois in Celsius and SG15is the oil specific gravity at 15°C.
Solution procedure
Fig.2 indicates the required procedure for prediction of the mixture temperatures prior to experimental runs.It starts by inserting the values of the oil and water physical properties into Eqs.(5)–(8)for the determination of ṁo,ṁw,Cp,w,(Cp,o)1and(Cp,o)2.After specifying quantitative values for all the required parameters,Eq.(4)is used to calculate the two mixture temperatures(Tm,1and Tm,2)based on(Cp,o)1and(Cp,o)2.An experiment was carried out to verify the validity of the proposed models to see if there would be any discrepancy between the predicted and predetermined Tm,prdvalues which was found to be less than 0.5°C.However,if expectations are far reached,new oil and water temperatures would be set and the procedure would be repeated as well.
2.2.Experimental facility
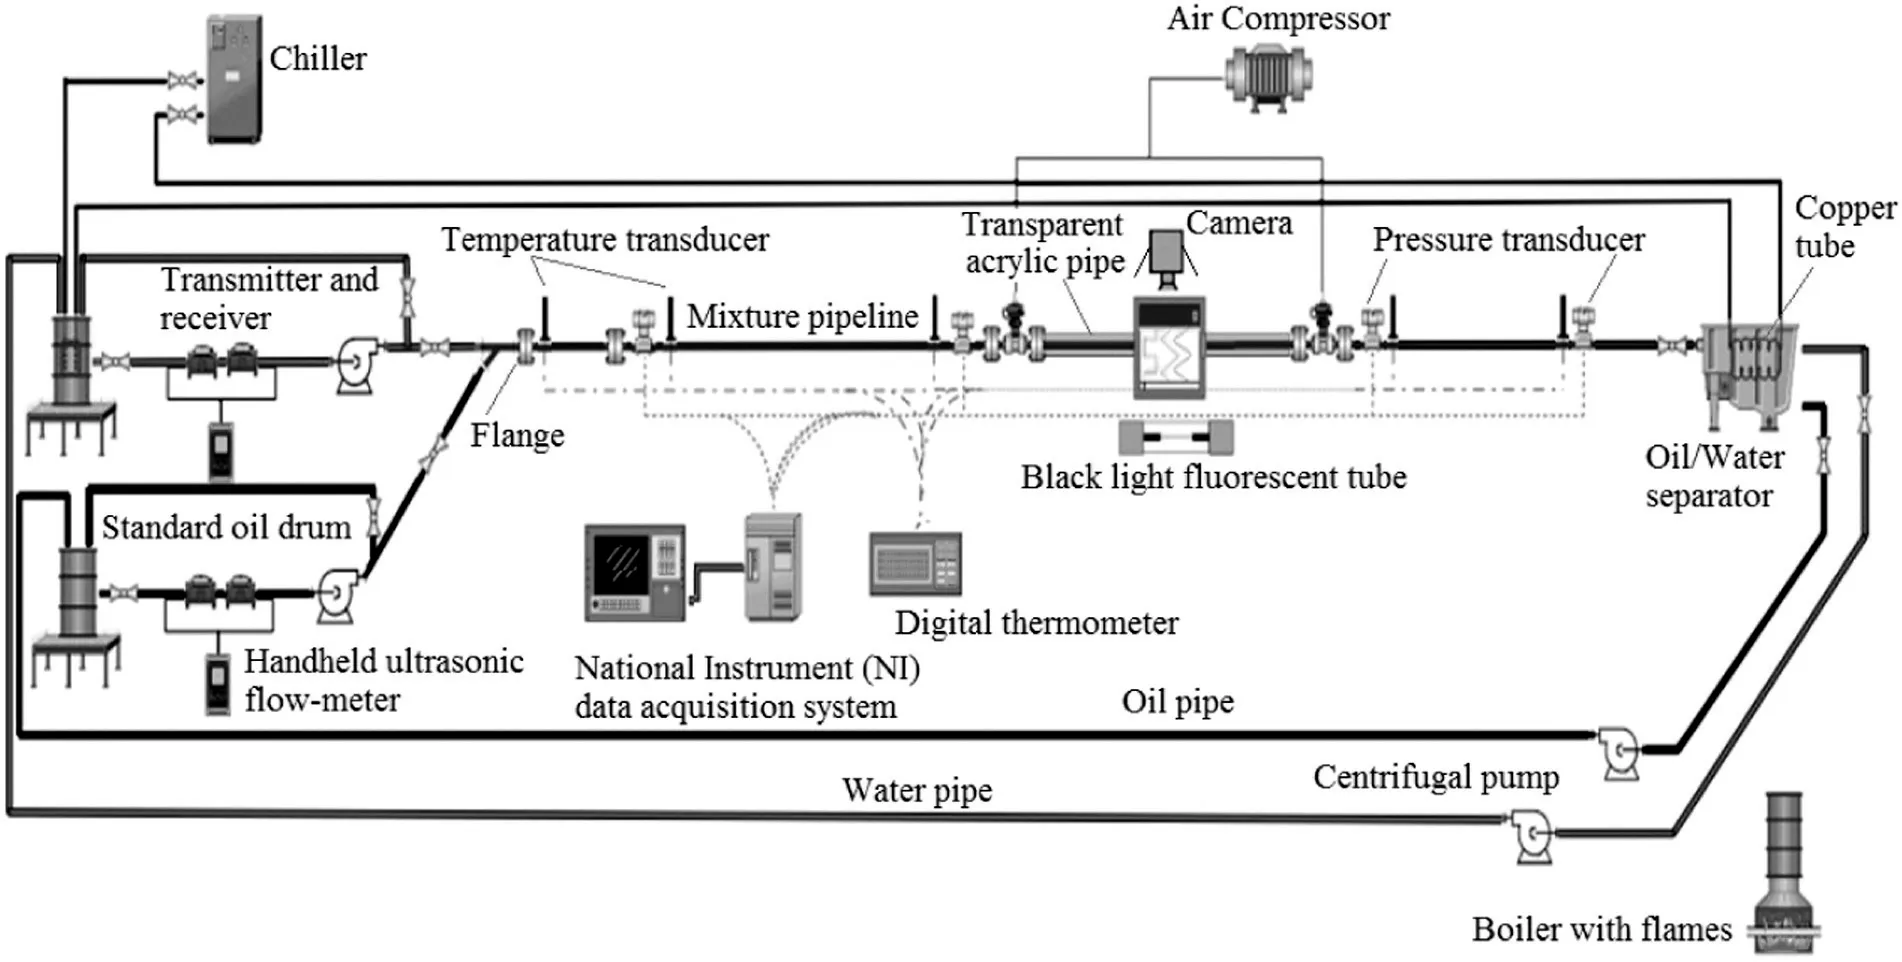
A flow test facility was designed,developed and commissioned at the Malaysia Petroleum Resources Corporation Institute for Oil and Gas(UTM-MPRC Institute for Oil and Gas),Universiti Teknologi Malaysia(UTM).The facility is capable of simulating single or two phase flow of oil and water in a horizontal pipe section.Fig.3 illustrates the schematic diagram of the oil–water experimental setup.

Fig.2.Flow chart for prediction of oil–water mixture temperature before running the experimental tests.

Fig.3.Schematic diagram of the oil–water test facility.

Table 1 Properties of the Malaysian waxy crude oil
The rig consists of four main segments,namely feeding section,test section,return section and the cooling section.Firstsection comprises of oil and water magazines with volume capacity of 0.2 m3each,two 2-HP centrifugal pumps(having a maximum speed of 2900 r·min-1and capacity of 42 m3·h-1)and ‘Y’mixing point.This is followed by two 8.38 m and 4.75 m long straight carbon steel pipes(ID:3.81 cm)which are connected by 2.36 long acrylic pipe(ID:3.81 cm)for making the test section.In addition,an oil–water separator together with another two centrifugal pumps and two return lines has been provided forthe return section.Lastly,a combination of industrial water chillier(Model:SP30;cooling capacity of 12,641.72 kJ·h-1)and spiral copper tubes(located inside the water tank and specific part of the separator)are used as the cooling section.
Apart from the main segments,some appropriate instruments are also installed on the facility for data acquisition purpose.Among the instruments the most important are thermocouples and flow metres.The test section of the rig has been facilitated with four thermocouple probes(type HT-1;accuracy:±0.1°C from 0 to 50 °C)which were connected to temperature indicators(TPM-900)to display the detected mixture temperatures with accuracy of ±0.5 °C and resolution of 0.1°C.The flow rates can be measured with high accuracy of 1%using individual ultrasonic flow metre(TUF-2000H-TM 1-5)which is placed a metre from the pump for each pipeline.Although pressure drop,flow pattern and liquid hold-up which are part of pipe flow experiments are out of concern in the current study,the auxiliary instruments such as pressure transducers,transparent section,quick closing valves and video recorder were integrated to enhance further studies.It is also noteworthy to mention that the pipeline was properly wrapped with fibreglass tape in insulation materials(model no:FD-EG106-R)for thermal insulation and energy conservation.

Fig.4.Variations of temperature in a relatively warm day in southern Malaysia.

Table 2 Statistical parameters used for the model evaluation presented by Vielma et al.[20]

Table 3 Comparison between the two model predictions and experimental database
As for the fluids,synthetic formation water and a typical Malaysian waxy crude oil from offshore Terengganu were used.Table 1 presents the physical properties of the crude oil which were measured in the laboratory according to standard methods.In addition,Eqs.(9)and(10)are the predictive equations for the densities of oil and water as a function of temperature respectively.

Experimental procedure
A total of 300 runs were conducted for three sets of predetermined temperatures,i.e.,26 °C,28 °C and 30 °C,close to the WAT of the crude oil.For each of the temperatures,100 runs were allocated for oil and water superficial velocity range of 0.1–1 m·s-1.The experimental procedures are outlined as follows:
(1)Water was pumped into the system to circulate for half an hour regardless of its temperature to ensure that the whole system was in thermal equilibrium with water.
(2)Temperatures of oil and water were measured at their respective tanks after the requirement in Step 1 was considered satisfactory.The two models were then applied to predict the mixture temperature for the prearranged super ficial velocities.
(3)Where deviation of the estimated values from the predetermined temperature met the aforementioned criteria in Fig.3,experiment was carried out to Step 4.Otherwise,the chiller was turned on and set for new temperatures.Then,the procedure had to be repeated from Step 1.
(4)Both oil and water were introduced into the system and the flow rates were controlled by the frequency of the pumps and measured using the ultrasonic flow metres.
(5)Upon reaching the predetermined flow rates,temperatures detected by the individual thermocouples were recorded and the average of the irrespective readings was taken as the mixture temperature.
3.Results and Discussion
Atmospheric temperature changes were studied in a relatively warm day in southern Malaysia,where the experimental investigations were carried out,and the results are illustrated in Fig.4.It shows a maximum temperature change of about 5°C in 10 h.Yet,the recorded temperatures may differ substantially in different days.This supports the statement of McKnight[14]and the need to address the climatic changes especially in tropical countries like Malaysia when dealing with temperature sensitive systems.Therefore,the need for a strategic measure to scuttle the problems pertaining to temperature sensitive systems becomes imperative and will require extensive experimental evaluations in order to achieve substantial results.
A total number of 600 data were collected for the two models at different test conditions and the following analyses are discussed based on Tables 2–4.We first compared the computed results from the calorimetry equation based on the two existing models against the experimental results for the defined three predetermined temperatures at different mixture velocities.For fulfilment of such a purpose,several statistical parameters(Table 2)were applied accordingly as suggested by Vielma et al.[20].These parameters are a function of the relative percent error which is defined as follows:

where ERis the relative percent error in percent,(Tm)1&2is the predicted mixture temperature either from model 1 or 2 in°C and(Tm)expis the measured experimental mixture temperature in°C.
The second model in Table 3 shows slightly better average error E1in comparison to the first model for all the three temperature conditions.This performance can also be seen in absolute average error(E3)as concerned(0.80%,0.62%,0.53%for model 1;0.74%,0.54%,0.52%for model2).Nonetheless,both models exhibited acceptable average errors and absolute average errors which are much smaller than their standard errors(E2and E4).Above all,the average errors for both models are in the range of standard limits of error(±0.75%)according to ASTME230.
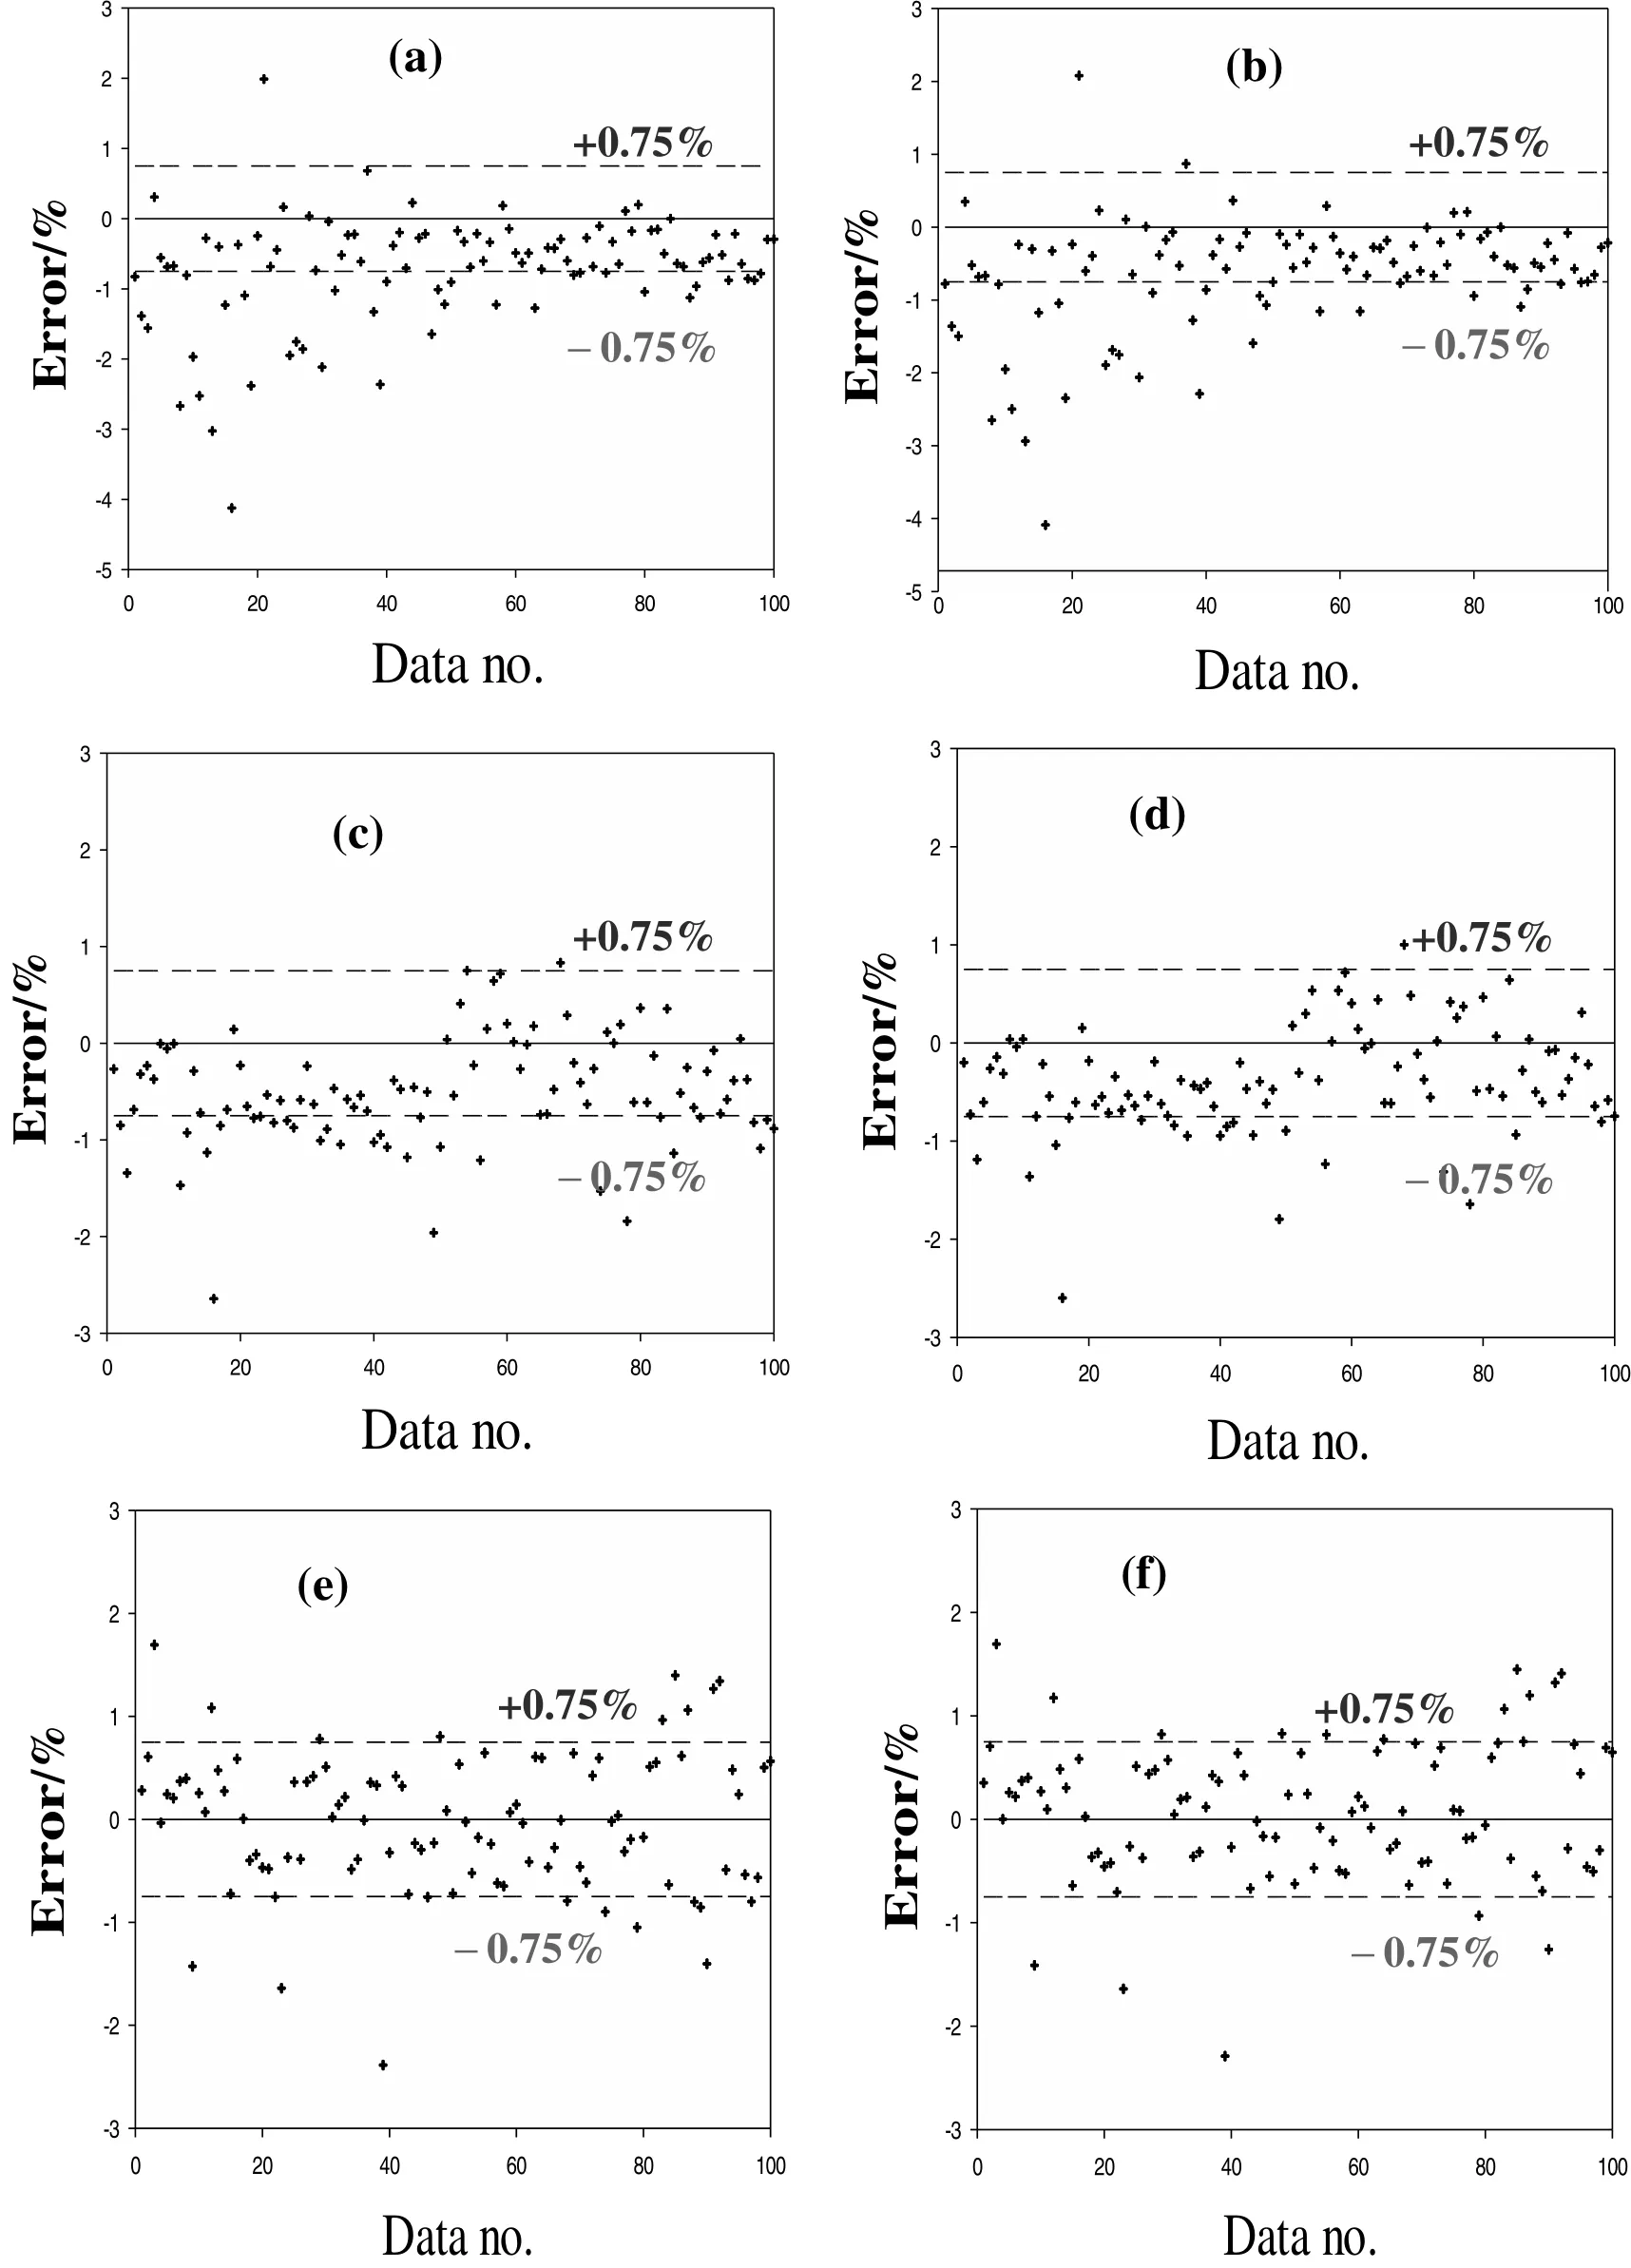
Table 4 classifies the computed data of both models in terms of their relative percent error range.As demonstrated,the total number of the errors in the safe zone(-0.75%≤ERROR≤+0.75%)is highly temperature dependent.It begins with 63 out of100 errors of model1 at26°C in the safe zone and this number of errors grew to 79 at30°C.The trend formodel2 maintains the same.Fig.5(a)–(f)has also been provided to pictorially describe such a temperature dependency.As for lower temperatures,the out of range errors(-0.75%>ERROR>+0.75%)in Fig.5 are mostly underestimated data.In contrast,these data tend to rise and locate themselves in the safe zone as the temperature increases to 30°C.
The given experimental results were then compared to the predetermined temperatures to assess the reliability of the applied approach(see Fig.6(a),(b)and(c)).Several ranges of accuracy have been colour-coded in Fig.6,among which purple represents the predetermined mixture temperatures specified for three particular sets of data.The accuracy of±0.5 °C was recognized for 73%of the recorded data from the experiments in which they were carried out at the temperature of nearly 26°C.In the same way,82%and 92%of the experimental data obtained at the temperatures of 28 °C and 30 °C respectively proved to have the similar accuracy of±0.5 °C.Finally,analysing all experimental results have revealed an accuracy of±0.5 °C between the recorded mixture temperatures and the predetermined temperatures for 84%of the cases.The good agreement between the experimental results and the predetermined temperatures justifies this new technique in terms of accuracy.

Fig.5.Evaluation of the two-existing correlations with 300 experimental data set for(a)model 1 at 26 °C,(b)model 2 at 26 °C,(c)model 1 at 28 °C,(d)model 2 at 28 °C,(e)model 1 and(f)model 2 at 30°C.

Fig.6.Temperature data comparison between experimental results and the predetermined temperatures:(a)26 °C,(b)28 °C,(c)30 °C.
It is also noteworthy to mention the effect of flow pattern on the fluids mixture temperature.Flow pattern as a reflection of crossphases configuration,determines the oil–water contact surface area which is the main parameter in heat transfer between the two liquids.Higher contiguity between the two liquid molecules results in greater heat transfer and it has been obtained through the flow patterns where one phase is partially or fully dispersed into the other[21].Consequently,the heat transfer can be through the interface between the continuous phases(in the case of partial dispersion)and/or the droplets of the dispersed phase.However,the effect of flow pattern was found surprisingly insignificant in case of dealing with waxy crude oils.This is due to the existence of natural surfactants(such as paraffin waxes and bipolar components)in waxy crudes which induces formation of water-in-oil(w/o)emulsion as a perpetual part of the flow regardless of operational conditions.This fact together with long length of the pipe(having the same temperature as the water phase)provided sufficient contact surface area for keeping the heat transfer to remain almost at its best and defusing the effect of flow pattern.
This new technique opens up new avenue for experimental investigations on the flow behaviour of waxy crude oils at temperatures close to WAT.With the use of this approach not only mixture temperature is controlled but also it prevents wax crystals at the time of injection to the system due to high cooling rate.Therefore,this novel method can be applied as a practical solution to study the flow behaviour of waxy crude oils in oil–water two-phase flow systems at temperatures relatively close to WAT.
4.Conclusions
Based on the fact that paraffinic waxes are present in all types of crudes regardless of their proportion,it highlights the significance of this study which considered waxes in its two-phase flow research work.The present work is to our knowledge the first attempt to propose a method of controlling the mixture temperature of waxy crude oil and water in a horizontal pipe flow at temperatures close to WAT.This study encompasses a range of temperatures at which crude oil retains its flowability and is transported in actual operational conditions.Two analytical models are offered by this approach and three sets of experiment were conducted to evaluate the models and the reliability of this approach.
The presented findings suggest that both models can be applied for reliable mixture temperatures estimation whilst model 2 performs slightly better than model 1.Based on the results,it can be concluded that through the new approach it is possible to reach mixture temperatures as close as±0.5°C to the predetermined ones for about84%of the data.However,the better results are found at higher temperatures relative to WAT.
Acknowledgments
The authors would like to express their sincere gratitude to the Ministry of Higher Education(MoHE)of Malaysia and University Teknologi Malaysia(UTM)for funding this research project via the Fundamental Research Grant Scheme(FRGS)Vote 4F136 and Research University Grant(RUG)Vote 01H68,respectively.
[1]J.Becker,Crude Oil Waxes,Emulsions,and Asphaltenes,Pennwell Books,1997.
[2]J.Y.Xu,D.H.Li,J.Guo,Y.X.Wu,Investigations of phase inversion and frictional pressure gradients in upward and downward oil–water flow in vertical pipes,Int.J.Multiphase Flow 36(2010)930–939.
[3]R.Dunia,A.Campo,R.Guzman,Study of pressure and temperature developing profiles in crude oil pipe flows,J.Pet.Sci.Eng.78(2011)486–496.
[4]C.Zhang,T.Zhang,C.Yuan,Oil holdup prediction of oil–water two phase flow using thermal method based on multiwavelet transform and least squares support vector machine,Expert Syst.Appl.38(2011)1602–1610.
[5]T.Al-Wahaibi,Pressure gradient correlation for oil–water separated flow in horizontal pipes,Exp.Thermal Fluid Sci.42(2012)196–203.
[6]J.Cai,C.Li,X.Tang,F.Ayello,S.Richter,S.Nesic,Experimental study of water wetting in oil–water two phase flow—Horizontal flow of model oil,Chem.Eng.Sci.73(2012)334–344.
[7]C.Tan,H.Wu,F.Dong,Horizontal oil–water two-phase flow measurement with information fusion of conductance ring sensor and cone meter,Flow Meas.Instrum.34(2013)83–90.
[8]L.Zhai,N.Jin,Z.Gao,A.Zhao,L.Zhu,Cross-correlation velocity measurement of horizontal oil–water two-phase flow by using parallel-wire capacitance probe,Exp.Thermal Fluid Sci.53(2014)277–289.
[9]L.C.Edomwonyi-Otu,P.Angeli,Pressure drop and holdup predictions in horizontal oil–water flows for curved and wavy interfaces,Chem.Eng.Res.Des.93(2015)55–65.
[10]A.S.Izwan Ismail,I.Ismail,M.Zoveidavianpoor,R.Mohsin,A.Piroozian,M.S.Misnan,M.Z.Sariman,Experimental investigation of oil–water two-phase flow in horizontal pipes:Pressure losses,liquid holdup and flow patterns,J.Pet.Sci.Eng.127(2015)409–420.
[11]Y.P.Filippov,I.Kakorin,K.Panferov,In fl uence of temperature on the algorithm to define salty water-in-oil flow characteristics,Int.J.Multiphase Flow 58(2014)52–56.
[12]Y.Lü,L.He,Z.He,A.Wang,A study of pressure gradient characteristics of oil–water dispersed flow in horizontal pipe,Energy Procedia 16(2012)1111–1117.
[13]W.Wang,J.Gong,P.Angeli,Investigation on heavy crude-water two phase flow and related flow characteristics,Int.J.Multiphase Flow 37(2011)1156–1164.
[14]T.L.McKnight,D.Hess,L.J.Onesti,Physical Geography:A Landscape Appreciation,Pearson Prentice Hall,2005.
[15]F.S.Manning,R.E.Thompson,Oil field Processing of Petroleum:Crude oil,PennWell Books,1995.
[16]P.Buthod,N.Perez,R.Thompson,Program,constants developed for SRK equation,Oil Gas J.76(1978)60–64.
[17]W.Wagner,J.Cooper,A.Dittmann,J.Kijima,H.-J.Kretzschmar,A.Kruse,R.Mares,K.Oguchi,H.Sato,I.Stocker,The IAPWS industrial formulation 1997 for the thermodynamic properties of water and steam,J.Eng.Gas Turbines Power 122(2000)150–184.
[18]J.G.Speight,The Chemistry and Technology of Petroleum,CRC Press,USA,2007.
[19]A.P.I.R.Department,Technical Data Book—Petroleum Re fining,American Petroleum Institute,1983.
[20]M.A.Vielma,S.Atmaca,C.Sarica,H.-Q.Zhang,Characterization of oil/water flows in horizontal pipes,SPE Proj.Facil.Constr.3(2008)1–21.
[21]W.Shang,C.Sarica,A model for temperature prediction for two-phase oil/water stratified flow,J.Energy Res.Technol.135(2013)032906.
Please refer to the online version for the color figures.
 Chinese Journal of Chemical Engineering2016年6期
- Chinese Journal of Chemical Engineering的其它文章
- A stepwise optimal design of water network☆
- The turbulent behavior of novel free triple-impinging jets with large jet spacing by means of particle image velocimetry☆
- Preparation and characterization of sulfated TiO2 with rhodium modification used in esterification reaction and decomposition of methyl orange☆
- Online process monitoring for complex systems with dynamic weighted principal component analysis☆
- Integration of coal pyrolysis process with iron ore reduction:Reduction behaviors of iron ore with benzene-containing coal pyrolysis gas as a reducing agent☆
- Multiple linear equation of pore structure and coal–oxygen diffusion on low temperature oxidation process of lignite☆
