Analysis of the nonlinear dynamic characteristics of two-phase flow based on an improved matrix pencil method☆
Hongwei Li*,Junpeng Liu,Yunlong Zhou,Bin Sun
School of Energy and Power Engineering,Northeast Dianli University,Jilin 132012,China
1.Introduction
Gas–liquid two-phase flow in narrow rectangular channels has been the subject of increased research interest in the past decades[1].This situation exists commonly in power engineering,petrochemical industries,and heat/mass transfer operations,also in chemical engineering equipment,such as evaporators,condensers,reactors,and heat exchangers.In gas–liquid two-phase flow,the flow pattern is the basis of successive heat and mass transfer research.Different flow patterns have different impact on heat transfer,i.e.,the appearance of slug flow and mist flow can cause heat transfer deterioration,which is very dangerous in high temperature and high pressure conditions.All these high-risk heat transfer operations require accurate identification of two-phase flow patterns.Safe and responsible development of methodologies associated with reliable heat transfer performance requires the understanding of dynamic physical characteristics for two-phase flow for better industrial system optimization design and dynamic monitoring of working conditions.
Research on conventional-sized channel flow pattern already has a good foundation[1,2].Since the1990s,a trend has been growing in the study of flow pattern identification,based on a method of chaos detection,fractal analysis,and complex networks as well as time and frequency domain analysis[3].Jin et al.[4–6]performed dynamics analysis on oil and gas–liquid two-phase flow conductance signals by using a multiple chaotic parameter index;this analysis was limited by the center of multiple gravity trajectories in the phase space.Progress has been made in revealing the mechanism of two-phase flow patterns.Gao and Jin[7]applied the complex network on the mechanical characteristics of two-phase flow to evolution analysis,and revealed the detailed mechanism of interaction between gas and liquid.Sun.et al.[8]provided the identification and analysis for the gas–liquid two-phase flow pattern and flow characteristics of a horizontal Venturi tube by adapting the optimal kernel time–frequency analysis method.Du et al.[9]analyzed the conductance signals of the gas–liquid two-phase flow by using the optimal kernel time–frequency characterization method.They accurately distinguished the different flow patterns by extracting the two time–frequency characteristic values(total energy and entropy).Manfredo[10]characterized flow properties by the phase density time–frequency distribution characteristics of gas–liquid two-phase flow image signals.Ommen et al.[11]reviewed twophase time–frequency domain analysis methods and analyzed their advantages/disadvantages in the characterization of twophase flow dynamics characteristics.The method extracting the vibration mode and their frequency and damping ratio have been applied to the two-phase flow field.This kind of algorithm mainly includes wavelet transform[12],Hilbert–Huang transform(HHT)[13,14]and stochastic subspace identification(SSI)[15].
Compared to regular channels,the information collected from tiny channels is more sensitive to changes in experimental environment,and noise reduces more severely the amount of effective information.Therefore,revealing the inherent nonlinear dynamic characteristics of a tiny channel as easily as that in a regular channel seems difficult.In this case,an effective algorithm is required to prevent noise and acquire the essentials from signals.
Matrix pencil(MP)[16,17]is an algorithm of vibration mode parameter identification,which can obtain the vibration mode of different orders.Hence,the main frequency and damping ratio can be calculated from different vibration modes.This method has been applied in power systems and in the construction field[18].However,the traditional matrix pencil algorithm is not good at identifying the mode order of signals under noisy conditions.This paper uses the stability diagram[19]to set the order of signals,and applies component energy index(CEI)to distinguish the false modals.After processing the signal order and CEI intervention by the improved MP(IMP)method,we can obtain the main vibration mode that represents typical characteristic of temporal signal.The IMP method can improve the accuracy of mode parameter identification and reduce the calculation load.This paper presents the best application of IMP method and examines the influence of signal length on the IMP calculation results and the anti-noise-interference ability.Finally,the IMP method was used to analyze the differential pressure signals of gas–liquid two-phase flow in a narrow rectangular vertical upward pipe(the inner diameter is 2.0 mm×0.81 mm).The main vibration mode frequency,damping ratio and CEI entropy were extracted to identify the flow patterns.The evolution of nonlinear dynamic physical behavior of gas bubbles was also presented.
2.Theoretical Basis
2.1.Matrix pencil
2.1.1.Matrix pencil theory
The phase interaction in gas–liquid two-phase flows is featured with high speed and uncertainty distribution characteristics.The two-phase flow fluctuation signals present coupling oscillation characteristics of different oscillation modes.The whole system can be assumed as the linear superposition,wherein the mode can be fit to

where k=0,1,...,N-1,N is the number of sampling points;Ri,αi,wiis the complex amplitude,attenuation factor and angular frequency of the i th vibration mode;M is the signal order,and Tsis the sampling interval.
Using the sampling signal y=[y(0),y(1),…,y(N-1)]Tto structure the Hankel matrix YN-L×(L+1),normally,L=N/4-N/3.The singular value decomposition can be used on the Y matrix[20]:

Taking columns which have the former M larger singularvaluesσiof diagonal matrix S to make up the matrix S1,we were able to create the right singular vectors vicorresponding to σiwhich formed V′=[v1,v2,...,vM].The matrix V1is constructed by the matrix V′without the first line,and the matrix V2is constructed by V′without the last line.
De fining Y1and Y2as follows:

whereis the pseudo-inverse matrix of Y1.G has n eigenvalues denoted by zi(i=1,2,3,...,n).
After determining the characteristic value ziof matrix G,the frequency and damping ratio can be obtained by

2.1.2.Evaluation methods
Noise resistance was regarded as an index in this study to evaluate the method of dealing with a time series with strong noise pollution.The influence of calculation results by signal length was also considered in this section.Three kinds of simulation signals:chaos(Lorenz),fractal(Conway)and periodicity(Sine)time series were employed as examples for this purpose.The reason for selecting this sequence as the simulation signals is that the signals collected from experiments usually have typical chaotic,fractal and periodicity characteristics.Another reason is that these simulation time series exhibit typical dynamic behavior,being both typical and classic.
The Lorenz,Conway and Sine series contain different types of noise composed of several groups of time series produced under the following conditions.
(1)Lorenz chaotic signal by the Lorenz equation:

with the initial condition x=2,y=2,z=20,the iteration is by fourth-order Runge–Kutta method,and the variable X taken as the simulation sequence(as shown in Fig.1(a),S1)[21].Two kinds of noise signal are:noise1=awgn(x,40 dB)(variable x is mixed with the SNR of 40 dB Gaussian white noise,as shown in Fig.1(a),S2),noise2=x+0.2×wgn(40 dB)(variable x is directly mixed with the noise intensity of 40 dB Gaussian white noise,as shown in Fig.1(a),S3).The same noise adding method is applied onto the following two signals.
(2)Conway fractal signal&noise-added signals.Conway sequences are the fractal time series(as shown in Fig.1(b),S1)produced by a deterministic recursive,which has a strict combination structure of seemingly cyclic and self-similar characteristics[5].The recursive equation is

Sequence a(n)–n/2 is the fractal signal simulation sequence(as shown in Fig.1(b),S1).Two kinds of signal adding noise are:awgn((a(n)–n/2),40 dB)(as shown in Fig.1(b),S2),(a(n)–n/2)+0.2×wgn(40 dB)(as shown in Fig.1(b),S3);
(3)Sine periodic signal&signal adding noise.sin(x)is the sine periodic signal(as shown in Fig.1(c),S1),where x is time series,sampling interval is π/50,frequency is 2.56 Hz.Two kinds of signal adding noise are:awgn(sin(x),40 dB)(as shown in Fig.1(c),S2),sin(x)+0.2×wgn(40 dB)(as shown in Fig.1(c),S3).
We applied the MP method on three systems.The frequency and damping ratio curve of different data length of three simulation signals are shown in Fig.1.When the data length of Lorenz and Conway are 3000 and 1500,respectively,the frequency and damping ratio were almost unaffected by the noise.While the data length was 1000,they had significant fluctuations,but the fluctuations only occurred on the signal with Gaussian white noise superposition directly.However,in the real world,the direct interference of Gaussian white noise to the acquisition signals(e.g.,S3 in Fig.1)is very rare,but the S2 case is very common.
It is obvious that the sine signals are easily affected by noise.When the data length is more than 1500,the influence of signals is relatively small.Generally,the MP theory is suitable for the analysis of the signal with chaotic and fractal characteristics.When the length is longer than 1500,the anti-noise ability is strong.The pressure fluctuation signals have chaotic and fractal characteristics due to the bubbles'irregular movement in the gas–liquid twophase flow containing chaotic and fractal characteristics.So the MP theory is suitable for the pressure fluctuation signals of gas–liquid two-phase flow.The signal length should be set between 1000 and 1500.
2.2.Stability diagram
The determination of order M in Eq.(1)affected the calculation results directly,so the parameters in the algorithm are very important.Stability diagram is a relatively new method of determining the system order[22].The basic idea of a stability diagram is shown in Fig.2.f is the frequency of mode vibration form in Fig.1.ξis the mode vibration form damping ratio.MAC is the mode confidence;criteria is the criterion for damping ratio.
The drawing method of stability graph can be delineated as follows:Assuming the order of the system is from nminto nmaxin turn,since the eigenvalues of the system have the characteristic of two-two conjugation,the order must be even.Thus get(nmaxnmin)/2+1=results.Then,show the results of calculation in a two-dimensional plot,where the abscissa of the plot is the frequency and the vertical axis is the order,and the stability graph is obtained.The frequency,damping and vibration mode of two adjacent points are considered to be the same in the tolerance range.
2.3.Component energy index(CEI)
Since all modes can use an energy index to measure,we can evaluate the contribution of the estimated mode according to the energy index to get a preliminary judgment of false features.The CEI is a good analysis tool.The CEI calculation process is as follows[23]:
(1)Using eigenvalue sequence{λj|j=1-N}of A to construct matrix E:
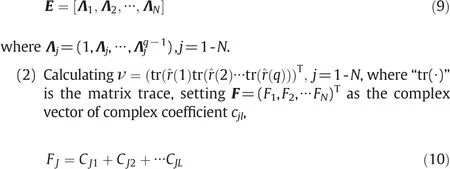

So ν can be decomposed as

(4)The definition of energy index is:

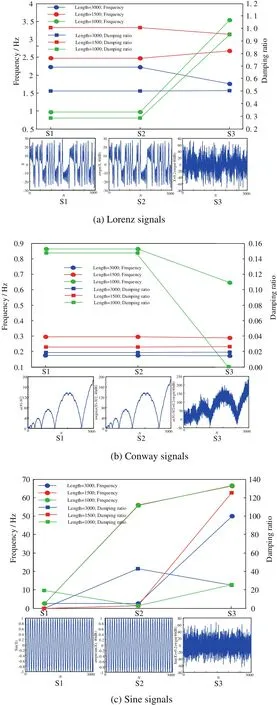
Fig.1.The frequency and damping ratio curve of different data length of three simulation signals.

Fig.2.The principle diagram of stability.
In addition to judging the false mode modes according to the application of CEI,this paper also studied the flow dynamic characteristics and pattern identification of two-phase flow based on the CEI entropy.CEI entropy can be calculated by

where p(CEI(i))is the probability that the i th element appeared in the entire sequence of CEI.
3.Experimental Setup
The schematic of the test facility is shown in Fig.3.The system consists of a gas–liquid two-phase flow,control,and data acquisition systems.
In an experiment run,the out flow of nitrogen from a nitrogen cylinder is divided into two parts in the three-way valve.The first stream flows into the test section through the flow meter and control valve;the other stream goes into the water tank to maintaining the tank pressure,which pumps water out of the water tank.The tank pressure is maintained at 0.2 MPa by adjusting the control valve.The pumped water and the gas phase are fully mixed in the mixing chamber in favor for the two-phase flow stability.After passing the test section,the two-phase mixture flows into a water tank,wherein nitrogen discharges into the atmosphere.
The test section is made of translucent Plexiglas tube.Two pressure-measuring holes with 0.5 mm diameters are used at a distance of 200 mm.A porous plate with 40 μm pore size is installed at the test section inlet to introduce the bubbles uniformly to the test section.The size of this porous plate is the same as the inlet of the test section.Small gas bubbles can be generated uniformly through this porous plate.

Fig.3.Experimental system of nitrogen–water two-phase flow.
The distance between the upstream hole and entrance is 100 mm,and the distance between the downstream hole and outlet is 80 mm.Rectangular channel cross-section width is 2 mm,and the gap is 0.81 mm.The test section,which consists of the gas–liquid two-phase mixing chamber,experimental channel,and gas–liquid two-phase separation chamber,is shown in Fig.4.
Experiment data acquisition includes pressure signal,liquid flow rate,and gas flow rate.Rosemount 3051C differential pressure transmitter(Rosemount,USA)with±0.075%accuracy,100 ms of response delay,0.1245–13790 kPa pressure calibration ranges,and 256 Hz signal sampling frequency is used to measure the differential pressure signal.
HW5 intelligent metal tube rotameter is used to measure water flow rate.It has a microprocessor as the core,and the accuracy of instantaneous and accumulated values is ±0.5%.The rotameter and 250 Ω resistance comprised the series circuit that generates 1 V to 5 V voltage signals.
D-600MD digital electromagnetic gas flow meter with 0 SLM to 5 SLM range and±1%accuracy is used for the gas flow measurement.Its signal acquisition circuit system and the HW5 flow meter are the same.
The experiment is performed under the following conditions:(0.1±0.0005)MPa environment pressure,(25±0.5)°C experimental environment temperature,0.1 m·s-1to 30 m·s-1superficial gas velocity,and 0.01 m·s-1to 5 m·s-1superficial liquid velocity.Agilent 34970 A data acquisition device,which has the resolution of 22 bits,basic direct current voltage accuracy of 0.004%and an extremely low readout noise,the scan rates up to 250 channel·s-1,is used for data acquisition.
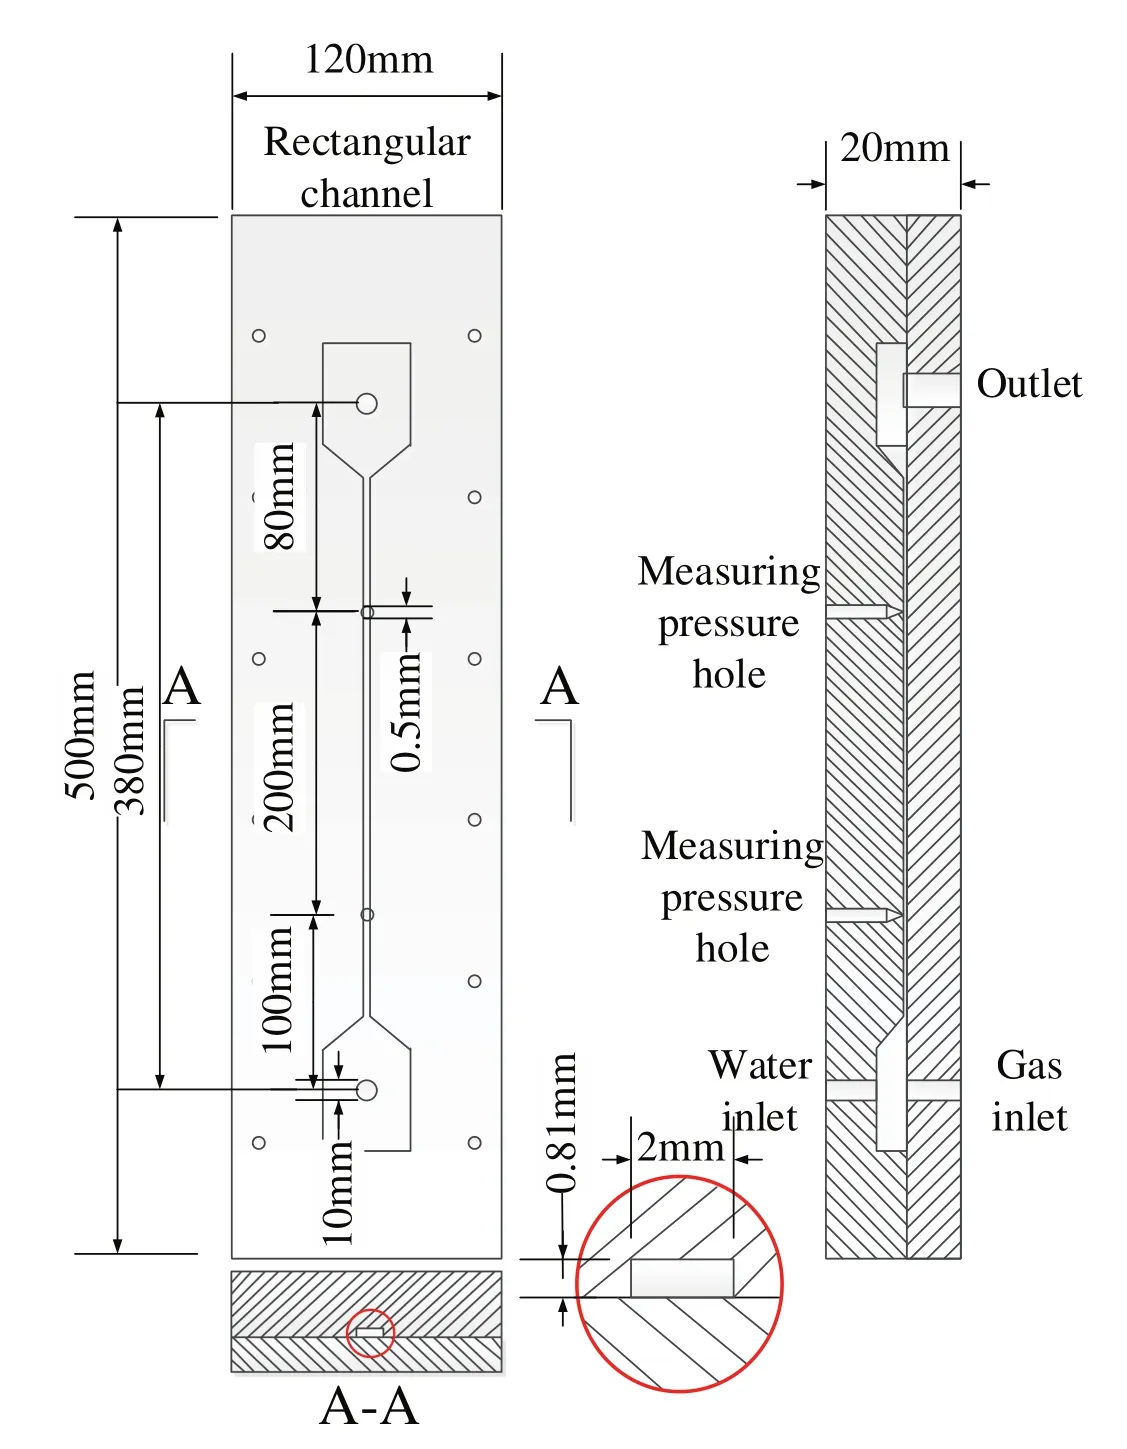
Fig.4.Schematic diagram of test section.
4.Identification and Dynamic Mechanism Analysis of Flow Patterns
We have collected differential pressure signals of five flow patterns(bubble flow,bubble-slug transition flow,slug flow,slug-churn transition flow,and churn flow)of gas–liquid two-phase flow.We selected 150 flow conditions to collect experimental data.Fig.5 shows the flow pattern map and flow pattern transition criteria for rectangular channel experimental data.The horizontal and vertical axes represent the superficial gas velocity(jG)and superficial liquid velocity(jL).Fig.6 shows the typical differential pressure signals and time–frequency diagrams of self-adapting optimal kernel transformation(AOK TFR)[12]of five flow patterns.The distributed red area in Fig.6 represents the basic frequency position of flow fluctuation signals.From Fig.6 we can find that the frequency focus of different flow patterns has certain but not obvious differences.
In order to analyze the flow mechanism effectively,we have to apply a more suitable method on the differential pressure signals of gas–liquid two-phase flow patterns in small channels.The IMP method we proposed in this paper can obtain the characteristic parameters such as frequency and damping ratio of the main vibration mode of signals and provide a quantitative analysis of the dynamic physical characteristics of the two-phase flow.Setting order is the most important step in the MP method.Using the stability diagram to set the order is the innovative part of the IMP method.
Fig.7 is the stability diagrams of five flow patterns.Overall,the stability chart of slug flow is the most regular,followed by slug-churn transition flow,churn flow,bubble flow,then the most confusing bubbleslug flow.The frequency of slug flow is in the range of 0–2 Hz and the distribution of the same frequency points is very neat,almost in a vertical line.The overall distribution is more structured with less scattered points,and it is more sparsely distributed in the high frequencies,which is related to the better cyclical nature of slug flow.Bubble flow and churn flow are more confusing than slug flow.The bubble trajectories in churn and bubble flows are very complex and random.The bubble cluster flows with liquid in the tube,the diameter of the bubble is about 1/10 of the pipe equivalent diameter,and the stability graph of its signal is somewhat similar to the Gaussian white noise,but with less consistency.The regular alternation of air plug and the liquid slug in slug flow makes the pressure fluctuation signals have a certain periodicity,as a result,the distribution of its stability graph is more structured.The slug-churn transition flow is between the slug flow and churn flow.This transition flow still maintains the basic characteristics of slug flow when it is in the process of evolution,which makes it more regular than the churn flow.However,the slug-churn transition flow is more confusing than bubble flow.The broken bubble clusters and unformed gas plugs make this transition flow even more confusing than bubble flow.Ref.[15]may be referred to for details of the application of the stability diagram in gas–liquid two-phase flow patterns identification.
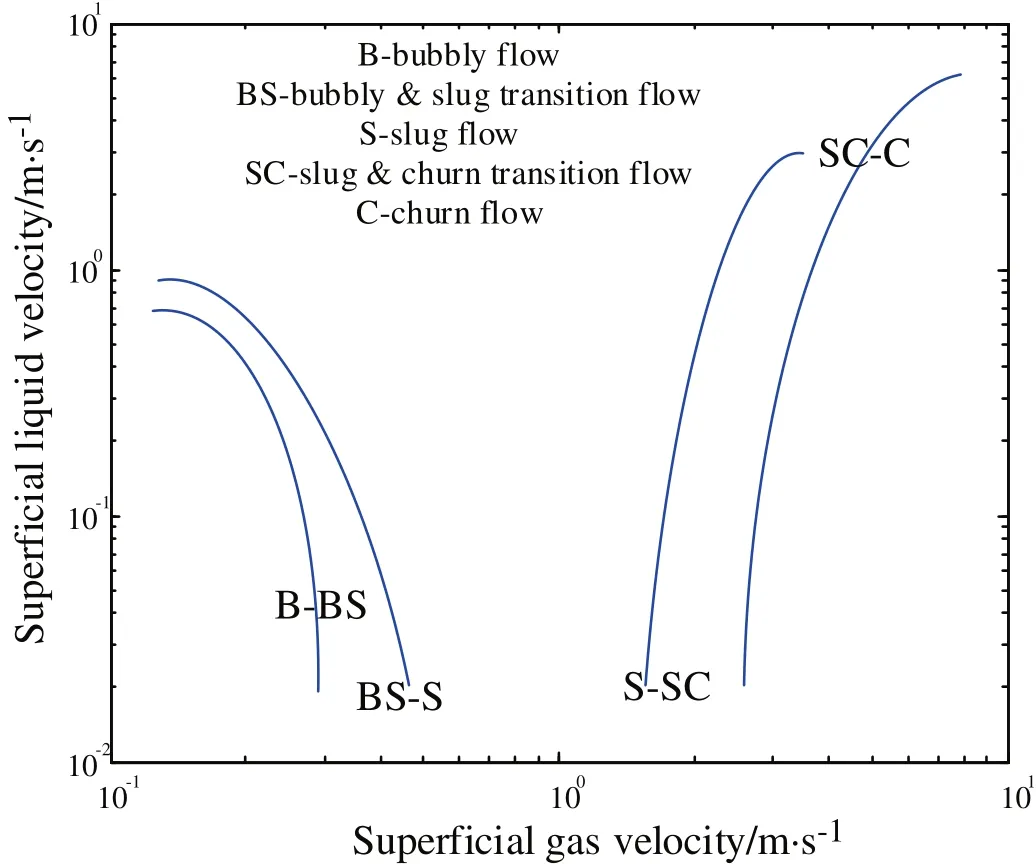
Fig.5.Flow pattern map and flow pattern transition criteria in vertical upward flow.
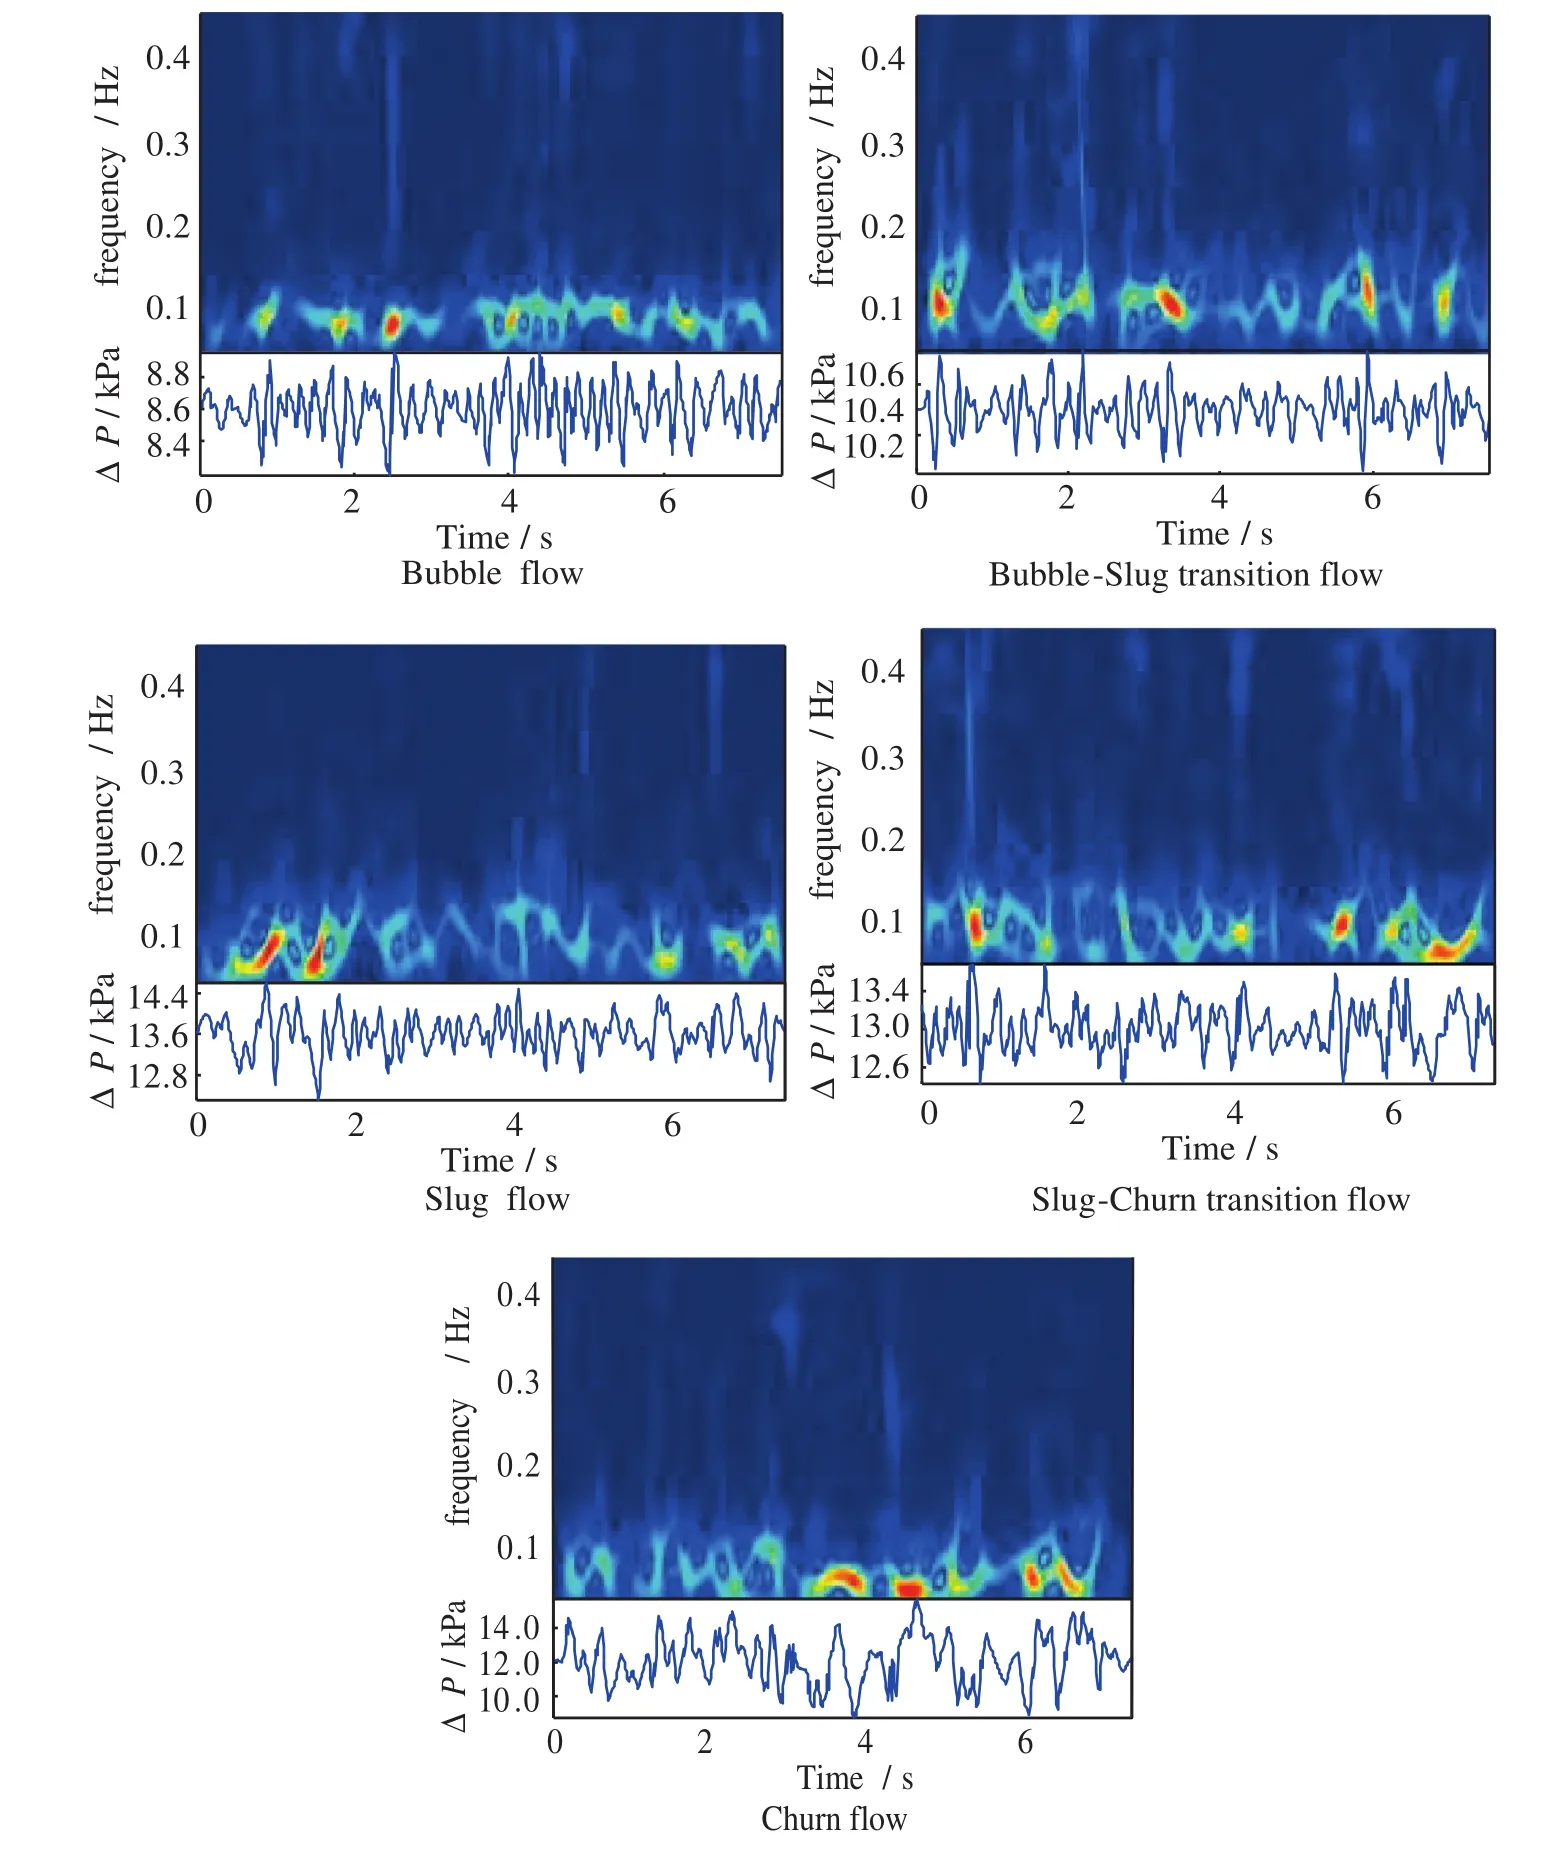
Fig.6.The typical differential pressure signal and time–frequency spectrum of flow patterns of two-phase flow.
Due to the order set by the stability diagram,which can generate false models,we can get a preliminary judgment of false features by evaluating the contribution of estimated modes according to the energy index.The CEI represents the contribution of different frequencies to the vibration mode,so the CEI is a good way to distinguish false features.In principle,the vibrations corresponding to the frequencies with low CEI values can be considered as false modes.While the vibration corresponding to the higher CEI value is considered to be the main vibration mode of the whole signals.
Fig.8 is the CEI fluctuation diagram of five flow patterns.The CEI values of five flow patterns exist more or less as several peaks in the high frequency(above 100 Hz)area due to test bench induced small vibrations from high-speed air flow.The small disturbance can generate great influence on the fluctuation signals from the small channel experiment platform.Hence,we ignore the high frequency part of CEI distribution due to this influence and only considerthe region between 0 and 100 Hz.

Fig.7.The stability diagram of five patterns.(Bubble flow:j G=0.183 m·s-1,j L=0.134 m·s-1;Bubble-slug flow:j G=0.225 m·s-1,j L=0.128 m·s-1;Slug flow:j G=0.579 m·s-1,j L=0.525 m·s-1;Slug-churn flow:j G=1.122 m·s-1,j L=0.787 m·s-1;Chrun flow:j G=2.833 m·s-1,j L=0.911 m·s-1).
In fact,the distribution characteristics of the frequency peak in the CEI fluctuation diagram is mainly decided by the bubbles'frequency.The fluctuation signals presented typical chaotic characteristics from the CEI distribution of the bubble flow.The higher CEI values are mainly concentrated in the low frequency region.The air bubbles scatter inside the tube and collide with each other,without obvious dominant frequency.Compared to the bubble flow,the CEI distribution of the bubble-slug transition flow is slightly chaotic.This flow pattern has stronger volatility and does not generate obvious peaks in the low frequency region.However,there is an obvious peak in the medium-high frequency region,which can show that the flow pattern has a certain stable cycle.The individual bubbles appear to coalescence rapidly while maintaining a stable frequency.At the same time,interspersed scattered bubbles come with the increase of gas flow.All scattered bubbles coalesce into large gas plugs with the increasing air flow,and these plugs flow close to the pipe wall at a fixed frequency.The two peaks showing a CEI value of 0.85 and 0.93 represent the intermittent appearance of air plugs by the two frequencies.The air plug intermittent is broken by the increasing air flow in a slug-churn transition flow.From the CEI distribution,we can see clearly that the unbroken gas plugs also gain stability in this cycle.On the other hand,the approximate muddied fluid presents obvious chaotic characteristic.Once the air plugs are broken completely,the mixture of foam and gas form the typical churn flow.This flow pattern is similarto the bubble flow,which has obvious chaotic characteristics.The only difference between bubbles and churn flow is that the CEI peak of churn flow is extended to the intermediate frequency region.The CEI entropy can reflect the frequency characteristic we discussed above.The more complex flow pattern is,the bigger entropy it has.Therefore,we extracted the CEI entropy to identify different flow patterns.

Fig.8.The CEI fluctuation diagram of five flow patterns.(Bubble flow:j G=0.183 m·s-1,j L=0.134 m·s-1;Bubble-slug flow:j G=0.225 m·s-1,j L=0.128 m·s-1;Slug flow:j G=0.579 m·s-1,j L=0.525 m·s-1;Slug-churn flow:j G=1.122 m·s-1,j L=0.787 m·s-1;Chrun flow:j G=2.833 m·s-1,j L=0.911 m·s-1).

Fig.9.The distinction of flow patterns according to the CEI entropy,the main vibration frequency and damping ratio characteristics.
Fig.9 shows the distinction of flow patterns according to the CEI entropy,the main vibration frequency and damping ratio characteristics.The horizontal axis represents the flow condition serial numbers that were arranged according to the flow patterns.
For the differential pressure fluctuation signals of the gas–liquid two-phase flow,the main vibration frequency represents the translation of bubbles,slugs,etc.[Fig.9(b)].Taking an example of the churn flow and the slug flow,the churn flow is the mixture of gas–liquid two phase flow.The bubble cluster generates violent fluctuations in the liquid phase at a high speed.The main frequency of churn flow is higher than other flow patterns,while the large gas plugs flow at a medium and low speed in the slug flow,making the main frequency of slug flow lower than other flow patterns.
The size of the damping ratio depends on the anti-jamming capability of the signal itself.A smaller damping ratio demonstrates a weaker anti-interference ability of signals;thus,small perturbations can lead to considerable changes.The slug and churn flows have the smallest and largest damping ratios,respectively[Fig.9(c)].Churn flow has the strongest ability to maintain the status quo ante.Given that a gas slug is easily broken by a high-speed gas flow in the slug flow,the dispersed small bubbles of the bubble flow can easily be absorbed by gradually increasing the gas flow and merging the gas slug into slightly larger gas bubbles or gas plugs.Thus,both damping ratios of bubble flow and slug flow are relatively smaller than the churn flow.
Choosing a pair of three characteristic parameters we constructed 3 maps and divided each map into five zones to identify different flow patterns[Fig.10(a)to(c)]using a k-means clustering algorithm[24].The main vibration frequency and CEI entropy map[Fig.10(a)]is slightly better than the other two[Fig.10(b),(c)]as the five flow patterns being clearly distinguished is concerned.This result is caused by the combination of advantages of main vibration frequency and CEI entropy,which involve micro and macro matters.The classification criterion for five flow patterns,which was summarized from Fig.10(a),is provided in Table 1.A set of experiment data was used to test the accuracy of this classification criterion,and the test results were in Table 2.It was found that the identification of bubble-slug flow and churn flow is more accurate than for the other three flow patterns.The total identification accuracy is as high as 94%.
In order to compare the present algorithm with some other similar identification algorithms,50 samples(10 samples foreachflow pattern)were used as the test samples.The comparison results are represented in Table 3.All the algorithms provided in Table 3 apply the frequency domain decomposition for flow pattern identification.The SSI[15],AOK TFR[12]and EMD-RP[25]algorithms were proposed based on the two-phase flow of regular size pipe.Hence,their identification accuracy is slightly worse than the other three algorithms,which proposed for small channels.
5.Conclusions
This paper proposed an analysis of a modified matrix pencil method(IMP)based on a stability diagram.The CEI index was employed to distinguish false modes in this method.By applying this method to analyze differential pressure signals of the nitrogen–water two-phase flow in the small channel,it is found that the CEI distribution shows the inherent dynamic characteristics of different flow patterns.

Fig.10.The distribution of different points in the map of two of the CEI entropy,the main vibration frequency and damping ratio.
The vibration mode frequency and damping ratio and the CEI entropy are used to distinguish five typical flow patterns.The vibration mode frequency shows the pseudo-cyclic nature of gas–liquid two-phase flow,the damping ratio represents the mutual collision and energy dissipation rate,and the CEI entropy typifies the chaotic characteristics of the two-phase flow.From the pattern identification results,it is determined that the CEI entropy-vibration mode main frequency map is advantageous in quantitatively characterizing underlying differences in the two-phase flow patterns.A tentative criterion for flow pattern identification in narrow channel is proposed in terms of the CEI entropy and the main frequency of the two-phase flow signal.

Table 1 Classification criterion of flow patterns based on CEI entropy and main frequency
The proposed method can be applied on the analysis of other multiphase flow.It provides an innovative way to further develop the complex physical dynamic characteristics of multiphase flow systems.

Table 2 Test results of the classification criterion

Table 3 The comparison with other algorithms
[1]L.Yang,G.L.Ding,D.P.Huang,C.L.Zhang,Review of flow and heat transfer of supercritical carbon dioxide,J.Refrig.2(2003)51–56(in Chinese).
[2]G.W.Chen,Q.Yuan,Micro-chemical technology,J.Chem.Ind.Eng.(China)54(4)(2003)427–433(in Chinese).
[3]N.D.Jin,X.B.Nie,Y.Y.Ren,X.B.Liu,Characterization of oil water two phase flow patterns based on nonlinear time series analysis,Flow Meas.Instrum.14(4–5)(2003)169–175.
[4]N.D.Jin,X.B.Nie,J.Wang,Y.Y.Ren,Flow pattern identification of oil–water two phase flow based on kinematic wave theory,Flow Meas.Instrum.14(4–5)(2003)177–182.
[5]T.T.Zhou,N.D.Jin,Z.K.Gao,Y.B.Luo,Limited penetrable visibility graph for establishing complex network from time series,Acta Phys.Sin.61(3)(2012)030506(in Chinese).
[6]J.Y.Zhao,N.D.Jin,Dynamic characteristics of multivariate graph centrobaric trajectory phase space of two-phase flow,Acta Phys.Sin.61(9)(2012)094701(in Chinese).
[7]Z.K.Gao,N.D.Jin,Flow pattern identification and nonlinear dynamics of gas–liquid two-phase flow in complex networks,Phys.Rev.E 79(2009)066303.
[8]B.Sun,E.P.Wang,Y.Ding,H.Z.Bai,Y.M.Huang,Time–frequency signal processing for gas–liquid two phase flow through a horizontal venturi based on adaptive optimal-kernel theory,Chin.J.Chem.Eng.19(2)(2011)243–252.
[9]M.Du,N.D.Jin,Z.K.Gao,Z.Y.Wang,L.S.Zhai,Flow pattern and water holdup measurements of vertical upward oil–water two-phase flow in small diameter pipes,Int.J.Multiphase Flow 41(2012)91–105.
[10]G.Manfredo,Flow pattern identification in gas–liquid flows by means of phase density imaging,Int.J.Multiphase Flow 51(2013)1–10.
[11]J.R.van Ommen,S.Sasic,J.van der Schaaf,Time-series analysis of pressure fluctuations in gas–solid fluidized beds— A review,Int.J.Multiphase Flow 37(5)(2011)403–428.
[12]H.W.Li,Y.L.Zhou,Y.D.Hou,B.Sun,Flow pattern map and time–frequency spectrum characteristics of nitrogen-water two-phase flow in small vertical upward noncircular channels,Exp.Thermal Fluid Sci.54(2014)47–60.
[13]B.Sun,H.J.Zhang,Research on extractand filter of dynamic signal of two-phase flow based on HHT,Chin.J.Sensors Acurators 20(4)(2007)862–865(in Chinese).
[14]H.Ding,Z.Y.Huang,H.Q.Li,Property of differential pressure fluctuation signal of gas–liquid two-phase flow based on Hilbert–Huang transform,J.Chem.Ind.Eng.(China)56(12)(2005)2294–2302(in Chinese).
[15]H.W.Li,Y.L.Zhou,X.Liu,B.Sun,Stochastic subspace parameter identification and stability diagram of gas–liquid two-phase flow patterns,Acta Phys.Sin.61(3)(2012)1–9(030508 in Chinese).
[16]J.J.Sanchez-Gasca,J.H.Chow,Performance comparison of three identification methods for the analysis of electromechanical oscillations,IEEE Trans.Power Syst.14(3)(1999)995–1002.
[17]Y.Hua,Parameter estimation of exponentially damped sinusoids using higher order statistics and matrix pencil,IEEE Trans.Signal Process.39(7)(1991)1691–1692.
[18]B.Tan,Y.Hou,H.Zheng,C.M.Pei,An improved matrix pencil algorithm for modal parameter identification,J.Northwest.Polytech.Univ.32(3)(2014)486–490(in Chinese).
[19]J.Chang,Q.W.Zhang,L.M.Sun,Application of stabilization diagram for modal parameter identification using stochastic subspace method,Eng.Mech.24(2)(2007)39–44(in Chinese).
[20]K.Li,X.Y.Li,R.Zhao,Detection of subsynchronous oscillation in HVDC transmission system based on improved matrix pencil method,Power Syst.Technol.36(4)(2012)128–132(in Chinese).
[21]N.D.Jin,G.B.Zheng,W.P.Chen,Chaotic recurrence characteristics analysis of conductance fluctuating signal of gas/liquid two-phase flow,J.Chem.Ind.Eng.(China)58(5)(2007)1172–1179(in Chinese).
[22]S.Y.Qu,N.S.Qu,Determining for dynamic instability domain of spatial frame structures,Chin.J.Appl.Mech.16(2)(1999)108–112(in Chinese).
[23]Y.Zhang,Z.Zhang,X.Xu,H.Hua,Modal parameter identification using response data only,J.Sound Vib.282(1–2)(2005)367–380.
[24]R.O.Duda,P.E.Hart,Pattern classification and scene analysis,John Wiley&Sons,New York,1973.
[25]H.W.Li,Y.L.Zhou,B.Sun,Multi-scale chaotic analysis of the characteristics of gas–liquid two-phase flow patterns,Chin.J.Chem.Eng.18(5)(2010)880–888.
[26]H.W.Li,J.P.Liu,T.Li,Y.L.Zhou,B.Sun,Analysis of dynamic of two-phase flow in small channel based on phase space reconstruction combined with data reduction sub-frequency band wavelet,Chin.J.Chem.Eng.23(2015)1017–1026.
 Chinese Journal of Chemical Engineering2016年6期
- Chinese Journal of Chemical Engineering的其它文章
- Mixture temperature prediction of waxy oil–water two-phase system flowing near wax appearance temperature☆
- Preparation and characterization of sulfated TiO2 with rhodium modification used in esterification reaction and decomposition of methyl orange☆
- Online process monitoring for complex systems with dynamic weighted principal component analysis☆
- A stepwise optimal design of water network☆
- Integration of coal pyrolysis process with iron ore reduction:Reduction behaviors of iron ore with benzene-containing coal pyrolysis gas as a reducing agent☆
- Multiple linear equation of pore structure and coal–oxygen diffusion on low temperature oxidation process of lignite☆
