CFD simulation of bubbly turbulent Tayor–Couette flow☆
Xi Gao*,Bo Kong,R.Dennis Vigil
Department of Chemical&Biological Engineering,2114 Sweeney Hall,Iowa State University,Ames,IA 50010,United States
1.Introduction
Fluid flow between two concentric cylinders,with one or both cylinders rotating on a common axis,produces a rich variety of flow patterns including but not limited to laminar,wavy,turbulent,and helical Taylor vortices[1].As a canonical system for investigating the fluid mechanics of shear flow,single phase Taylor–Couette flow has been intensively and systematically studied over many decades.However,due to the more intrinsical complexity of flow phenomena in multiphase systems,there are comparatively fewer experimental and theoretical studies related to multiphase Taylor–Couette flow[2–13],and in particular many important aspects of bubbly Taylor–Couette flow are still poorly understood[14–19].Many current and potential applications of Taylor–Couette devices involve bubbly flows,such as for liquid–liquid extraction[20]and cultivation of algae[21,22],and it is therefore necessary to develop a quantitative understanding of hydrodynamics of multiphase Taylor–Couette flow for the rational design and scale-up of these devices.
Semi-batch bubbly gas–liquid Taylor–Couette flow(feed of gas,no liquid feed)in a vertically oriented concentric annulus with a rotating inner cylinder and fixed outer cylinder has recently attracted considerable attention,primarily due to the discovery that the presence of even a very low volume fraction of gas can produce dramatic drag reduction on the inner cylinder compared with single phase flow.The underlying mechanism,which is related to nontrivial bubble migration and distribution in the annular gap,has been the subject of several experimental and computational studies[13–19,23–30].
For example,Murai et al.[23]measured the torque on the rotating inner cylinder using a fluid flow test section with inner and outer cylinders having a radius ratio η=ri/ro=5/6 and for azimuthal Reynolds numbers Reθ=ωiri(ro-ri)/ν in the interval 600<Reθ<4500.For single phase Taylor–Couette flow in this experiment,this range includes wavy vortex,modulated wavy vortex,and turbulent Taylor vortex regimes.Their measurements of radial bubble distribution using photographic methods show that it is the spatial distribution of bubbles,which in turn depends strongly on Reθ,that is primarily responsible for drag reduction at low azimuthal Reynolds numbers.In contrast,using a Taylor–Couette device with a cylinder radius ratio η=ri/ro=0.716 van Gils et al.[24]observed for the highly turbulent Taylor–Couette flow(5.1×10⁵≤Reθ≤1×10⁶)two drag reduction regimes,even though bubbles accumulated on the inner cylinder wall for all azimuthal Reynolds numbers studied.For Reθ=5.1×10⁵moderate drag reduction was observed(7%)whereas at Reθ=1×10⁶the drag reduction was approximately 40%.Using local velocity and phase distribution measurements,they argue that bubble deformation is the primary mechanism responsible for the strong drag reduction regime.
In parallel with the growing interest in bubble-induced drag reduction,several computational studies of gas–liquid Taylor–Couette flow have been reported for moderate azimuthal Reynolds numbers.For example,Climent et al.[18],neglecting the effects of bubbles on the continuous liquid phase,performed direct numerical simulation(DNS)simulations with Lagrangian bubble tracking for azimuthal Reynolds numbers sufficiently high to produce wavy vortex flow in a system with a radius ratio η=8/9.The equations of motion for the bubbles accounted for drag,buoyancy,lift,and added mass forces.By defining two dimensionless parameters characterizing the relative importance of buoyancy,centripetal attraction towards the inner cylinder wall,and entrapment of bubbles in vortex cores,they were able to explain successfully observations of bubble migration and radial distribution in corresponding experiments.Similarly,Sugiyama et al.[27]investigated the effects of rising bubbles on wavy Taylor vortex flow using DNS with Lagrangian tracking of individual bubbles for a radius ratio η=5/6(the same ratio used by Murai et al.[23]).In contrast to Climent et al.[18],these investigators modeled two-way interactions between bubbles and the continuous phase.Although their simulations did not correctly reproduce the experimental radial bubble distribution profiles obtained by Murai et al.[23],they did show that in the wavy vortex flow regime the drag reduction at the rotating inner cylinder surface is extremely sensitive to the lift force.Specifically,when suppressing the lift force,almost no drag reduction was observed.
The only two-phase bubbly flow simulations known to the authors for azimuthal Reynolds numbers corresponding to the highly turbulent Taylor vortex regime were performed by Shiomi et al.[13].They carried out quasi two-dimensional two- fluid simulations using the PHOENICS code and the k–ε turbulence model,and they compared predicted bubble distributions with corresponding experimental measurements.Their calculations,which were performed for η=0.9 and for Reθup to 80000,were qualitatively similar to experimental data for the same conditions but did not provide good quantitative agreement.
In view of the scarcity of reports concerning CFD simulation of bubbly gas–liquid turbulent Taylor–Couette flow,the main objective of the present work is to develop a two- fluid model based on the most recently available closure relations in gas–liquid simulation.Second,we compare the simulation predictions with the experimental data of van Gils et al.[24]to validate the CFD model.Lastly,the impact of various closure relations on the hydrodynamics and the mechanism of bubble motion and distribution is analyzed and discussed.
2.Model Formulation
2.1.Governing equations for Taylor–Couette flow
In this work,the annular gas–liquid flow is assumed to be axisymmetric so that the system is considered quasi-two-dimensional and all 3 velocity components are predicted.The axisymmetric assumption would be valid if the inlet and outlet are axisymmetric.In van Gils experiment[24],eight upright bubble injectors are equally around the perimeter of the bottom plate.Air and water escape through four exits,referred to as over flow channels,which locate on the top plate,close to the inner cylinder.The inlet and outlet are axisymmetric,thus the assumption is valid for gas phase.For the single liquid flow in the experiment,the Taylor–Couette flow is in the regime of ultimate turbulence.The presentation of Taylor vortices will affect the turbulent flow pattern.While whether the Taylor vortices remain is still an open question,Fenstermacher et al.[31]and Levis et al.[32]noted that turbulent Taylor vortices remained at Re up to 5×10⁵.Huisman et al.[33]demonstrated that roll structures remain in the ultimate regime up to at least Re=O(106).While Lathrop et al.[34]found that the Taylor vortices were not present for Re beyond 1.2 × 10⁵.For two-phase Tylor–Couette flow,the flow pattern is seldom known.Whether the liquid phase flow is axisymmetric is still hard to answer.Generally,3D simulation without the assumption of axisymmetry is needed to resolve the complex flow,while~107cells are needed for 3D simulation to model the reactor in van Gils experiment,which is unrealistic to do it at present.Thus,the 2D unsteady RANS(URANS)equations are solved,which required less computational resource than DNS,and can be used in industry application.There are several papers where TC flow(was called annual centrifugal flow in some papers)is solved using RANS,such as for single phase flow[35–39],for liquid–liquid two phase flow[9,40,41],for gas–liquid two phase flow[13].Among them some authors[9,35,40]assumed the flow to be axisymmetric and 2D models were used.
Mean mass and momentum transport equations based on the phase averaged two- fluid Eulerian–Eulerian approach are solved for each phase and coupled through inter-phase transfer terms[28,42].Hence,the equations of continuity and momentum for bubbly Taylor–Couette flow can be written as

where αkand ukare the volume fraction and the velocity of the liquid phase(k=l)and the gas bubble phase(k=g).
2.2.Interphase forces
Formulation of inter-phase forces is crucial for the accurate simulation of bubbly Taylor–Couette flow.The force term Fkin Eq.(2)can be calculated by decomposing it into independent physical terms:

where CLis the lift force coefficient and it was set as 0.02 in the present model[45].
The virtual mass effect is significantwhen the secondary phase density is much smaller than the primary phase,as is the case here,and it is defined as[44]

The wall lubrication force coefficients taken by Chen et al.[47]are C1=-0.01 and C2=0.05,which means that the wall lubrication force only acts within the distance of 5 times the diameter of bubbles in the reactor.
The turbulent dispersion force is also important for the determination of radial distribution of gas holdup at high Reynolds numbers and can be written as[48,49]

The covariance in the above equation is related to the liquid phase turbulent kinetic energy,See Talvy et al.[49]for details of the formula derivation.
2.3.Turbulence modeling
In this work,both the standard k–εand k–ωmodels were employed to simulate the turbulence.Only the liquid phase turbulence is considered for simplification,and the multiphase modification to the turbulence model is not considered as the bubble phase volume fraction is very low in the present system.Similarly,bubble–bubble interactions were neglected.The turbulent kinetic energy and the specific dissipation rate were written as[50]

3.Simulation Conditions and Strategy
3.1.Test cases
The Twente turbulent Taylor–Couette(T3C)facility experiment[24,51,52]was selected as a test case to validate our model for single phase flow.This choice was driven by the existence of plentiful and detailed experimental data for the T3C reactor.A schematic view of the T3C systemis shown in Fig.1 and geometric parameters are reported in Table 1.For bubbly Taylor–Couette flow,van Gils et al.[24]measured the local mean bubble size by a fiber probe and they found that the radial bubble diameter is almost uniform and reported an overall mean bubble diameter of 1.2 mm for Reθ=5.1×10⁵,which is the condition considered in this report.Thus,a mean bubble diameter of 1.2 mm was used in all the simulations presented here.
3.2.Method of solution
The previously described governing equations were solved using the finite volume commercial CFD code,Ansys Fluent 14.5(Ansys Inc.,US)with the help of user defined functions(UDF).The reactor was assumed to be oriented vertically along its main axis,and the flow was assumed to be axisymmetric.Consequently,a non-uniform rectangular grid was employed as shown in Fig.2.A grid sensitivity study was performed(see Appendix)and it was found that a grid size of 50×464 radial and axial nodes was sufficient to produce a grid independent numerical solution.In the near wall region(within 10 mm),the grid was more narrowly spaced in order to more efficiently capture the steep wall gradients.The gas flow inlet was modeled as a narrow channel with a width of 10 mm near the outer wall.The gas outlet was modeled as a narrow channel with a width of 10 mm near the inner wall.These gas inlet and outlet conditions were chosen to be as consistent as possible with the T3C experimental situation.As was mentioned previously,no liquid was fed to the reactor.

Fig.1.Schematic view of the Taylor–Couette flow cell.

Table 1 Geometric parameters of the T3C system
The pressure–velocity coupling was resolved by the SIMPLE algorithm[53].The simulations were performed in a transient mode with a time step of 5×10⁻⁴s.To reduce numerical diffusion,a secondorder scheme was used for the momentum equations and the QUICK discretization scheme was used for volume fraction equations.The convergence criteria were set to 0.001.Generally it took approximately 30–60 s of simulated physical time to reach a quasi-steady state such that almost all statistics didn't change with time.Simulation predictions were computed and time-averaged for50 s afterthe steady-state condition was reached.
3.3.Initial and boundary conditions
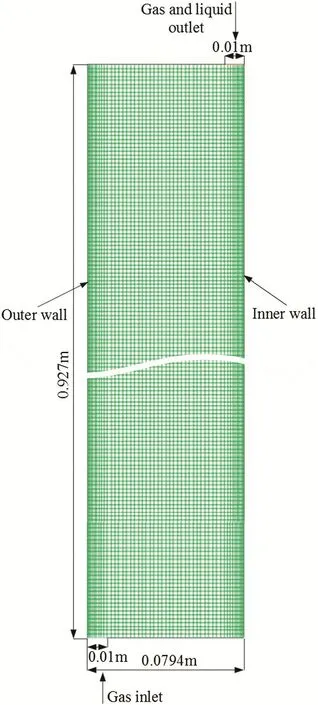
Fig.2.Depiction of the 50×464 computational grid used to simulate the axisymmetric annular flow space showing the fluid inlet and outlet.
Initially,the annulus was filled only with the liquid phase so that αg=0.The inlet boundary conditions were set by prescribing a fixed gas inlet velocity related to the super ficial velocity and by specifying a bubble fraction of 0.05 at the boundary.No liquid was fed to the system.The outlet boundary conditions were set as pressure outlet for both phases.No-slip boundary conditions were used at all walls,and the rotational speed of the inner wall was chosen to match the experimental conditions.A standard wall function,common in single-phase turbulent flows,was used to model the near-wall region.
4.Results and Discussion
4.1.Turbulence model comparison
The time-averaged azimuthal velocity at the middle height(L/2)for the single-phase case is shown in Fig.3 with the mean velocity normalized by the inner wall velocity,which is ui=6.28 m·s-1for Reθ=5.1×10⁵.The solid line represents the experimental data measured using particle image velocimetry[24].It is evident that the standard k–ω turbulence model performs very welland gives better quantitative predictions than the k–ε turbulence model.This result is not unexpected,since the k–ω model has consistently shown its superiority to the k–ε model in complex flows involving strong pressure gradients, flow separation,and strong streamline curvature[54,55].Consequently,the k–ω turbulence model was used in all calculations for the two-phase flow simulations.

Fig.3.Comparison of simulated time-averaged azimuthal velocity for single-phase Taylor–Couette flow with experimental data at the middle height(L/2)[24].
4.2.Drag models comparison
Alternative gas–liquid drag models were considered for use in simulating two-phase Taylor–Couette flow,including those listed in Table 2.In order to select the best model for this purpose,computations were carried out for conditions corresponding to the experiments in[24],and the predicted global gas holdup was compared to the reported experimental results as shown in Fig.4.It is evident that the drag models proposed by Schiller and Neumann[43]and Ma and Ahmadi[58]produce excellent agreement with the experimental values.Hence,the drag model of Schiller and Naumann,Eq.(5)was chosen to perform the simulations discussed in the remainder of this paper.
4.3.Bubble hydrodynamics
The spatial distribution of the gas phase in the annulus is depicted inFig.5,which shows a contour plot of the computed gas phase volume fraction.It is evident that injected gas bubbles quickly concentrate near the inner wall and remain near the inner wall until they approach the outlet.

Table 2 Drag model considered
Fig.6a shows the temporal evolution of the predicted global gas holdup in the reactor after startup(see the simulation with all interphase forces).During the simulation of the first 87 s,the flow was evolved for the single-phase case to produce a steady-state hydrodynamic condition.Subsequently,the gas feed was turned on and the system was evolved until a total of 175 s of real time were simulated.The temporal plot shows that the global gas holdup reaches a steady condition approximately 40 s after the injection of bubbles commences.Thus,the predicted outcomes from 125 to 175 s were used for averaging and reporting of the global gas holdup of(3.0±0.3)%,which is nearly identical to the experimentally reported value of(3.0±0.5)%[24].

Fig.4.Impact of drag force models on the temporal evolution of simulated global gas holdup and comparison with experimental data[24].
These results are in good agreement with experimental findings,as can be seen in Fig.6b,which shows a comparison of the computed and experimental radial gas concentration profiles at an axial position of L/2(see the simulation with all interphase forces in Fig.6b),except very near the inner cylinder wall.In the experiment the radial distance from the inner wall at which the gas concentration is the maximum is approximately 1.2 mm,whereas in the simulation the maximum gas concentration is located on the inner wall.The explanation for this difference is not clear,but it is worth noting that the authors of the experimental study stated that they were not confident with their experimental measurements near the inner wall.Specifically,near the inner wall an up- flow high-pressure region is created by the fiber probe that deflects bubbles from their paths,hence underestimating αg[24].
4.4.Two-phase simulation of liquid hydrodynamics
Fig.7 shows the time-averaged liquid azimuthal velocity at the middle height for the two-phase flow case.It can be seen that the two-phase modelgives reasonably good agreementwith the experimental data for gas–liquid semibatch Taylor–Couette flow obtained by van Gils et al.[24]using laser Doppler anemometry.However,it is evident that the discrepancy between the computed and measured azimuthal velocity is slightly greater in the two-phase case than in the single-phase case.At least two potential causes could explain the under-prediction of the azimuthal velocity.First,the assumption of axisymmetry neglects azimuthal gradients at the inner cylinder wall that may contribute to a higher liquid angular velocity(for example non-uniform bubble distribution).In the future,this hypothesis could be tested by carrying out much more computationally expensive three-dimensional simulations(~107computational cells are needed).Second,while the global gas holdup is low(3%),the bubble volume fraction is much greater near the inner cylinder wall.Currently,there exist no accurate and experimentally validated two-phase turbulence models for such gas volume fractions undergoing strong wall-driven shear flow,and this likely leads to an under-restimation of the wall shear stress.

Fig.6.Impact of non-drag forces on the temporal evolution of simulated global gas holdup(a)and radial gas distribution(b).
Fig.8 shows the standard deviation of the normalized azimuthal velocity fluctuation for both single-and two-phase cases.Although the magnitude of the azimuthal velocity component is dominant in turbulent Taylor–Couette flow(almost10 times the axialand radialvelocities as can be seen in Fig.9,Burin et al.[59]found that the velocity fluctuations for single-phase turbulent Taylor–Couette flow are of the same order of magnitude for all three velocity components.This observation is useful because the k–ω model is an isotropic turbulence model and therefore the assumption thatis justified.The simulations predict an increase in u'θas compared with that of the single-phase case at normalized radial positions(r-ri)/(ro-ri)<0.3,which is also observed in the experimental data.

Fig.5.Computed bubble phase volume fraction contour plot in the annulus.The inner cylinder wall is shown on the bottom.The gas entrance is on the left side of the plot adjacent to the outer cylinder wall and the gas exits on the right side of the plot near the inner cylinder wall.
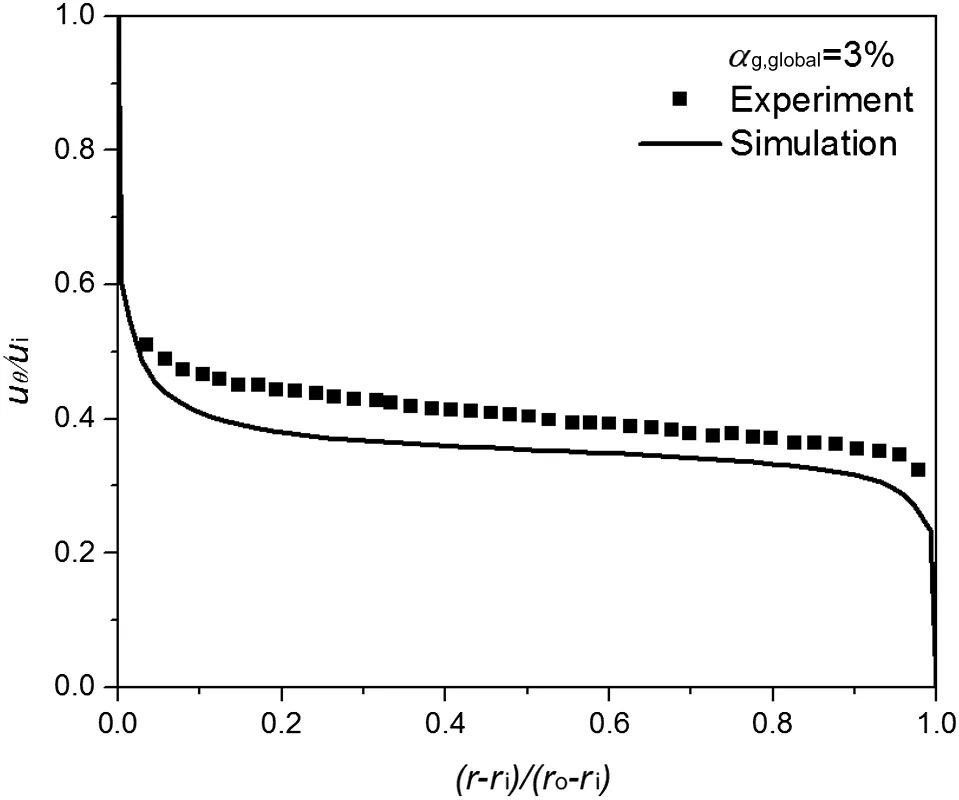
Fig.7.Time-averaged normalized azimuthal liquid velocity for semibatch gas–liquid Taylor vortex flow.
4.5.Mechanism for non-uniform radial gas distribution
As was discussed above,the bubble phase gathers near the inner cylinder wall,leading to a radially non-uniform phase distribution.This phase distribution can be understood as a competition between the centrifugal force,which causes bubbles to migrate to the inner wall,and turbulent velocity fluctuations that transport these bubbles away from the inner wall.This hypothesis is different than the explanation given by Climent et al.[18]for the bubble distributions observed in Taylor vortex flow and wavy Taylor vortex flow at much lower azimuthal Reynolds numbers.Specifically,at the high value of Reθ=5.1×10⁵simulated here,the Taylor vortices have lost coherence,and therefore no bubbles can accumulate in Taylor vortex cores due to centrifugal buoyancy generated by the radial–azimuthal motion of Taylor vortices.

Fig.8.Standard deviation of the normalized azimuthal velocity fluctuation for the liquid phase.

Fig.9.Axial,radial and azimuthal velocity components for semibatch gas–liquid Taylor vortex flow.
In order to determine the relative contributions of various forces acting on the bubble phase that lead to the observed non-uniform radial distribution,the interphase forces acting on the bubbles were also considered individually.In regions of fully developed flow in the annulus,the corresponding magnitudes of the azimuthal and radial velocities for the two phases are almost the same,as can be seen in Fig.9.At steady-state conditions,the radial component of the bubble phase momentum balance can be simplified as:

The radial distributions for each of these forces individually are depicted in Fig.10.The radial component of the virtual mass force is equal to zero and not shown.It is evident from these plots that the radial non-uniformity is mainly determined by competition between the pressure gradient force and the turbulence dispersion force,both of which are several orders of magnitude greater than the other interphase forces.
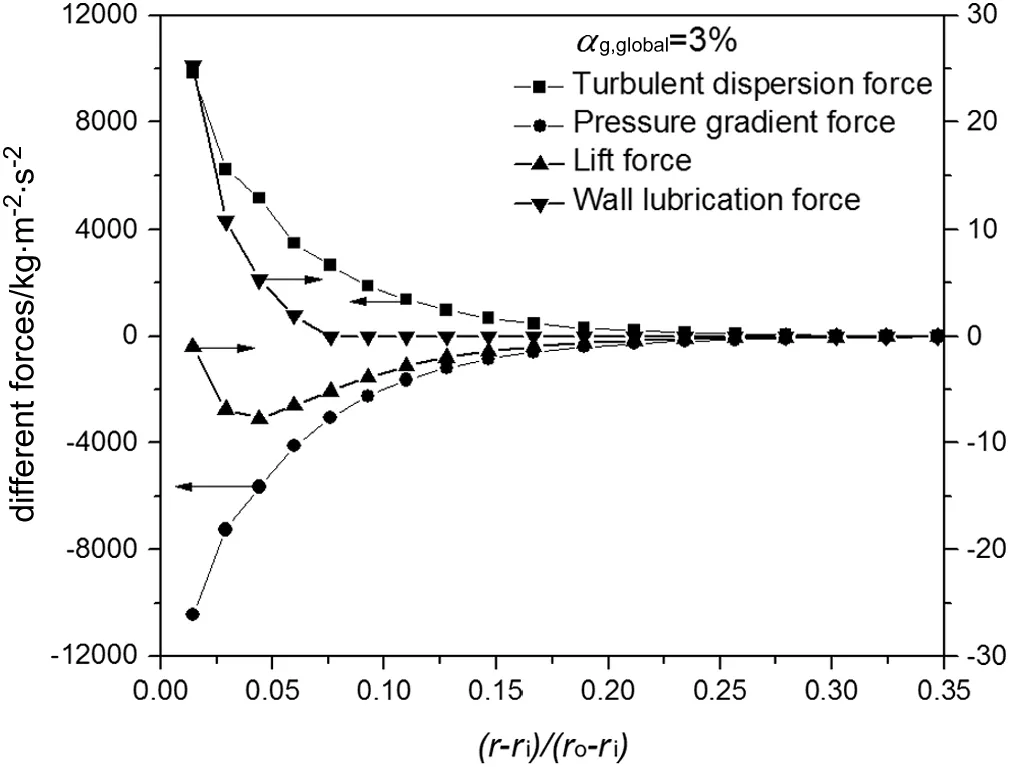
Fig.10.Radial profiles of interphase forces acting on the bubble phase at the middle height(L/2).Arrows indicate the relevant ordinate for each curve.
4.6.Impact of non-drag forces
The relative importance of various non-drag closures was also studied by considering usage of several specific combinations of forces in the simulations.In particular,four cases were considered including D–T,D–T–VM,D–T–VM–L and D–T–VM–L–W,where D=drag,T=turbulent dispersion,VM=virtual mass,L=lift,and W=wall lubrication.The temporal evolution of the global gas holdup and the radial gas distribution were used to assess the impact of various combinations of forces,as shown in Fig.6.Note that the turbulent dispersion force is included in all cases as it was previously found to be essential for the simulation of radial gas distribution,as was discussed in Section 4.5.From Fig.6a,it is evident that a slightly lower global gas holdup is obtained in the absence of the virtual mass force,whereas the wall lubrication force and lift forces have little impact on global gas holdup.Fig.6a demonstrates that the virtual mass,lift force and lubrication wall force have little impact on radial gas distribution,which is also in agreement with the analysis in Section 4.5.
5.Conclusions
From the above discussion,several conclusions can be drawn.
First,the k–ω turbulence model is more suitable for simulating highly turbulent Taylor–Couette flow than the k–ε turbulence model.This is because the k–ω model demonstrates superior performance for wall-bounded flows exhibiting large pressure gradients,strong streamline curvature,and flow separation[54,55].The drag models developed by Schiller and Neumann[43]and Ma and Ahmadi[58]are more suitable for simulating highly turbulent Taylor–Couette flow.
Second,the CFD model was validated by a comprehensive comparison between simulated results and experimental data,including the azimuthal velocity,azimuthal velocity fluctuation,gas global holdup and gas radial distribution.In this work,the model was validated at a high azimuthal Reynolds number for which the flow is known to be turbulent and Taylor vortices lose coherence.The application of this model to lower azimuthal Reynolds number regimes,such as those corresponding to wavy vortex flow and weakly turbulent vortex flow,will be tested in future work.
Third,by comparing the contributions of the radial components of various forces acting on the bubble phase,it is revealed that radial non-uniformity in the gas phase volume fraction is mainly determined by the balance between the pressure gradient force and the turbulent dispersion force.In contrast,the virtual mass force,lift force and wall lubrication forces have only a weak influence on the spatial distribution of the gas phase.


Acknowledgments
We acknowledge Dr.Dennis P.M.van Gils for providing us some important information about his experimental conditions.
Appendix.Grid size independency
Grid sensitivity checking for single phase flow was performed for 25×232,50×464,100×928(radial×axial)grids,which equates to grid resolutions of 4 mm,2 mm,and 1 mm,respectively.The predicted liquid azimuthal velocity profile and standard deviation of the normalized azimuthal velocity fluctuation at the middle height of the reactor are shown in Fig.A1(a)and(b),respectively.It can be seen that there is no significant difference between the results using the medium and fine meshes,and both fit the experimental data well.Also,the results of grid sensitivity checking for two-phase cases using the medium and fine meshes are shown in Fig.A2.It can be seen that there is also no significant difference between the results using the medium and fine meshes.Thus,the medium mesh is used in this work.
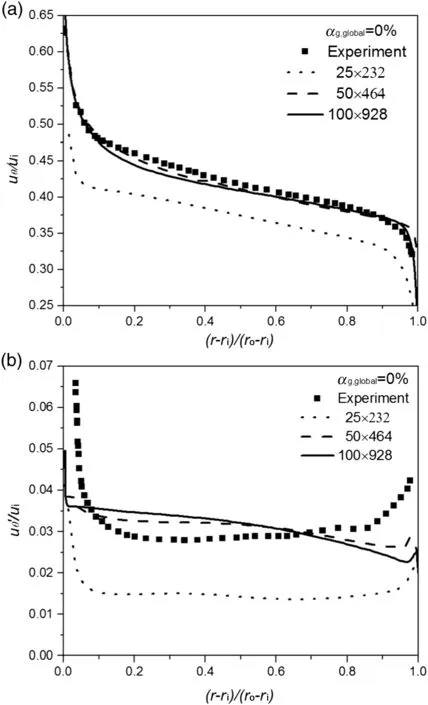
Fig.A1.Simulated liquid azimuthalvelocity and fluctuation due to the effect of grid size for single phase case and comparison with experimental data[24].
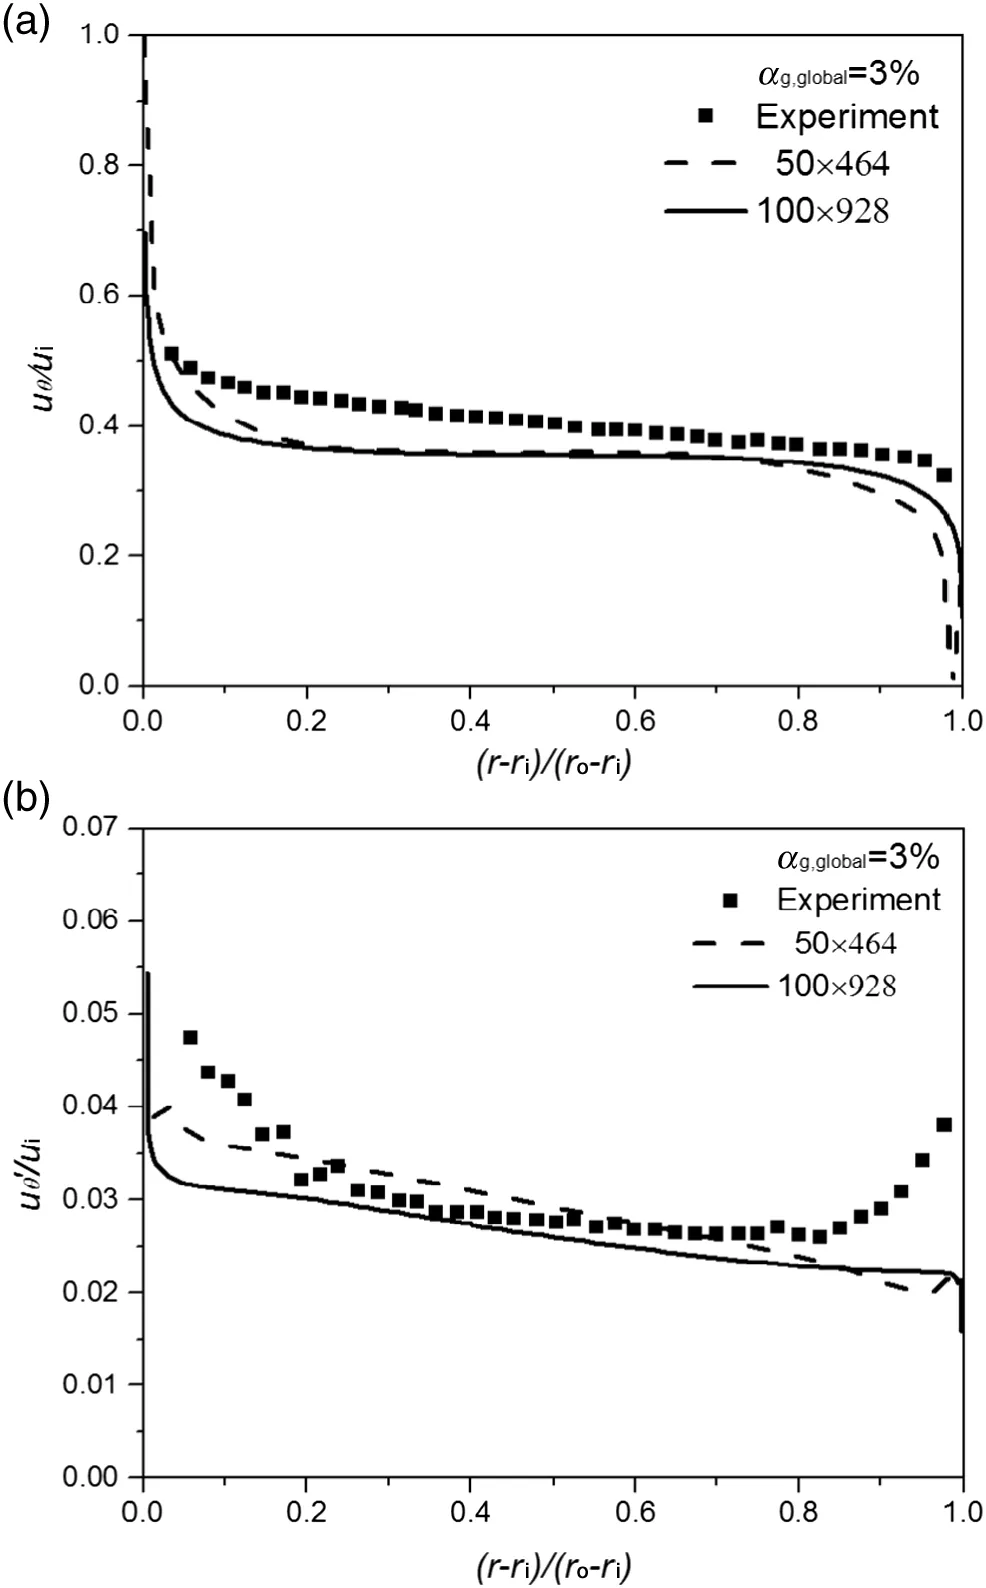
Fig.A2.Simulated liquid azimuthal velocity and fluctuation due to the effect of grid size for two phase case and comparison with experimental data[24].
[1]C.D.Andereck,S.S.Liu,H.L.Swinney,Flow regimes in a circular Couette system with independently rotating cylinders,J.Fluid Mech.164(1986)155–183.
[2]A.Chouippe,E.Climent,D.Legendre,C.Gabillet,Numerical simulation of bubble dispersion in turbulent Taylor-Couette flow,Phys.Fluids 26(2014),043304.
[3]S.Vedantam,J.B.Joshi,Annular centrifugal extractors:A review,Chem.Eng.Res.Des.84(2006)522–542.
[4]S.Vedantam,J.B.Joshi,S.B.Koganti,Three dimensional CFD simulation of strati fied two- fluid Taylor–Couette flow,Can.J.Chem.Eng.84(2006)279–288.
[5]D.D.Joseph,K.Nguyen,G.S.Beavers,Non-uniqueness and stability of the configuration of flow of immiscible fluids with different viscosities,J.Fluid Mech.141(1984)319–345.
[6]Y.Renardy,D.D.Joseph,Couette flow of two fluids between concentric cylinders,J.Fluid Mech.150(1985)381–394.
[7]D.D.Joseph,L.Preziosi,Stability of rigid motions and coating films in bicomponent flows of immiscible liquids,J.Fluid Mech.185(1987)323–329.
[8]D.D.Joseph,P.Singh,K.Chen,Couette flows,rollers,emulsions,tall Taylor cells,phase separation and inversion,and a chaotic bubble in Taylor–Couette flow of two immiscible liquids,Nonlinear evolution of spatio-temporal structures in dissipative continuous systems,NATO ASI series,225 1990,pp.169–189.
[9]X.Y.Zhu,R.D.Vigil,Banded liquid–liquid Taylor–Couette–Poiseuille flow,AICHE J.47(2001)(1932-1940).
[10]X.Y.Zhu,R.J.Campero,R.D.Vigil,Axial mass transport in liquid–liquid Taylor–Couette–Poiseuille flow,Chem.Eng.Sci.55(2000)5078–5087.
[11]R.J.Campero,R.D.Vigil,Spatiotemporal patterns in liquid–liquid Taylor–Couette–Poiseuille flow,Phys.Rev.Lett.79(1997)3897–3900.
[12]R.J.Campero,R.D.Vigil,Flow patterns in liquid–liquid Taylor–Couette–Poiseuille flow,Chem.Res.38(1999)1094–1098.
[13]Y.Shiomi,S.Nakanishi,H.Kutsuna,CFD calculation for two-phase flow in concentric annulus with rotating inner cylinder,PHOENICS users conference proceedings,phoenix2000.
[14]K.Atkhen,J.Fontaine,J.E.Wesfreid,Highly turbulent couette-taylor bubbly flow patterns,J.Fluid Mech.422(2000)55–68.
[15]H.Djéridi,C.Gabillet,J.Y.Billard,Two-phase Couette–Taylor flow:Arrangement of the dispersed phase and effects on the flow structures,Phys.Fluids 16(2004)128–139.
[16]H.Djéridi,J.F.Favé,J.Y.Billard,D.H.Fruman,Bubble capture and migration in Couette–Taylor flow,Exp.Fluids 26(1999)233–239.
[17]A.Mehel,C.Gabillet,H.Djeridi,Bubble effect on the structures of weakly turbulent Couette–Taylor flow,J.Fluids Eng.128(2006)819–831.
[18]E.Climent,M.Simonnet,J.Magnaudet,Preferential accumulation of bubbles in Couette–Taylor flow patterns,Phys.Fluids 19(2007)083301.
[19]Y.Murai,H.Oiwa,Y.Takeda,Frictional drag reduction in bubbly Couette–Taylor flow,Phys.Fluids 20(2008)034101.
[20]G.J.Bernstein,D.E.Grosvenor,J.F.Lenc,N.M.Levitz,A high-capacity annular centrifugal contactor,Nucl.Technol.20(1973)200–202.
[21]B.Kong,J.V.Shanks,R.D.Vigil,Enhanced algal growth rate in a Taylor vortex reactor,Biotechnol.Bioeng.110(2013)2140–2149.
[22]B.Kong,R.D.Vigil,Light-limited continuous culture of Chlorella vulgaris in a Taylor vortex reactor,Environ.Prog.Sustainable Energy 32(2013)884–890.
[23]Y.Murai,H.Oiwa,Y.Takeda,Bubble behavior in a vertical Taylor–Couette flow,J.Phys.Conf.Ser.14(2005)143–156.
[24]D.P.M.van Gils,D.N.Guzman,C.Sun,D.Lohse,The importance of bubble deformability for strong drag reduction in bubbly turbulent Taylor–Couette flow,J.Fluid Mech.722(2013)317–347.
[25]T.H.van den Berg,S.Luther,D.P.Lathrop,D.Lohse,Drag reduction in bubbly Taylor–Couette turbulence,Phys.Rev.Lett.94(2005)044501.
[26]S.L.Ceccio,Friction drag reduction of external flows with bubble and gas injection,Annu.Rev.Fluid Mech.42(2010)183–203.
[27]K.Sugiyama,E.Calzavarini,D.Lohse,Microbubbly drag reduction in Taylor–Couette flow in the wavy vortex regime,J.Fluid Mech.608(2008)21–41.
[28]X.Gao,B.Kong,R.D.Vigil,CFD investigation of bubble effects on Tayor–Couette flow patterns in the weakly turbulent vortex regime,Chem.Eng.J.270(2015)508–518.
[29]M.Ramezani,B.Kong,X.Gao,M.G.Olsen,R.D.Vigil,Experimental measurement of oxygen mass transfer and bubble size distribution in an air-water multiphase Taylor–Couette vortex bioreactor,Chem.Eng.J.279(2015)286–296.
[30]X.Gao,B.Kong,M.Ramezani,M.G.Olsen,R.D.Vigil,An adaptive model for gas–liquid mass transfer in a Taylor vortex reactor,Int.J.Heat Mass Transf.91(2015)433–445.
[31]P.R.Fenstermacher,H.L.Swinney,J.P.Gollub,Dynamical instabilities and the transition to chaotic Taylor vortex flow,J.Fluid Mech.94(1979)103–128.
[32]G.S.Lewis,H.L.Swinney,Velocity structure functions,scaling,and transitions in high-Reynolds-number Couette–Taylor flow,Phys.Rev.E 59(1999)5457–5467.
[33]S.G.Huisman,Roeland C.A.van der Veen,C.Sun,D.Lohse,Multiple states in highly turbulent Taylor–Couette flow,Nat.Commun.5(2014)3820.
[34]D.P.Lathrop,J.Fineberg,H.L.Swinney,Transition to shear-driven turbulence in Couette–Taylor flow,Phys.Rev.A 46(1992)6390–6405.
[35]S.S.Deshmukh,S.Vedantam,J.B.Joshi,S.B.Koganti,Performance evaluation of an electrochemical reactor used to reduce Cr(VI)from aqueous media applying CFD simulations,Ind.Eng.Chem.Res.46(2007)8343–8354.
[36]S.S.Deshmukh,J.B.Joshi,S.B.Koganti,Flow visualization and three-dimensional CFD simulation of the annular region of an annular centrifugal extractor,Ind.Eng.Chem.Res.47(2008)3677–3686.
[37]S.S.Deshmukh,M.J.Sathe,J.B.Joshi,S.B.Koganti,Residence time distribution and flow patterns in the single-phase annular region of annular centrifugal extractor,Ind.Eng.Chem.Res.48(2009)37–46.
[38]T.V.Tamhane,J.B.Joshi,U.K.Mudali,R.Natarajan,R.N.Patil,Axial mixing in annular centrifugal extractors,Chem.Eng.J.2012(207–208)(2012)462–472.
[39]T.V.Tamhane,J.B.Joshi,R.N.Patil,Performance of annular centrifugal extractors:CFD simulation of flow pattern,axial mixing and extraction with chemical reaction,Chem.Eng.Sci.110(2014)134–143.
[40]M.J.Sathe,S.S.Deshmukh,J.B.Joshi,S.B.Koganti,Computational fluid dynamics simulation and experimental investigation:study of two-phase liquid–liquid flow in a vertical Taylor–Couette contactor,Ind.Eng.Chem.Res.49(2010)14–28.
[41]S.Vedantam,J.B.Joshi,S.B.Koganti,CFD simulation of RTD and mixing in the annular region of a Taylor–Couette contactor,Ind.Eng.Chem.Res.45(2006)6360–6367.
[42]X.Gao,L.J.Wang,C.Wu,Y.W.Cheng,X.Li,Novel bubble-emulsion hydrodynamic model for gas–solid bubbling fluidized beds,Ind.Eng.Chem.Res.52(2013)10835–10844.
[43]L.Schiller,Z.Naumann,A drag coefficient correlation,Z.Ver.Deutsch.Ing.77(1935)318–320.
[44]D.A.Drew,R.T.Lahey,Analytical modeling of multiphase flow,in:M.C.Roco(Ed.),Particulate two-phase flow,Butterworth-Heinemann,Boston,MA 1993,pp.509–566.
[45]A.Behzadi,R.I.Issa,H.Rusche,Modelling of dispersed bubble and droplet flow at high phase fractions,Chem.Eng.Sci.674(2004)759–770.
[46]S.P.Antal,R.T.Lahey,J.E.Flaherty,Analysis of phase distribution in fully developed laminar bubbly two-phase flow,Int.J.Multiphase Flow 17(1991)635–652.
[47]P.Chen,M.P.Dudukovic,J.Sanyal,Three-dimensional simulation of bubble column flows with bubble coalescence and breakup,AICHE J.51(2005)696.
[48]Q.S.Huang,C.Yang,G.Z.Yu,Z.-S.Mao,CFD simulation of hydrodynamics and mass transfer in an internal airlift loop reactor using a steady two- fluid model,Chem.Eng.Sci.65(2010)5527–5536.
[49]S.Talvy,A.Cockx,A.Liné,Modeling hydrodynamics of gas–liquid airlift reactor,AICHE J.53(2007)335–353.
[50]D.C.Wilcox,Turbulence modeling for CFD,DCW Industries Inc.,La Canada,California,1998.
[51]D.P.M.van Gils,G.W.Bruggert,D.P.Lathrop,C.Sun,D.Lohse,The Twente turbulent Taylor–Couette(T3C)facility:Strongly turbulent(multi-phase) flow between independently rotating cylinders,Rev.Sci.Instrum.82(2011)025105.
[52]D.P.M.van Gils,Highly turbulent Taylor–Couette flow,University of Twente,Enschede,Netherlands,2011(PhD thesis).
[53]S.V.Patankar,Numerical heat transfer and fluid flow,Hemisphere Publishing Corporation,1980.
[54]F.R.Menter,Zonal two equation k–ω turbulence models for aerodynamic flows,AIAA Paper#93–2906,24th Fluid Dynamics Conference,July,1993.
[55]F.R.Menter,Two-equation eddy-viscosity turbulence models for engineering applications,AIAA J.32(1994)1598–1605.
[56]A.Tomiyama,I.Kataoka,I.Žun,T.Sakaguchi,Drag coefficients of single bubbles under normal and micro gravity conditions,JSME Int.J.42(1998)472–498.
[57]D.Ma,G.J.Ahmadi,A thermodynamical formulation for dispersed turbulent flows-1:basic theory,Int.J.Multiphase Flow 16(1990)323–340.
[58]D.Z.Zhang,W.B.Vanderheyden,The effects of mesoscale structures on the disperse two-phase flows and their closures for dilute suspensions,Int.J.Multiphase Flow 28(2002)805–822.
[59]M.J.Burin,E.Schartman,H.Ji,Local measurements of turbulent angular momentum transport in circular Couette flow,Exp.Fluids 48(2010)763–769.
 Chinese Journal of Chemical Engineering2016年6期
- Chinese Journal of Chemical Engineering的其它文章
- Mixture temperature prediction of waxy oil–water two-phase system flowing near wax appearance temperature☆
- Preparation and characterization of sulfated TiO2 with rhodium modification used in esterification reaction and decomposition of methyl orange☆
- Online process monitoring for complex systems with dynamic weighted principal component analysis☆
- A stepwise optimal design of water network☆
- Integration of coal pyrolysis process with iron ore reduction:Reduction behaviors of iron ore with benzene-containing coal pyrolysis gas as a reducing agent☆
- Multiple linear equation of pore structure and coal–oxygen diffusion on low temperature oxidation process of lignite☆
