用于污染黄曲霉毒素花生分选的荧光信号研究
王叶群,杨增玲,张绍英,刘 婷(中国农业大学工学院,北京100083)
用于污染黄曲霉毒素花生分选的荧光信号研究
王叶群,杨增玲,张绍英※,刘婷
(中国农业大学工学院,北京100083)
摘要:为在加工前将黄曲霉毒素超限的带衣花生米从原料中剔除,参照已有的色选系统,提出一种依据黄曲霉毒素含量超限带衣花生米的专属荧光信号进行逐粒分选的技术构想。采用Cary Eclipse荧光分光光度计测定100粒外观具有代表性的带衣花生米表面的紫外-荧光规律,通过与免疫亲和层析净化荧光光度法(GB/T18979-2003)检测结果对比,判定了黄曲霉毒素超限带衣花生米的荧光光谱特征;通过绘制450/490、460/490荧光强度比值的箱线图,评估了表面荧光法判断黄曲霉毒素超限带衣花生米的准确率;在搭建的荧光成像系统上,对黄曲霉毒素超限带衣花生米进行了荧光成像。检测发现,在365 nm波长激发下,黄曲霉毒素超限带衣花生米在420~460 nm处有荧光峰;以450/490荧光强度比值为依据剔除超限值带衣花生米的判断准确率为81%;a.u.>40的带衣花生米可在图像中呈现亮蓝荧光光斑。表明表面荧光信号可作为带衣花生米在线、无损、逐粒分选的专属光学信号,用于黄曲霉毒素超限带衣花生米的剔除。
关键词:农产品;荧光;带衣花生米;黄曲霉素;分选
王叶群,杨增玲,张绍英,刘婷.用于污染黄曲霉毒素花生分选的荧光信号研究[J].农业工程学报,2016,32(01):187-192.doi:10.11975/j.issn.1002-6819.2016.01.026 http://www.tcsae.org
Wang Yequn, Yang Zengling, Zhang Shaoying, Liu Ting.Fluorescent signal characteristics for sorting of peanut contaminated by aflatoxion[J].Transactions of the Chinese Society of Agricultural Engineering(Transactions of the CSAE), 2016, 32(01): 187-192.(in Chinese with English abstract)doi:10.11975/j.issn.1002-6819.2016.01.026 http://www.tcsae.org
E-mail:cauzsy@cau.edu.cn
0 引言
花生是重要的食用油原料,占中国油料作物总量的50%左右[1]。花生在生长、收获、运输、贮藏过程中极易感染黄曲霉和寄生曲霉[2-3],其次级代谢产物——黄曲霉毒素具有强毒性和高致癌、致畸性,毒性是氰化钾的10倍,被国际癌症研究机构确定为Ⅰ类致癌物[4-5]。世界各国对花生及其制品中的黄曲霉毒素制定了严格的限量标准,中国对花生及其制品中黄曲霉毒素B1的限量为≤20 μg/kg[6-8]。因此,研究污染黄曲霉毒素花生加工前的分选技术,将有效隔绝污染源,以防代治,对确保食品安全意义重大。
带衣花生米是花生加工利用过程中的主要原料形式。加工前对带衣花生米进行在线、无损、逐粒分选,可有效防止黄曲霉毒素进入产品。目前,国内外已有花生中黄曲霉毒素的检测方法,如薄层色谱法、高效液相色谱法、免疫化学方法等,均需破坏花生米的整体性[9-17];而常规色选法仅以标定的外观或表皮特征为依据进行差异比较分选,常造成外观合格但毒素超限个体的漏剔[18];同样,毒素不超限但外观异常的个体则多会被误剔。
此前研究发现,在紫外光照射下,B族黄曲霉毒素发蓝色荧光,G族黄曲霉毒素发黄绿色荧光[19-23]。因此,参照已广泛应用的对颗粒物料进行逐粒色选的技术思路[24-27],提出了一种带衣花生米逐粒分选的技术构想[28-29](见图1):将色选系统中的可见光成像改为荧光成像,通过对以旋转下滑状态逐个、顺序通过背景板前的带衣花生米进行多次或连续紫外——荧光成像,获取污染超限粒的专属光学信号,并据此转换为执行信号,即可将黄曲霉毒素超限的带衣花生米从加工前的原料中剔出。
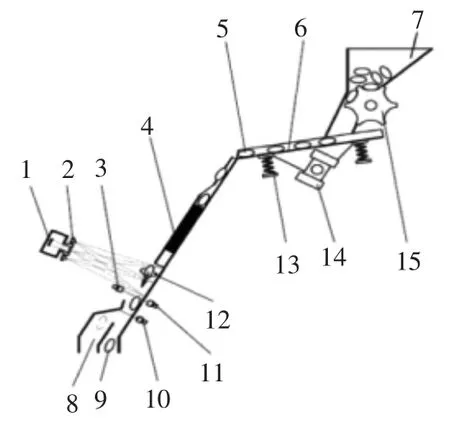
图1 带衣花生米逐粒分选系统方案图Fig.1 Sorting system of single peanut
本文拟通过测定、比较污染黄曲霉毒素带衣花生米表面的紫外——荧光光谱[30],分析其紫外——荧光特性,并通过搭建荧光成像系统,获得污染黄曲霉毒素带衣花生米的紫外——荧光图像,经过适当的转换和分析,获得污染黄曲霉毒素带衣花生米的专属荧光信号,以此作为带衣花生米在线、无损、逐粒分选的判别依据,实现加工前污染黄曲霉毒素带衣花生米的剔除。
1 材料与方法
1.1样品的采集
检测用带衣花生米为花28(产地:山东费县;收获时间:2012年)。依据花28的生物特征(表皮颜色、几何结构),挑选100粒外观具有代表性的带衣花生米作为检测样本。
1.2带衣花生米荧光光谱分析
100粒检测样本的荧光光谱采用Cary Eclipse荧光分光光度计(美国VARIAN公司)测定。以稳定性、重合度及分辨率为依据选定的Cary Eclipse荧光分光光度计检测参数为:激发光波长365 nm,发射波长范围为400~600 nm,狭缝均置为5 nm,扫描速度置为medium,电压设为600 V。对样品表面进行周向6点荧光发射光谱扫描,以6点平均荧光强度绘制荧光发射光谱[31]。
1.3带衣花生米黄曲霉毒素超限检测
依据免疫亲和层析净化荧光光度法(GB/T18979—2003)进行带衣花生米黄曲霉毒素超限检测。在检测过程中为实现黄曲霉毒素提取液免疫亲和柱恒流纯化,自制了恒流定量过柱系统(图2):利用丝杠副将步进电机的旋转运动转换为注射器柱塞的直线运动,通过控制步进电机转速和转角间接控制进样器进样流量及体积。进样流量调整范围:0~333 mL /min。
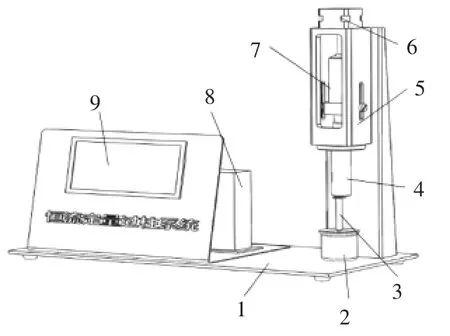
图2 恒流定量过柱系统Fig.2 Liquid flow velocity control system
1.4荧光成像系统搭建及带衣花生米单色荧光成像
以XSY-1落射荧光显微镜(重庆光电仪器有限公司)为平台,搭建了带衣花生米荧光成像系统(图3)。利用扩束镜将激发光斑投射区域扩充至覆盖2~3粒花生米;在DLCW-L 1.3M USB2.0工业相机物镜前配置带通滤光片,获取样品的单色荧光图像。试验选定的带通滤光片为(460±5)nm[26]。
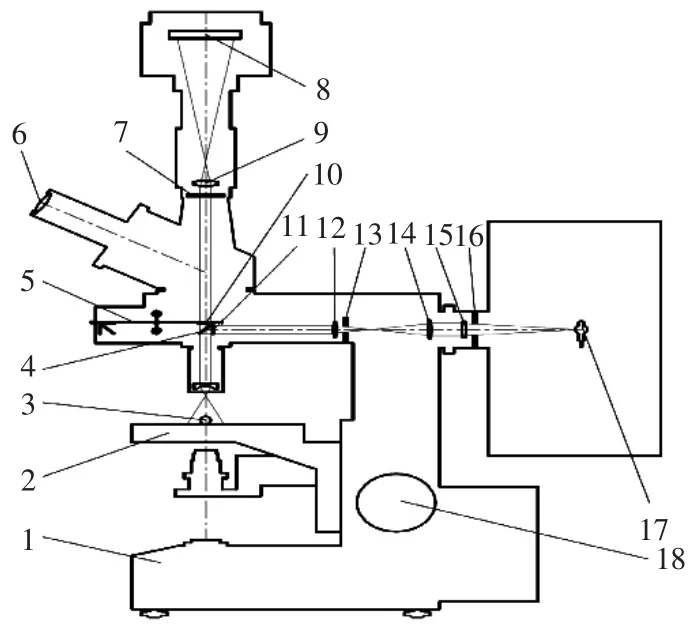
图3 荧光图像采集系统示意图Fig.3 Fluorescence image acquisition system
2 结果与分析
2.1带衣花生米表面荧光信号检测确定
对挑选出的外观具有代表性的100粒带衣花生米(包括霉变粒和正常粒),以中心波长为365 nm的紫外光激发,在400~600 nm范围内扫描得到了其受测样品的荧光光谱(见图4)。100粒带衣花生米荧光光谱见图4。
将100粒受测带衣花生米与图4中各自的荧光光谱比对发现:具有不同外观特征的带衣花生米的荧光光谱差异明显,并且,表皮具有霉变特征的个体,其荧光光谱大多在420~460 nm范围出现明显的荧光峰。依据100粒带衣花生米在450 nm处的荧光强度分布,将其分为8组(见表1),每组样品的黄曲霉毒素采用GB/T18979-2003方法检测,每组3次重复。
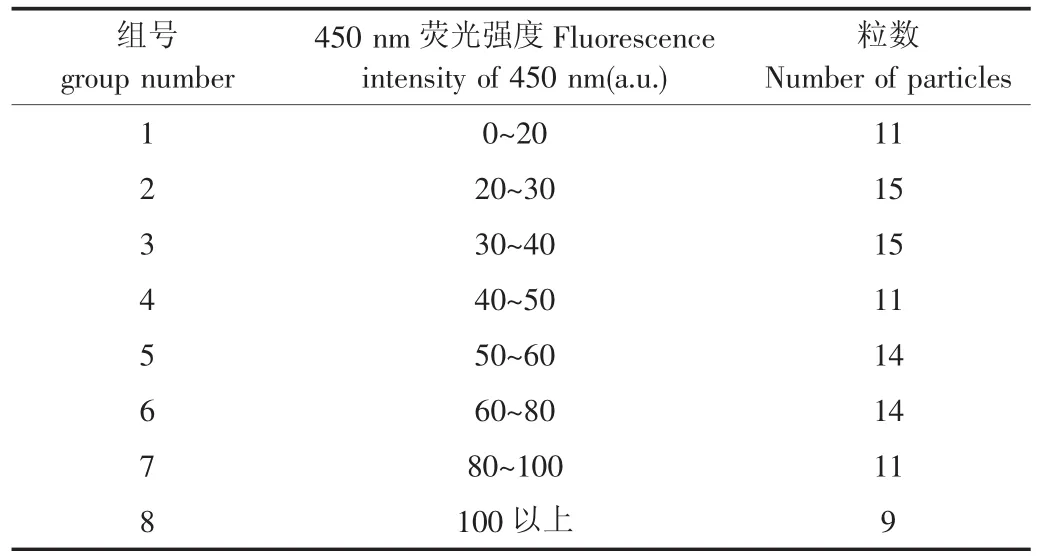
表1 受测样本分组依据及分布表Tab.1 Grouped basis and distribution of test sample
按GB/T18979-2003方法,称取3.4 g硫酸奎宁,用0.05 mol/L硫酸溶液稀释至100 mL,此溶液在450 nm处的荧光强度相当于20.0 μg/kg的黄曲霉毒素标准溶液,其荧光光谱如图5a所示。8组受测样本的黄曲霉毒素免疫亲和柱提取液的荧光光谱(每组重复测3次,取其平均荧光强度绘制荧光光谱)如图5b所示(图中十字标识点为硫酸奎宁校准液450nm处的荧光强度)。通过对比图5a和图5b可以判断8组受测样本中黄曲霉毒素含量大于20.0 μg/ kg的样本组。
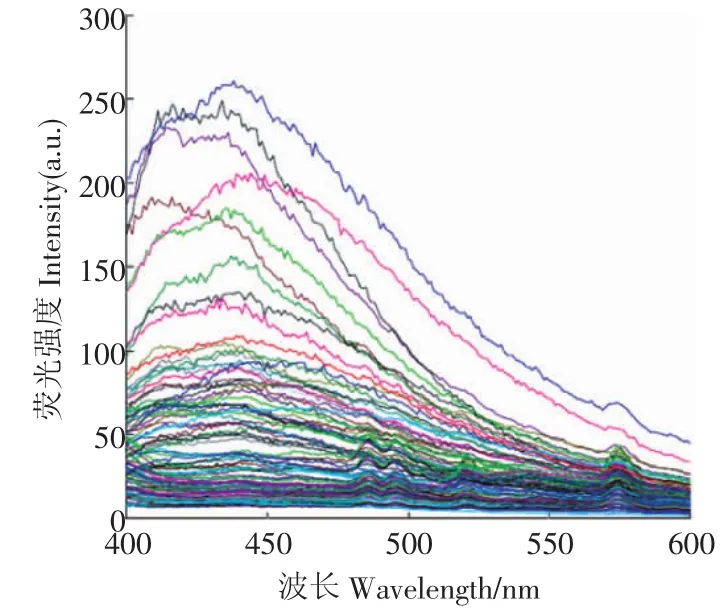
图4 100粒带衣花生米荧光光谱Fig.4 Fluorescence spectra of 100 peanuts
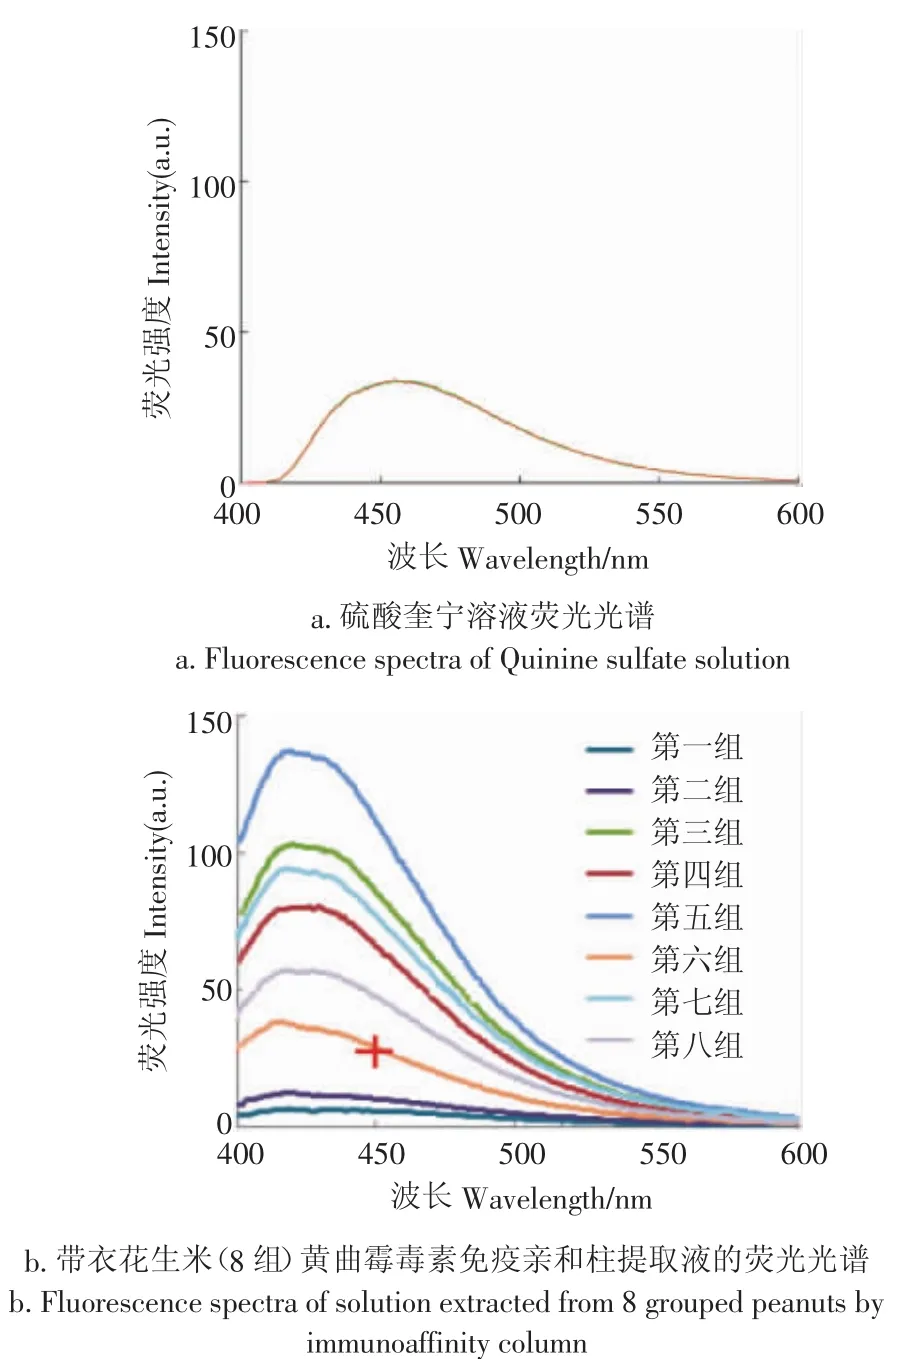
图5 硫酸奎宁溶液及带衣花生米(8组)黄曲霉毒素免疫亲和柱提取液的荧光光谱Fig.5 Fluorescence spectra of quinine sulfate solution andsolution extracted from 8 grouped peanuts by immunoaffinity column
由图4和图5b可知,带衣花生米表面荧光光谱及其黄曲霉毒素免疫亲和柱提取液的荧光光谱谱形相似,均在420~460 nm有明显的荧光峰,表明受测带衣花生米表面产生荧光的物质应为黄曲霉毒素。
通过与硫酸奎宁校准液450 nm处的荧光强度比对可见,除组号1、2外,其余6组样本在450 nm处的荧光强度均超限值,即黄曲霉毒素(B1+B2+G1+G2)的含量均大于20.0 μg/kg。表明:利用荧光分光光度计(激发波长365 nm)检测450 nm处的荧光强度判定带衣花生米中黄曲霉毒素限值,与GB/T18979-2003中采用化学方法进行黄曲霉毒素限值的判断结果存在逻辑关系,即当450 nm处的荧光强度>30a.u.时,带衣花生米的黄曲霉毒素含量超过国标限值。
由此可以确定,黄曲霉毒素污染超限的带衣花生米的特征荧光信号为:在365 nm波长激发光下,发射光谱在420~460 nm处有荧光峰;且发射光谱450 nm的荧光强度>30。
2.2黄曲霉毒素超限带衣花生米表面荧光评判的准确率
由于GB/T18979-2003中的免疫亲和层析净化荧光光度法依据450 nm处的荧光强度判断带衣花生米黄曲霉毒素含量是否超限值,因此,以带衣花生米在450 nm处的荧光强度30为界限将检测样品分为两组,分别得到了其在450/490 nm和460/490 nm处荧光强度比值的箱线图(见图6a和图6b)。
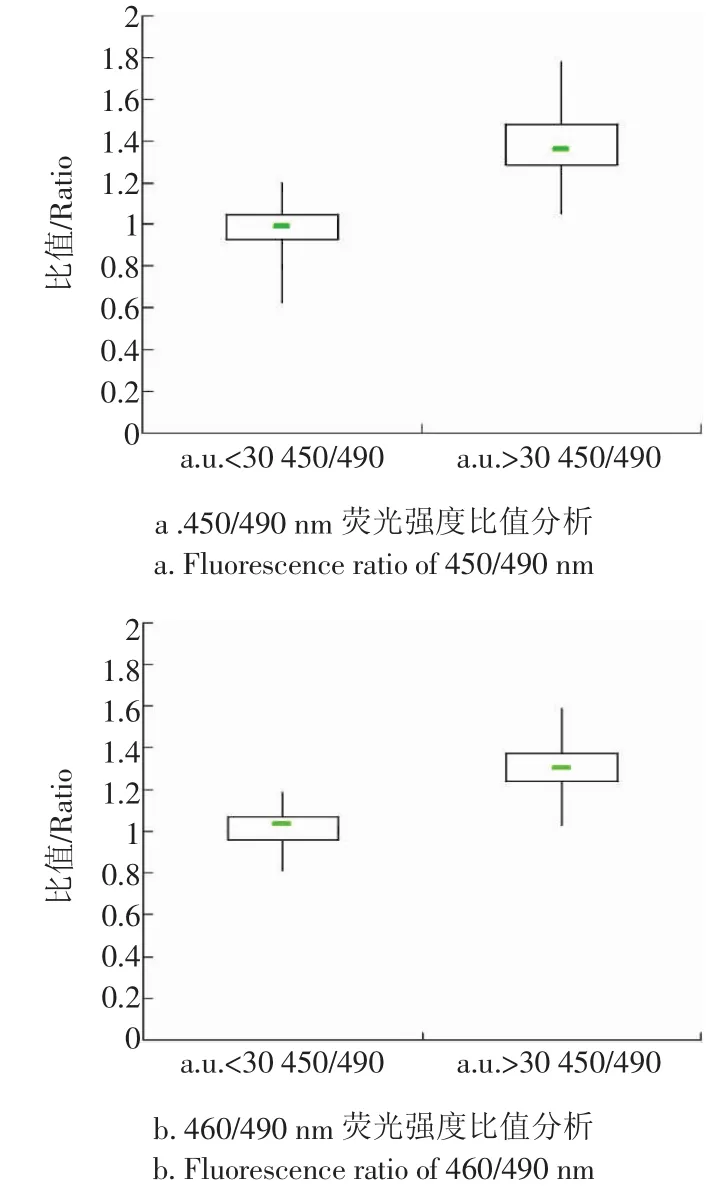
图6 450/490 nm和460/490 nm荧光强度比值分析Fig.6 Fluorescence ratio of 450/490 nm and 460/490 nm
由图6a和图6b可见,450 nm处a.u.>30和a.u.<30的带衣花生米的荧光光谱在450/490 nm和460/490 nm两处荧光强度比值的中位数位置、四分位间距框的位置与高度均不重合,说明两者比值基本不同。根据Whisker上限和Whisker下限计算出的450/490 nm荧光强度比值的重叠率为19%,表明:应用该方法判别黄曲霉毒素超限带衣花生米准确率为81%。
2.3黄曲霉毒素超限带衣花生米单色荧光成像
在荧光图像采集系统上对污染超限粒进行了单色荧光成像。为修正系统的红移,强化荧光信号在单色图像中的表现,单色成像时选用了(460±5)nm的带通滤光片。成像试验发现,受限于荧光图像采集系统的灵敏度,a.u.<30的污染超限粒的单色图像中未见光斑;a.u.>40的污染超限粒的单色图像中则会出现形状不规整的蓝色光斑。
示例选取了光斑具有代表性的9幅污染超限粒的单色荧光图像,并按光斑亮度和面积划分为3组(每组3粒,见图7)。为了考察光斑亮度和面积与荧光光谱的关联,在选定检测参数下检测了与9幅单色荧光图像对应的污染超限粒的荧光光谱(见图8)。通过图7与图8的比对发现:污染超限粒单色荧光图像中的光斑面积和亮度,与其在450 nm处的表面荧光强度正相关。
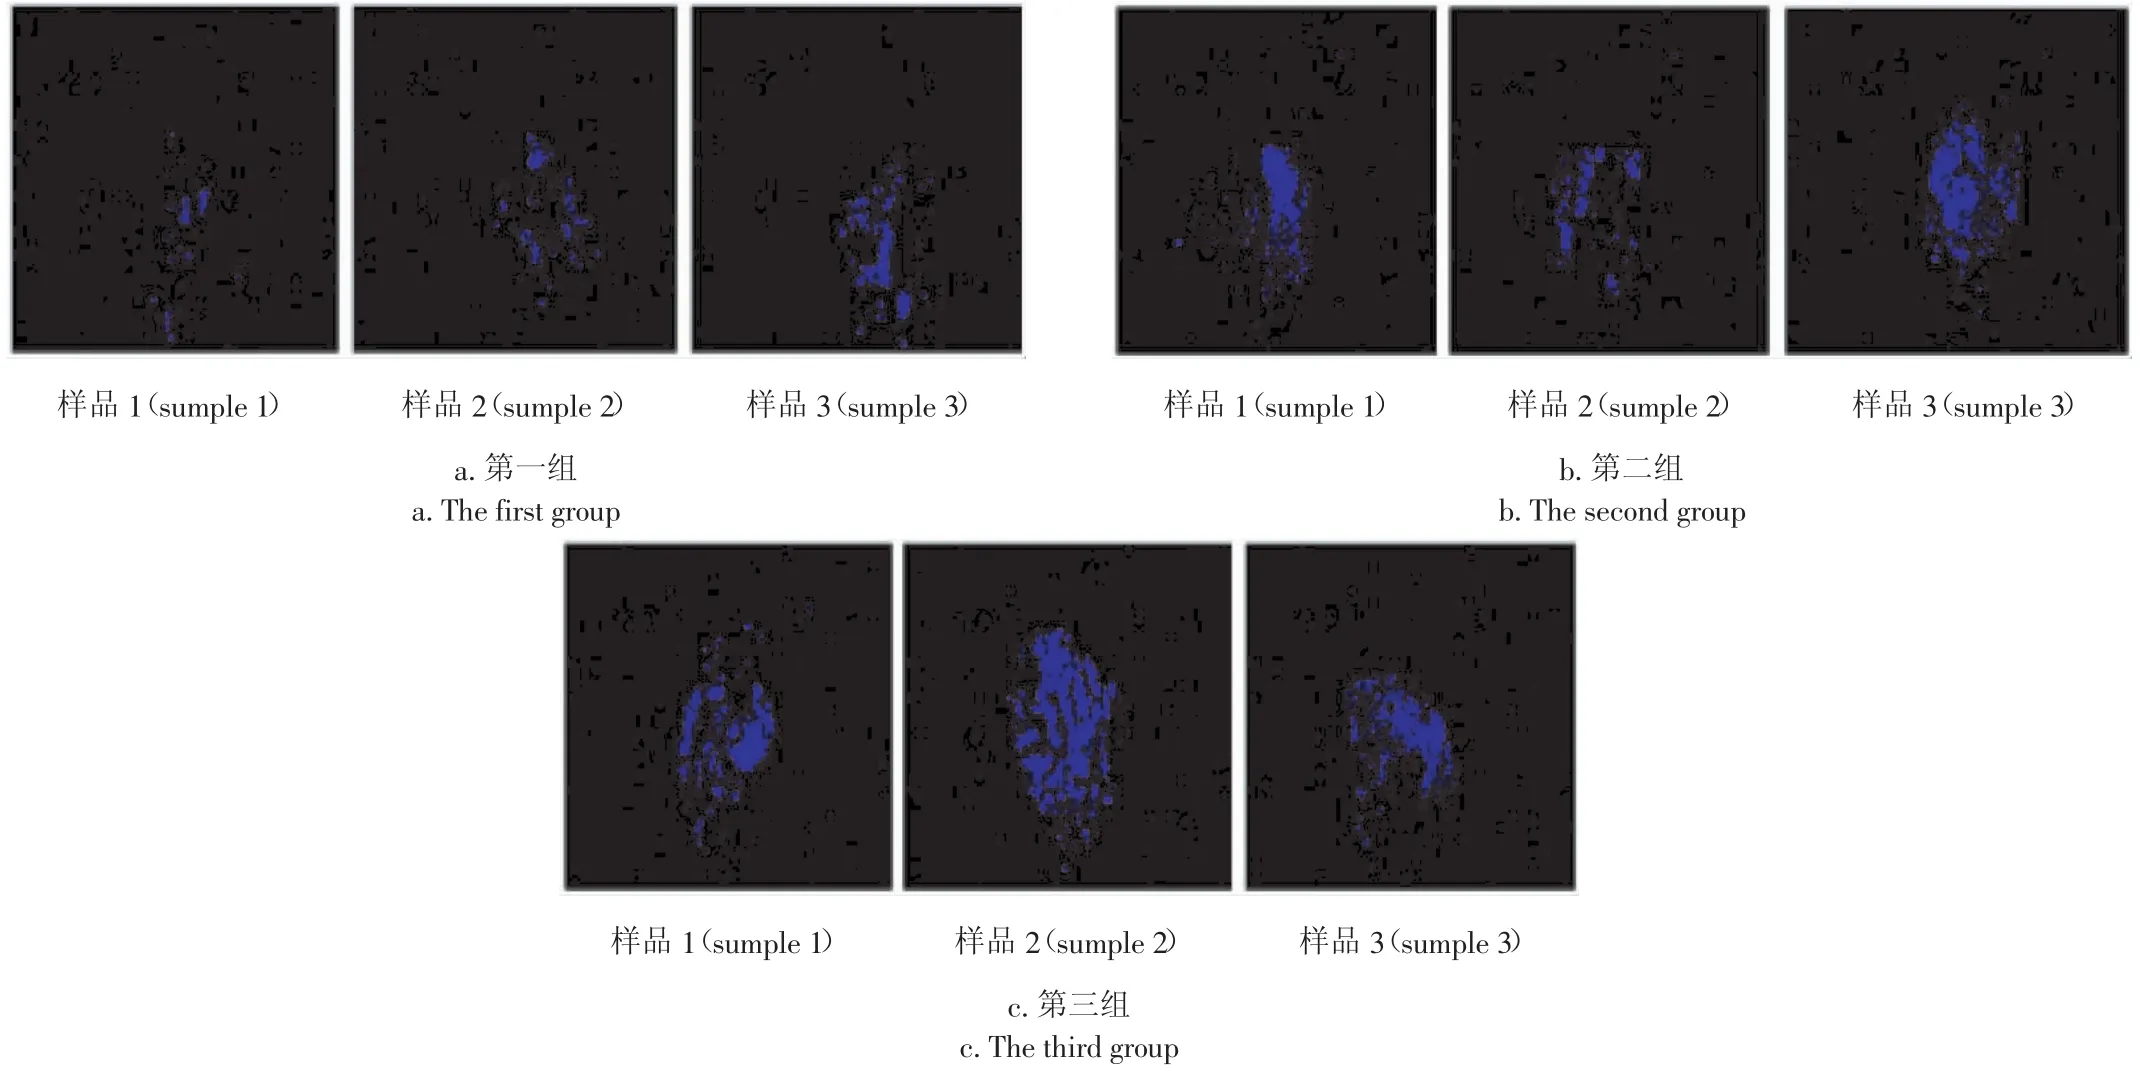
图7 带衣花生米单色(460 nm)荧光图像Fig.7 Fluorescence image of peanuts with 460 nm filter
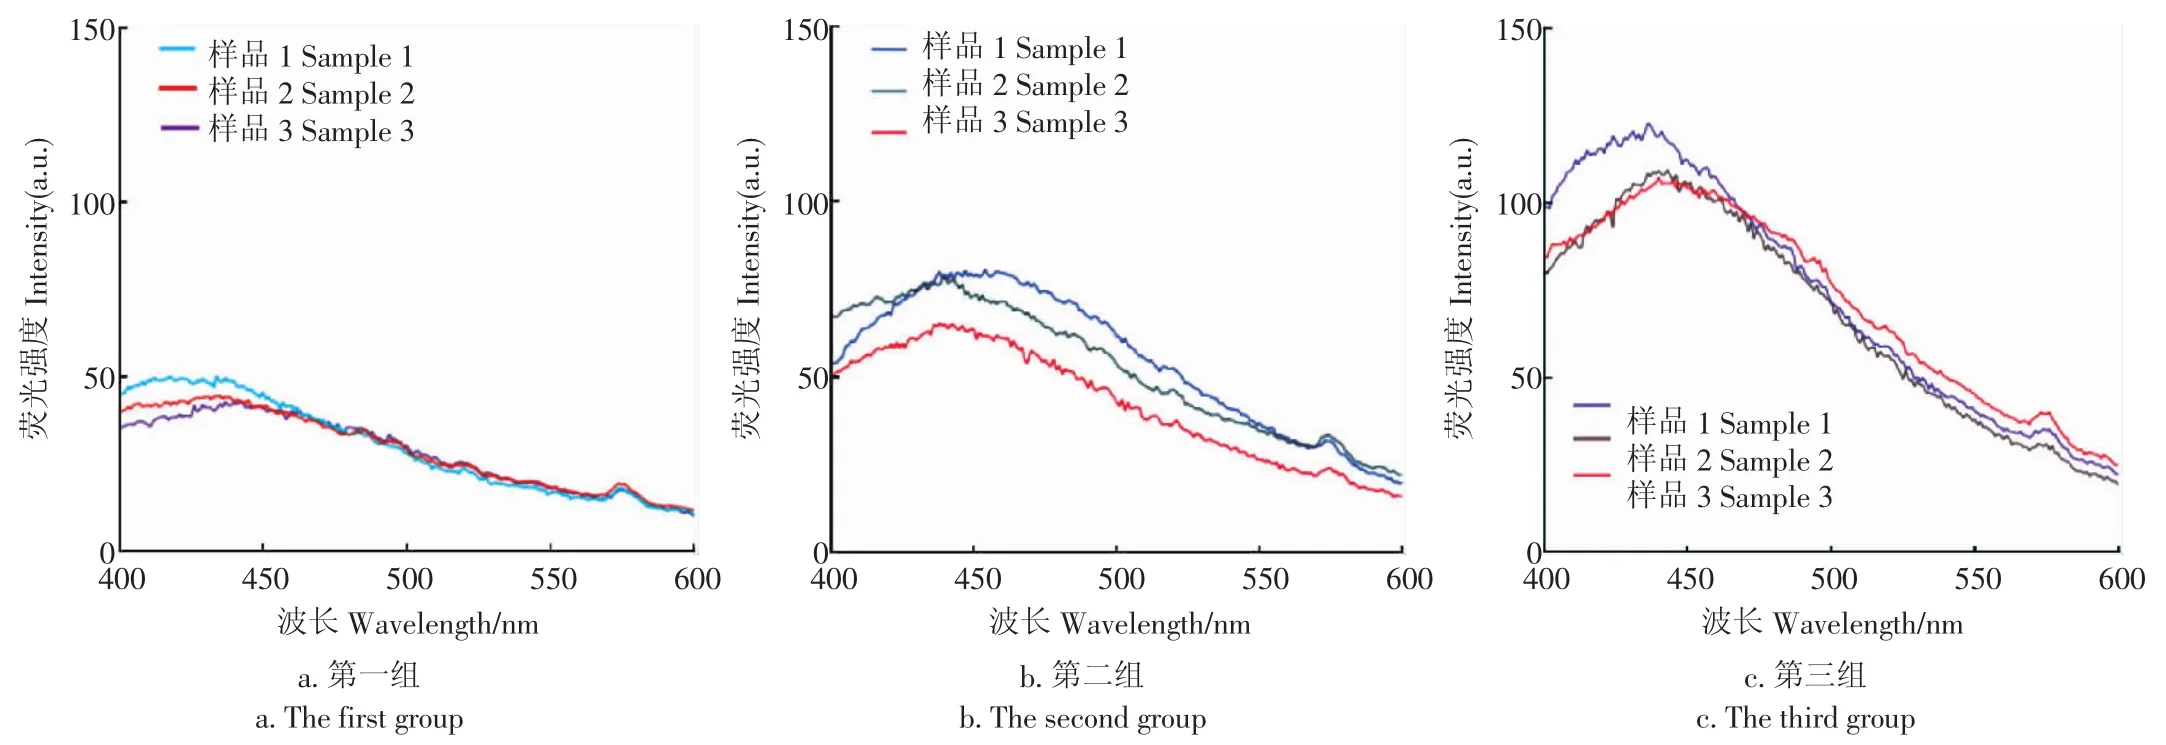
图8 污染粒的荧光光谱Fig.8 Fluorescence spectra ofcontaminated peanuts
3 结论
本文以带衣花生米为研究对象,依据黄曲霉毒素的紫外——荧光特性,判定了黄曲霉毒素超限带衣花生米的荧光光谱特征;评估了表面荧光法判断黄曲霉毒素超限带衣花生的准确率;并对黄曲霉毒素超限带衣花生米进行了荧光成像。研究结果表明:
1)黄曲霉毒素污染超限的带衣花生米的特征荧光信号为:在365 nm波长激发光下,发射光谱在420~460 nm处有荧光峰,且发射光谱450 nm的a.u.>30。
2)依据带衣花生米表面荧光特性可有效区分污染超限粒与正常粒,判断准确率为81%
3)试验条件下,a.u.>40的污染超限粒的单色(460 nm)荧光图像中会出现明显的蓝色光斑。
4)表面荧光信号可作为带衣花生米在线、无损、逐粒分选的专属光学信号,用于黄曲霉毒素污染超限的带衣花生的剔除。
[参考文献]
[1]许婷婷,宫清轩,江晨,等.我国花生产业的发展现状与前景展望[J].山东农业科学, 2010,(7):117-119.
[2]李建辉.花生中黄曲霉毒素的影响因子及脱毒技术研究[D].北京:中国农业科学院,2009.Li Jianhui.Impact Factor and Detoxification of Aflatoxin inPeanuts[D].Beijing: Chinese Academy of Agricultural Sciences, 2009.(in Chinese with English abstract)
[3]何春林,张庆珍.小型花生榨油厂对黄曲霉毒素B1防控与技改措施[J].食品工业,2012,(7):111-113.He Chunlin, Zhang Qingzhen.The prevention and technical innovation measures to the Aflatoxin B1 in small peanut oil extractionfactory[J].Food Industy,2012,(7):111-113.(in Chinese with English abstract)
[4] Liu R, Chang M, Jin Q, et al.Degradation of aflatoxin B1 in aqueous medium through UV irradiation [J].European Food Research and Technology, 2011, 233(6): 1007-1012.
[5]白璐.黄曲霉毒素的危害[J].吉林农业,2012,(1):178-178.
[6] Moss M O.Risk assessment for aflatoxins in foodstuffs [J].International biodeterioration& biodegradation, 2002, 50(3): 137-142.
[7] GB2761-2011.食品安全国家标准食品中真菌毒素限量[S] .
[8] Ding X, Li P, Bai Y, et al.Aflatoxin B 1 in post-harvest peanuts and dietary risk in China[J].Food Control, 2012, 23(1): 143-148.
[9]张鹏,赵卫东.高效薄层色谱法测定黄曲霉毒素B1, B2, G1, G2[J].分析化学, 2000, 28(3): 392-392.
[10]王叶群,姚刚,张绍英.污染黄曲霉毒素花生的检测及分选技术研究进展[J].农业工程,2014,4(6):59-63.Wang Yequn,Yao Gang,Zhang Shaoying.Development of detection and sorting technology for Aflatoxins contaminated peanuts[J].Agricultural Engineering, 2014, 4(6): 59-63.(in Chinese with English abstract)
[11]高秀芬,计融,李燕俊,等.高效液相色谱法测定玉米中的黄曲霉毒素[J].中国食品卫生杂志,2007,19(2):105-108.Gao Xiufen, Ji Rong, Li Yanjun, et al.Detemination of aflatoxins in corns by high performance liquid chromatography[J].Chinese Journal of Food Hygiene, 2007, 19(2): 105-108.(in Chinese with English abstract)
[12]姜宗亮,门爱军,张艺兵,等.花生中黄曲霉毒素污染和控制[M].北京:中国标准出版社,2012.
[13]张俊.酶联免疫吸附法测定玉米中黄曲霉毒素B1含量的优势[J].中国科技纵横,2013,(12):52-52.
[14]张慧丽,杨松,苏君伟,等.黄曲霉菌感染花生的不同检测方法的应用[J].食品与生物技术学报,2013,32(8):868-874.Zhang Huili, Yang Song, Su Junwei, et al.Different detections on peanut infected by Aspergillusflavus[J].Journal of Food Science and Biotechnology, 2013, 32(8): 868-874.(in Chinese with English abstract)
[15] Gnanasekharan V, Chinnan M S, Dorner J W.Methods for characterization of kernel density and Aflatoxin levels of individual peanuts[J].Peanut Science, 1992, 19(1): 24-28.
[16] Chiou R Y Y, Tsao H H.Aflatoxin content of single peanut kernels in commercial lots and in kernels artificially infected with Aspergillusparasiticus[J].Journal of Food Protection, 1997, 60(7): 843-848.
[17]张文玲,袁涛,李书国.近10年粮油食品中黄曲霉毒素检测技术的研究进展[J].粮食加工,2012,37(1):77-81.
[18]李雅丽,刘阳.霉变花生光电分选技术应用现状及发展趋势[J].农业机械,2012,(12):50-53.
[19]李长强.黄曲霉毒素产生的原因,危害及控制措施[J].饲料博览,2012,(8):53-54.
[20] Ramos A J, Hernandez E.Prevention of aflatoxicosis in farm animals by means of hydrated sodium calcium aluminosilicate addition to feedstuffs: a review[J].Animal Feed Science and Technology, 1997, 65(1): 197-206.
[21]居乃虎.黄曲霉毒素[M].北京:轻工业出版社,1980,76-86.
[22] Steiner W E, Rieker R H, Battaglia R.Aflatoxin contamination in dried figs: distribution and association with fluorescence[J].Journal of Agricultural and Food Chemistry, 1988, 36(1): 88-91.
[23] Yao H, Hruska Z, Brown R L, et al.Hyperspectral bright greenish - yellow fluorescence(BGYF)imaging of aflatoxin contaminated corn kernels[C]//Optics East 2006.International Society for Optics and Photonics, 2006: 63810B-63810B-8.
[24]崔贵金.赤霉病麦粒光电分选技术研究[D].河南工业大学, 2013.Cui Guijin.Study on Separation of Wheat Scab by Photoelectric Separation Technology[D].Zhengzhou: Henan University of Technology, 2013.(in Chinese with English abstract)
[25]蓝健.大米色选机的应用研究[D].南昌:江西农业大学,2012.Lan Jian.Study on Application of Rice Color Soter[D].Nanchang: Jiangxi Agricultural University, 2012.(in Chinese with English abstract)
[26]陈红,丁幼春,熊利荣.无损检测技术在花生品质检测中的应用[J].粮油加工,2005,(2):53-55.
[27] Kim M S, Chen Y R, Mehl P M.Hyperspectral reflectance and fluorescence imaging system for food quality and safety [J].Transactions-American Society of Agricultural Engineers, 2001, 44(3): 721-730.
[28]王叶群.花生中黄曲霉毒素的荧光信号特征研究[D].北京:中国农业大学,2015.Wang Yequn.The Study on Fluorescent Signal Characteristics of Aflatoxions in Peanut[D].Beijing: China Agriculture University, 2015.(in Chinese with English abstract)
[29]张绍英,王叶群,刘婷,等.一种颗粒物料旋转下滑溜管:中国,201410602353.9[P].2014-10-31
[30] Yao H, Hruska Z, Kincaid R, et al.Correlation and classification of single kernel fluorescence hyperspectral data with aflatoxin concentration in corn kernels inoculated with Aspergillusflavusspores [J].Food Additives and Contaminants, 2010, 27(5): 701-709.(in Chinese with English abstract)
[31]刘绍刚,方如明,吴守一.花生仁品质的光特性分选技术[J].农业工程学报,1996,12(4):213-217.Liu Shaogang, Fang Ruming, Wu Shouyi.Peanut kernels quality sorting by optical Properties[J].Transactions of the Chinese Society of Agricultural Engineering(Transactions of the CSAE), 1996, 12(4): 213-217.(in Chinese with English abstract)
Fluorescent signal characteristics for sorting of peanut contaminated by aflatoxion
Wang Yequn, Yang Zengling, Zhang Shaoying※, Liu Ting
(College of Engineering, China Agriculture University, Beijing 100083, China)
Abstract:Peanuts are especially susceptible to contamination of aspergillusflavus and aspergillusparasiticus, which can produce a kind of highly toxic substance, aflatoxin.The study about the separation technology of aflatoxin-infected peanuts before processing can effectively isolate the source of contamination by taking precautions instead of executing treatment on the contamination, thus being of great significance on guaranteeing food safety.For the purpose of effectively eliminating the red-skin peanuts with excessive aflatoxin levels from raw materials, one technology concept of one-by-one sorting method using the exclusive fluorescent signal of the red-skin peanuts with excessive aflatoxin levels was conceived here referring to the existing color sorting system.In this study, the fluorescence spectra of 100 red-skin peanut samples with representative appearance were determined using Cary Eclipse fluorescent spectrophotometer(at an excitation wavelength of 365 nm, an emission wavelength in the range of 400~600 nm and discharge voltage of 400 V).According to the fluorescence intensity distribution of samples at the wavelength of 450 nm, all these 100 red-skin peanut samples were divided into 8 groups.The aflatoxin content for each group of samples was determined using the standard method, GB/T 18972-2003 Determination aflatoxin content in food-Cleanup by immunoaffinity chromatography determination by highperformance liquid chromatography and fluorimeter.By comparing the surface fluorescence spectroscopy of the 8 groups with the obtained results from the standard method, the fluorescence spectroscopy characteristics of the the red-skin peanuts with excessive aflatoxin levels were primarily determined.The accuracy rate of discriminating the aflatoxin levels of red-skin peanuts using surface fluorescence was evaluated by means of drawing the box-plots of the fluorescence intensity ratio at 450 nm/490 nm and 460 nm/490 nm.Taking the colony laser fluorescence microscope as a platform, and using a laser beam expander that can enlarge the projection area of the excitation light to cover 2-3 peanuts, the fluorescence images of the red-skin peanuts with excessive aflatoxin levels were taken using a monochrome fluorescence image acquisition system, which was set up by putting a band-pass filter(460±5 nm)at the front of an industrial camera objective.The results of this study showed that there was a correlation between the determination of the aflatoxinlevels in red-skin peanuts by using fluorescent spectrophotometer at an excitation wavelength of 365 nm to detect the fluorescence intensity at 450 nm and the aflatoxin measurement using the standard method, which means that while the fluorescence intensity at 450 nm is greater than 30 a.u., the aflatoxincontent exceeded the national standard limit.Thus, the characteristic fluorescent signal of the excessive aflatoxin contamination can be intended as follows: the emission spectra generate fluorescence peaks at 420~460 nm and the fluorescence intensity at 450 nm was greater than 30a.u., while under an excitation wavelength of 365nm.According to the calculation based on the Whisker upper and lower limit, the overlapping ratio of the fluorescence intensity was at 450 nm and 490 nm is 19%, indicating that the discrimination accuracy rate of red-skin peanuts with excessive aflatoxin levels was 81%.Meanwhile, using the fluorescence image acquisition system, the monochrome images of the aflatoxin excessive peanuts were obtained, which displayed blue light spot for the contaminated peanuts once the surface fluorescence intensity was greater than 40a.u.Overall, the study indicates that the surface fluorescence signal can be the exclusive light signal of the red-skin peanuts for on-line, nondestructive and one-by-one sorting, for the purpose of eliminating the red-skin peanuts with excessive aflatoxin levels.
Keywords:agricultural products; fluorescence; red-skin peanut; aflatoxin; sorting
通信作者:※张绍英(1961-),男,河北人,教授,博士生导师,主要从事农业工程装备研究。北京中国农业大学工学院,100083。
作者简介:王叶群(1989-),女,陕西人,博士生,主要从事农产品加工及贮藏研究。北京中国农业大学工学院,100083。E-mail:yequnw@163.com
基金项目:“十二五”国家科技支撑计划资助项目(2012BAD31B09)
收稿日期:2015-07-25
修订日期:2015-11-12
中图分类号:TS201.3
文献标志码:A
文章编号:1002-6819(2016)-01-0187-06
doi:10.11975/j.issn.1002-6819.2016.01.026

