Process and Kinetics of Pyrolysis of COPNA Resin Synthesized from FCC Slurry
Li Shibin; Sun Qiqian,; Jiang Wei; Teng Chuanliang; Wu Mingbo
(1. CPCIF Key Lab for Carbon Materials from Heavy Oil, State Key Laboratory of Heavy Oil Processing, College of Chemical Engineering, China University of Petroleum, Qingdao 266580; 2. China Petroleum Engineering Co. Ltd, North China Company, Renqiu 062552)
Process and Kinetics of Pyrolysis of COPNA Resin Synthesized from FCC Slurry
Li Shibin1; Sun Qiqian1,2; Jiang Wei1; Teng Chuanliang1; Wu Mingbo1
(1. CPCIF Key Lab for Carbon Materials from Heavy Oil, State Key Laboratory of Heavy Oil Processing, College of Chemical Engineering, China University of Petroleum, Qingdao 266580; 2. China Petroleum Engineering Co. Ltd, North China Company, Renqiu 062552)
The mechanism and kinetics of pyrolysis of condensed poly-nuclear aromatic (COPNA) resins were investigated by non-isothermal thermogravimetry/derivative thermogravimetry measurements at various heating rates (10, 20 and 30 K/min) in nitrogen atmosphere. The changes in the functional groups, microstructure, and elemental composition of COPNA resins heated to different temperatures (200, 400, and 600 ℃) were investigated by Fourier transform infrared spectroscopy, scanning electron microscopy, and elemental analysis, respectively. The results of the pyrolytic experiments indicated that the pyrolysis process could be divided into three stages: an initial weight loss stage ranging from 225—450 ℃, a second weight loss stage ranging from 450—560 ℃, and a thermally stable stage occurring above 560 ℃. The heating rate had little effect on the pyrolysis process, and thermogravimetric parameters of COPNA resin, such as temperature at initial weight loss stage (Ti), temperature at fi nal weight loss stage (Tf) and temperature at maximum weight loss stage (Tmax), shifted towards higher temperatures when the heating rate was increased. At higher heating temperature, the number of aliphatic chains and substituted groups attached to aromatic rings of the resultant sample was reduced, whereas the C/H ratio and porosity rate increased. Pyrolysis kinetics studies showed that the activation energy (E) range for the fi rst and second weight loss stages was 150—210 kJ/mol and 210—275 kJ/mol, respectively, which showed that the mechanism of thermal decomposition differed from that of the weight loss stages. Thek0value was in the orders of between 1011/s and 1018/s when the activation energy was less than 250 kJ/mol. When the activation energiy was greater than 250 kJ/mol, there was a linearly increasing relationship betweenk0andE.
pyrolysis kinetics; COPNA resin; FCC slurry
1 Introduction
The condensed poly-nuclear aromatic (COPNA) resins with a three-dimensional molecular network structure were fi rst introduced in the 1980s by Otani, et al.[1]These resins show considerable promise as novel heat-resistant materials, because they offer appropriate lubricity, moldability, and mechanical properties. In the fi rst studies on these materials, the monomers investigated were purely polycyclic aromatics, including phenanthrene, naphthalene, anthracene, and pyrene[2-4], which made the cost of COPNA resins quite high. More recently, less expensive materials with high aromatic content, including coal tar pitch, petroleum pitch, ethylene tar, fl uid catalytic cracking (FCC) slurry oil, vacuum residue, and other materials, have been applied in the preparation of COPNA resins[5-9].
The main uses of COPNA resin are in the domain for manufacturing carbon/carbon composites[10-11]. COPNA resins synthesized from aromatics-rich materials consist of thousands of polycyclic aromatics, and the corresponding pyrolysis process involves a series of complex reactions. During the pyrolysis process, a COPNA resin is converted to amorphous carbon with the release of many gaseous products. This pyrolysis process can result in damage to the structure and properties of carbon/carbon materials. Therefore, to limit the destruction of composites, it is necessary to thoroughly understand the pyrolysis process and kinetics parameters of COPNA resins. In recent decades, many researchers have synthesized COPNAresins from different raw materials, but most of the relevant work was focused on the reaction mechanisms and properties of COPNA resins. There have been few reports focusing on the pyrolysis process of COPNA resin[12], and the current knowledge of COPNA resin pyrolysis is limited.
A number of models have been developed for analyzing the kinetics of pyrolysis of various materials. Vand[13]developed the distributed activation energy model (DAEM), which has been applied to a wide variety of complex reactions[14-15]. A simplified DAEM was established by Miura and Maki[16-17]for estimating the distributed activation energies and corresponding frequency factors of multiple types of coal based on three thermogravimetric analysis (TGA) curves obtained at different heating rates. In further studies, the kinetics of pyrolysis of other types of coal, biomass, oil shale, heavy oil, petroleum asphaltenes, and polyester resin have been investigated using this model[18-24].
In the present study, the mechanism and kinetics of COPNA resin pyrolysis were studied by TGA, and the thermodynamic parameters were obtained at different heating rates. The Fourier transform infrared (FT-IR) spectroscopy, elemental analysis, and scanning electron microscopy (SEM) were applied to analyze the COPNA resins heated at different temperatures. Activation energies were estimated using the simplified DAEM described by Miura and Maki, and the activation energy distribution curves were obtained.
2 Experimental
2.1 Raw materials
COPNA resin was synthesized in the laboratory according to the method described in the literature[7]. 1,4-Benzenedimethanol (analytical reagent grade) used as the modi fi er was purchased from the Sinopharm Chemical Reagent Co., China. The FCC slurry was supplied by the Shandong Star Science and Technology Group.
2.2 Characterization
The FCC slurry and synthesized COPNA resin samples were systematically analyzed. The elemental analysis was performed using a Vario EL organic element analyzer. The toluene insoluble (TI) and quinoline insoluble (QI) substances were determined according to international standard methods (ISO 6245—1982, ISO 6376—1996, and ISO 6791—1981). The average molecular weight was determined by the vapor pressure osmometry. The average structural parameters, including the total carbon number of average molecule (CT), the total hydrogen number of average molecule (HT), the condensation degree parameter of average molecule (HAU/CA) and the hydrogen replaced rate surrounding aromatic rings of average molecule (σ), were obtained using the improved Brown-Ladner method.
For obtaining thermogravimetry (TG) and derivative TG (DTG) measurements, 10 mg of sample were placed in a platinum crucible in a Shimadzu DTG-60 thermogravimetric analyzer and heated to 800 ℃ at a heating rate of 10, 20, and 30 K/min, respectively, under a nitrogen flow of 30 mL/min. The FT-IR spectra of COPNA resins heated to different temperatures were recorded on a Shimadzu 8400S FT-IR spectrometer in the transmittance mode. The scan frequency for each spectrum was 15 s-1.
3 Kinetics Model
The DAEM has been widely used in systems involving complex reactions. The DAEM assumes that a number of parallel, irreversible, and first-order reactions with different energies occur simultaneously, and that all the reaction activation energies have the samek0at the same conversion rate. The activation energy shows a continuous distribution. The release of volatiles is given by:

whereEis the activation energy,V/V* is the devolatilization rate,f(E) is the distribution curve of the activation energy that represents the difference in the activation energies of many first-order irreversible reactions, andk0is the frequency factor corresponding to theEvalue.
The DAEM was simpli fi ed by Miura and Maki[15-16], and the Arrhenius equation of the simpli fi ed DAEM model is:

This equation is used to calculate the values of activation energy (E), the corresponding frequency factor (k0), andf(E) using data for pyrolysis with three different heating profiles. The procedure of Miura and Maki[16]involvesthe following steps: (1) for at least three different heating rates, measureV/V* vs.T; (2) calculate ln(h/T2) and 1/Tat the sameV/V*, wherehis the heating rate; (3) plot ln(h/T2) and 1/Tat the selectedV/V* and determine the activation energy (E) from the slope andk0from the intercept; and (4) fi nally, plotV/V* andEand determinef(E) by differentiating theV/V* vs.Erelationship byE.
4 Results and Discussion
4.1 Properties of FCC slurry and COPNA resin
Table 1 shows the basic properties of FCC slurry and the obtained COPNA resin. The elemental analysis of FCC slurry and COPNA resin showed that the content of carbon (C) and hydrogen (H) in COPNA resin was lower than that in FCC slurry, whereas the content of O in COPNA resin was higher than that in FCC slurry. This difference might be caused by the crosslinking reaction between FCC slurry and 1,4-benzenedimethanol. The average molecular weight and the average structural parameters includingCT,HT,fA, andσincreased significantly in COPNA resin. In addition, the average molecular weights,CT, andHTshowed that the average degree of polymerization was approximately 3. The carbon residue was dramatically increased from 19.81% in FCC slurry to 37.24% in the COPNA resin. Both TI and QI values were also greatly increased, and the TIQI value was increased significantly from 1.80% for FCC slurry to 12.41% for COPNA resin. The TI-QIvalue is a critical parameter that determines the binding performance, and the resin with a TI-QI value of >8.0% is deemed suitable for industrial application as a binder.
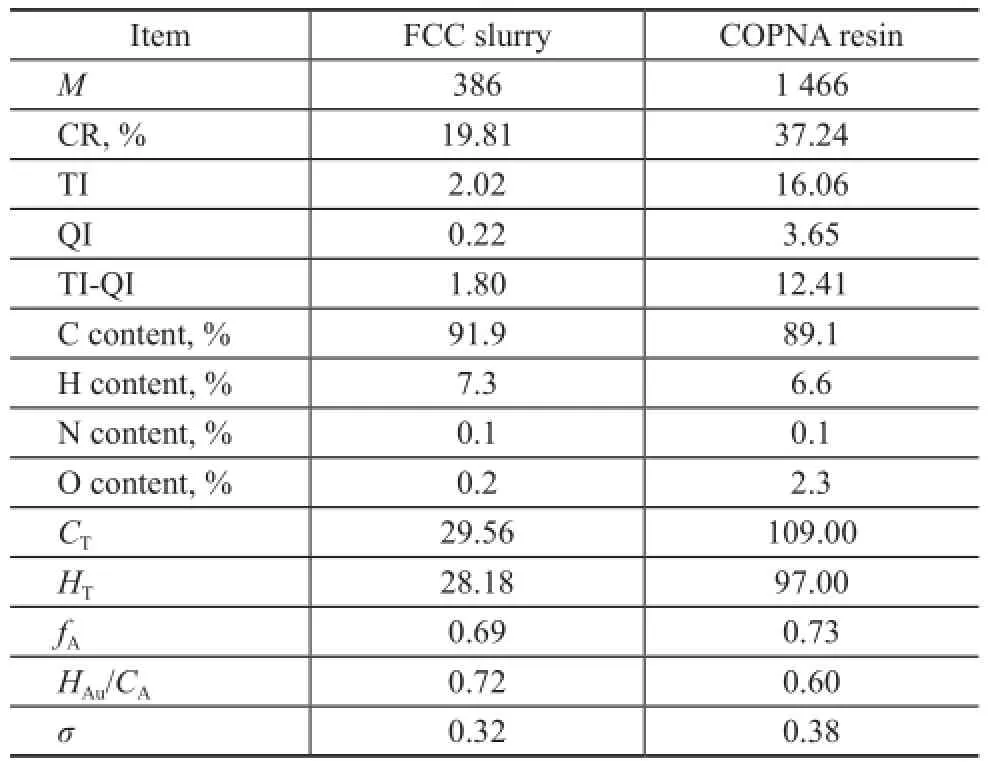
Table 1 Properties of COPNA resin
4.2 Pyrolysis process analysis
The TG and DTG curves of COPNA resins heated at different heating rates are shown in Figure 1a and 1b. It can be seen that the weight loss of COPNA resins starts at about 180 ℃ and ends at about 580 ℃. The weight loss of the COPNA resins can be divided into three stages. The fi rst stage is in the temperature range of 225—450 ℃, and within this range, the weight loss is mainly caused by evaporation of uncrosslinked, low molecular weight compounds. The second stage is between 450 ℃ and 580 ℃, and within this range, the weight loss is resulted from the removal of light molecules generated during the multiple and complex reactions of pyrolysis (cracking, polymerization/condensation, etc.). The third stage is the thermally stable stage occurring at temperatures above 580 ℃, when the resin has been already transformed into a solid-state semicoke.
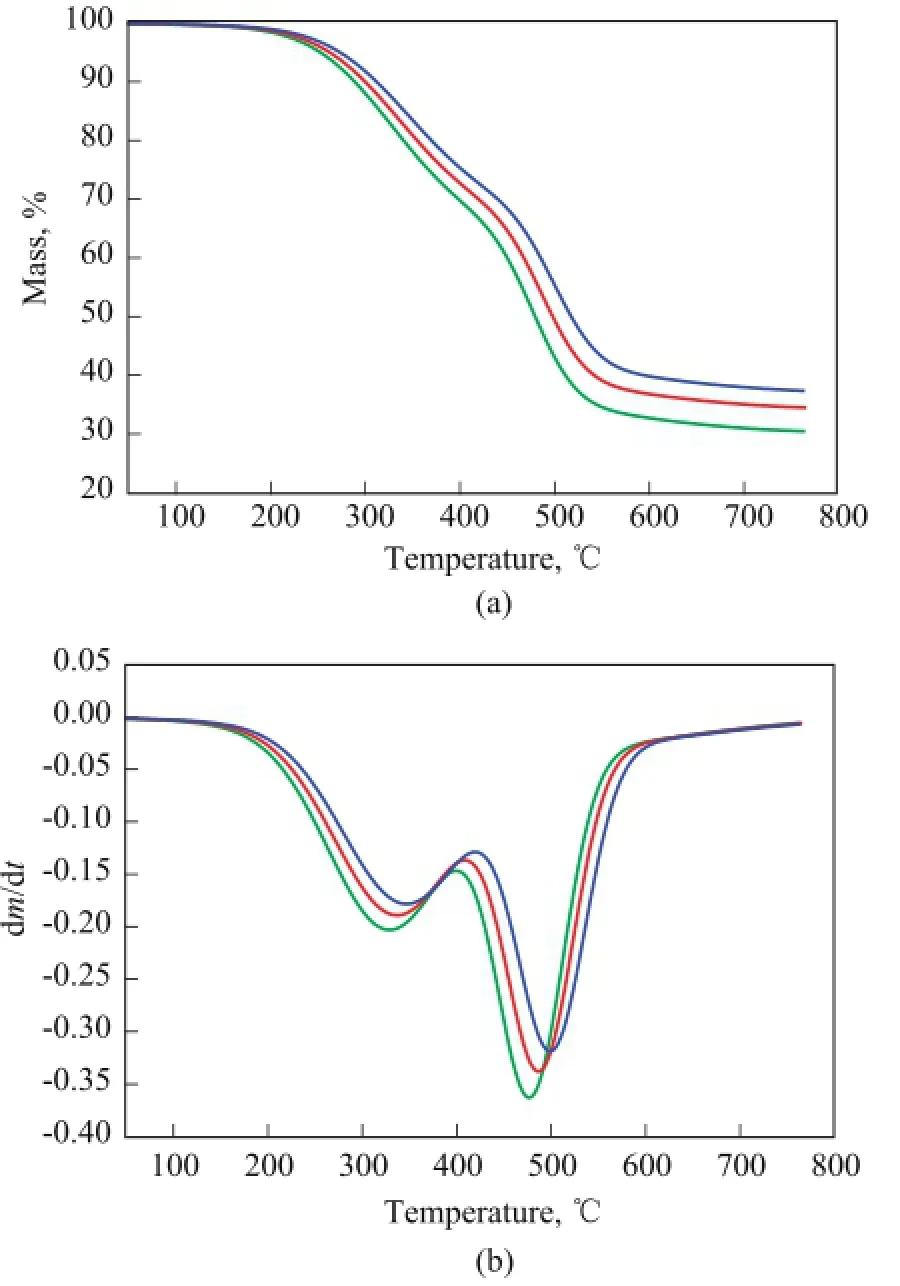
Figure 1 TG (a) and DTG (b) curves of COPNA resin under different heating rates
The DTG curves of COPNA resin show two peaks of maximum rate of weight loss in the regions of approximately ranging from 320 ℃ to 350 ℃ and from 470 ℃ to 500 ℃, with one peak in each of the fi rst two stages. Table 2 shows the TG parameters of COPNA resins. It can be observed that the temperature at which weight loss was initiated (Ti), the temperature at which the maximum weight loss rate occurred (Tmax), and the temperature at which weight loss finally terminated (Tf) for COPNA resin all shifted to higher temperatures when the heating rate increased.
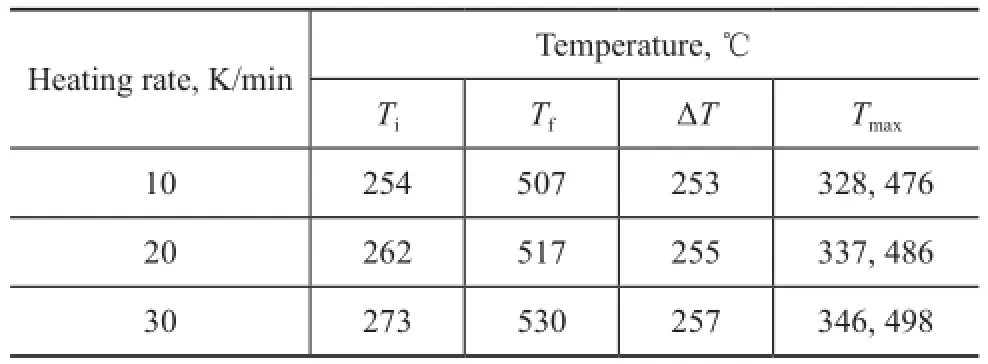
Table 2 TG parameters of COPNA resin
4.3 FT-IR analysis
FT-IR spectra for COPNA resins heated to different temperatures are shown in Figure 2. As regards the COPNA resins, the FT-IR spectra typically displayed peaks between 870 cm-1and 680 cm-1arising from the out-of-plane vibration of aromatic C—H bonds, while a peak near 1 124 cm-1was attributed to the stretching vibration of C—O bond in ether, the peaks near 1 037 cm-1and 1 186 cm-1were related to the vibration of —SO3radical, a peak near 1 378 cm-1belonged to the bending vibration of —CH3radical, a peak near 2 729 cm-lcorresponded to the stretching vibration of aromatic aldehyde C=O group, the peaks near 1 450 cm-1, 1 500 cm-1and 1 600 cm-1were caused by aromatic C=C bonds, and the peaks near 2 850 cm-1and 2 920 cm-1were related to methylene C—H bonds.
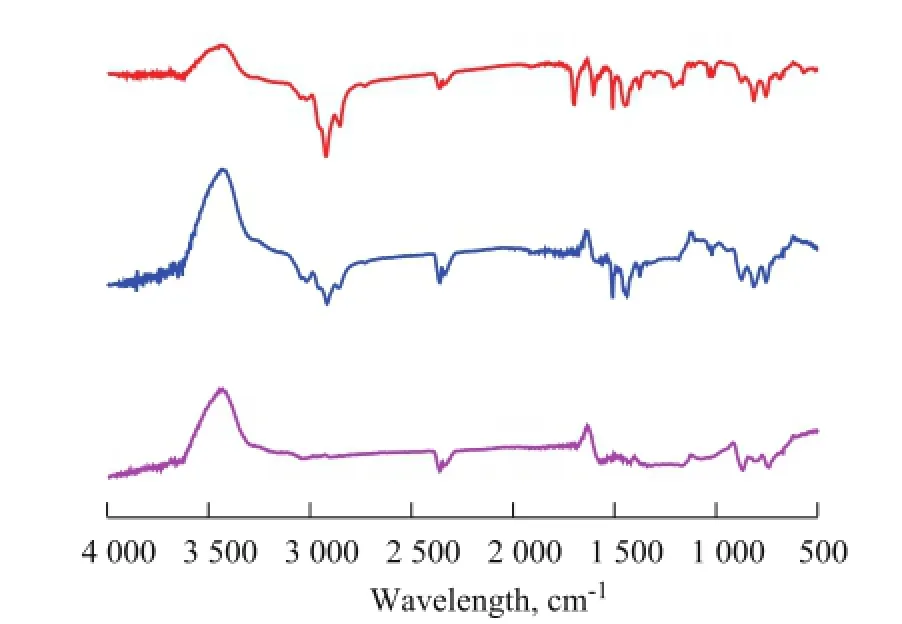
Figure 2 FT-IR spectra of COPNA resins heated to different temperatures
In contrast to the spectrum of COPNA resin at 200 ℃, in the spectrum of COPNA resin at 400 ℃ the peaks at 2 850 cm-1and 2 920 cm-1were weakened and the peaks at 1 186 cm-1and 2 729 cm-1were not visible. These changes might be caused by cleavage of thermally unstable C—O and C—S bonds and aliphatic chains during the heating process taking place from 200 ℃ to 400 ℃. In comparison with the spectra of COPNA resins at 400 ℃ and 600 ℃, we see that the peaks near 1 124 cm-1, 1 450 cm-1, 1 500 cm-1, 1 378 cm-1, 2 729 cm-1, 2 850 cm-1, and 2 920 cm-1disappeared and the peak at 813 cm-1had weakened significantly in the course of heating from 400 ℃ to 600 ℃. This outcome might be caused by the multiple and complex reactions (cracking, polymerization, condensation, and aromatization) that took place during the heating process from 400 ℃ to 600 ℃, resulting in the disappearance of aliphatic chains and the reduction of substituted groups attached to aromatic rings.
4.4 Elemental analysis
Table 3 shows the results of the elemental analysis of COPNA resin heated to different temperatures. The results showed that the content of O and H in COPNA resin heated to 400 ℃ was lower than that of resin heated to 200 ℃. This might be attributed to the removal of low molecular weight compounds such as H2O, CO2, and CH3OH resulted from the cleavage of ether bonds and the breakdown of side chains attached to aromatic rings. The content of H in COPNA resin heated to 600 ℃ was much lower than that of resin at 400 ℃, which might be caused by the reactions of polymerization, condensation,and aromatization. In addition, the C/H ratio of COPNA resin increased with an increasing temperature, indicating that the degree of condensation of COPNA resin was enhanced gradually.
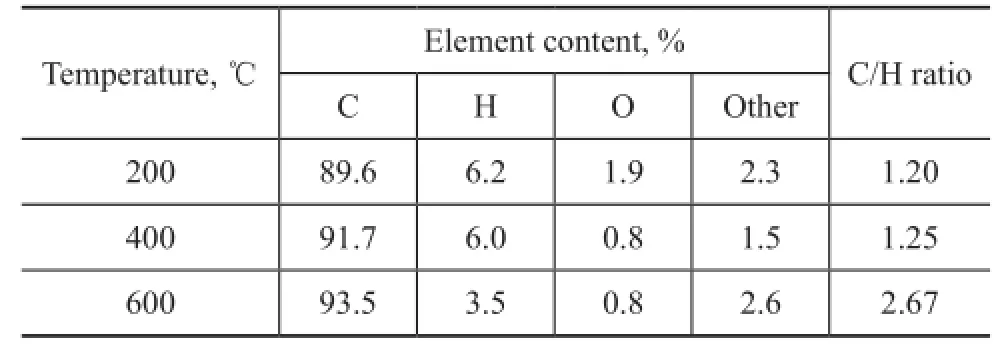
Table 3 Elemental compositions of COPNA resin heated at different temperatures
4.5 SEM analysis
Representative SEM images of COPNA resins heated to different temperatures are presented in Figure 3. It can be seen from the images that COPNA resin contained small bubbles after being heated to 200 ℃, which were caused by the evaporation of H2O during the reaction between aromatics and the crosslinking agent. As the temperature was increased to 400 ℃, the porosity of COPNA resin also increased. Most of the pores were closed, with a diameter of several millimeters. These pores might be generated by the escaping low molecular weight compounds as mentioned in Sections 3.3 and 3.4. After being further heated to about 600 ℃, the pores within COPNA resins became open pores with a dimension of several hundred millimeters. The evaporation of gas produced during the reactions of cracking, polymerization, condensation, and aromatization might be responsible for the formation of these larger pores.

Figure 3 SEM images of COPNA resins heated at different temperature
4.6 Pyrolysis kinetics analysis
Plots ofV/V* vs.Tfor COPNA resin at different heating rates of 10, 20, and 30 K/min, respectively, are shown in Figure 4a. The curves shifted to higher temperatures with the increase in heating rate. It can be seen in Figure 4a that the pyrolysis of COPNA resin took place mainly within the temperature range between 300 ℃ and 580 ℃, and approximate 80% of the total weight loss occurred within this temperature range. Plots of ln(h/T2) and 1/Tfor COPNA resin at speci fi ed ratios ofV/V* and different heating rates are shown in Figure 4b. The activation energy,E, and the frequency factor,k0, can be obtained from the slope and intercept in the Arrhenius plots at each rate of devolatilization. Because the activation energy was very sensitive to the linearity of the ln(h/T2) vs. 1/Trelationship, these lines were carefully drawn in the same plot and could be used only if the measure of linearityR2was greater than 0.99.
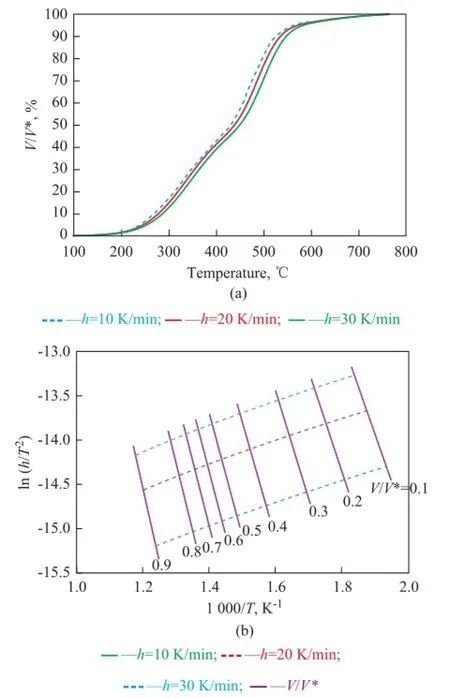
Figure 4 (a) Devolatilization rate of COPNA resin heated at different rates, and (b) ln(h/T2) vs. 1/Tfor COPNA resin heated at different rates
Figure 5a shows the relationship betweenV/V* and activation energy,E, for COPNA resin. The devolatilization rates increased continuously with anincrease in the activation energy up to 250 kJ/mol. However, once the activation energy exceeded 250 kJ/mol, the value ofV/V* changed very little, which indicated that the activation energy of thermal decomposition was between 150 and 250 kJ/mol. Figure 5b shows the plot ofk0vs.E. It can be seen that thek0value of pyrolysis reactions varied with an increasing activation energy. At an activation energy of between 150 kJ/mol and 250 kJ/mol,k0was in the order of between 1013s-1and 1014s-1. At an activation energy of greater than 250 kJ/mol, k0increased linearly with an increasing activation energy. These results clearly demonstrated that thek0value could not be assumed to be constant for the pyrolysis of COPNA resin. The activation energy distribution curve for COPNA resin is displayed in Figure 5c. Two peaks in thef(E) curve for COPNA resin appear in the activation energy ranges of between 150—210 kJ/mol and 210—275 kJ/mol. These results have shown that the mechanism of thermal decomposition is different in each weight loss stage.

Figure 5 The relationship between (a)V/V*, (b)k0, and (c)f(E) vs.E
5 Conclusions
The process of COPNA resin pyrolysis could be divided into three stages: the fi rst weight loss stage ranging from 225—450 ℃, the second weight loss stage ranging from 450—560 ℃, and the thermally stable stage taking place beyond 560 ℃. The pyrolysis behavior of COPNA resin was affected by the heating rate. This is evidenced by the increase inTi,TfandTmaxvalues with an increasing heating rate and the decrease in the ratio of weight loss in each weight loss stage. With an increasing heat treatment temperature, the aliphatic chains and substituted groups attached to aromatic rings in COPNA resin were reduced, whereas the C/H ratio and porosity rate of the resultant sample increased. Thef(E) curve for COPNA resin contained two peaks at the activation energy ranging between 150—210 kJ/mol and 210—270 kJ/ mol. These results showed that the mechanism of thermal decomposition was different in each weight loss stage. Thek0value was between 1013s-1and 1014s-1for an activation energy of less than 250 kJ/mol but increased linearly for an activation energy of greater than 250 kJ/mol, demonstrating thatk0could not be assumed to be constant for the pyrolysis of COPNA resin.
Acknowledgements: This work was supported by the National Natural Science Foundation of China (511572296), and the Fundamental Research Funds for the Central Universities (15CX02084A).
[1] Otani S, Yu H A, Ota E. Carbonization behavior of condensed poly-nuclear aromatic (COPNA) resins[J]. Tanso, 1986, 127(1): 162-170
[2] Katsuki K, Satoru G, Shigeharu M. Carbon molecular sieving membranes derived from condensed polynuclear aromatic (COPNA) resins for gas separations[J]. Ind EngChem Res, 1998, 37(11): 4262-4266
[3] Ota Michiya, Otani Sugio, Iizuka Shinji, et al. Synthesis of polycondensed polynuclear aromatics (COPNA) resin from the mixture of pyrene and phenanthrene using dimethyl derivatives of benzenedimethanols as crosslinking agents[J]. Nippon Kagaku Kaishi, 1988(3): 343-350
[4] Tanemura K, Suzuki T, Nishida Y, et al. Synthesis of the strongly acidic sulfonated condensed polynuclear aromatic (S-COPNA) resins using aromatic aldehydes as crosslinking agents[J]. Polymer Bulletin, 2012, 68(3): 705-719
[5] Yan Yongli, He Li. Synthesis of condensed polynuclear aromatic resin using petroleum asphalt as monomer and its mechanism[J]. Polymer Materials Science and Engineering, 2003, 19(5): 93-96
[6] Lin Qilang, Li Tiehu. Synthesis and properties of condensed polynuclear aromatics resin using coal tar pitch as monomer and terephthalic aldehyde as cross-linking agent[J]. Polymer Materials Science and Engineering, 2007, 23(2): 62-64
[7] Guo Yansheng, Zha Qingfang, Wu Mingbo, et al. Separation of rich aromatic components from FCC slurries with extraction and synthesis of COPNA resin[J]. Journal of China University of Petroleum (Edition of Natural Science), 2002, 26(4): 80-83
[8] Wu Mingbo, Shi Yangyang, Li Shibin, et al. Synthesis and characterization of condensed poly-nuclear aromatic resin derived from ethylene tar[J]. China Petroleum Processing and Petrochemical Technology, 2012, 14(4): 21-26
[9] Wu Mingbo, Jiang Wei, Wang Yuwei, et al. Synthesis of condensed polynuclear aromatic resin from furfural extract oil of reduced-pressure routeⅡ[J]. Pet Sci, 2013, 10(4): 584-588
[10] Otani S, Raskovic V, Oya A, et al. Some properties of a condensed polynuclear aromatic resin (COPNA) as a binder for carbon fi bre composites[J]. Journal of Materials Science, 1986, 21(6): 2027-2032
[11] Xiao Zhiying, Jiang Jianchun, Zhou Jiuning. New matrix precursor for carbon-carbon composites—COPNA resin[J]. Materials Science and Engineering of Powder Metallurgy, 2006, 11(2):118-121
[12] Li Shibin, Sun Qiqian, Wang Yuwei, et al. Curing mechanism of condensed polynuclear aromatic resin and thermal stability of cured resin[J]. China Petroleum Processing & Petrochemical Technology, 2015, 17(2): 9-16
[13] Vand V. A theory of the irreversible electrical resistance changes of metallic films evaporated in vacuum[J]. Proc Phys Soc, 1942, A55: 222-246.
[14] Pitt G J. The kinetics of the evaluation of volatile products from coal[J]. Fuel, 1962, 41: 267-274.
[15] Lakshmanan C C, Bennet M L, White N. Implications of multiplicity in kinetic parameters to petroleum exploration distributed activation energy models[J]. Energy Fuels, 1991, 5(1): 110-117.
[16] Miura K. A new and simple method to estimatef(E) andk0(E) in the distributed activation energy model from three sets of experimental data[J]. Energy Fuels, 1995, 9(2): 302-307.
[17] Miura K, Maki T. A simple method for estimatingf(E) andk0(E) in the distributed activation energy model[J]. Energy Fuels, 1998, 12(5): 864-869.
[18] Xu Long, Tang Mingchen, Duan Lin’e, et al. Pyrolysis characteristics and kinetics of residue from China Shenhua industrial direct coal liquefaction plant[J]. Thermochimica Acta, 2014, 589(10): 1-10.
[19] Yang Xuewei, Zhang Rui, Fu Juan, et al. Pyrolysis kinetics and product analysis of different micro-algal biomass by distributed activation energy model and pyrolysisgas chromatography-mass spectrometry[J]. Bioresource Technology 2014, 163(7): 335-342.
[20] Wu Mingbo, Várhegyi Gábor, Zha Qingfang. Kinetics of cellulose pyrolysis after a pressurized heat treatment[J]. Thermochimica Acta, 2009, 496(1/2): 59-65.
[21] Wang Qing, Wang Haigang, Sun Baizhong, et al. Interactions between oil shale and its semi-coke during cocombustion[J]. Fuel, 2009, 88(8): 1520-1529.
[22] Zan Cheng, Zhang Qiang, Ma Desheng, et al. The oxidation of heavy oil: Thermogravimetric analysis and non-isothermal kinetics using the distributed activation energy model[J]. Fuel Processing Technology, 2014, 119(1): 146-150.
[23] Dong Xigui, Lei Qunfang, Fang Wenjun, et al. Thermogravimetric analysis of petroleum asphaltenes along with estimation of average chemical structure by nuclear magnetic resonance spectroscopy[J]. Thermochimica Acta, 2005, 427(1/2): 149-153.
[24] Jankovic Bojan. The kinetic analysis of isothermal curing reaction of an unsaturated polyester resin: Estimation of the density distribution function of the apparent activation energy[J]. Chemical Engineering Journal, 2010, 162(1): 331-334.
Received date: 2015-12-15; Accepted date: 2016-02-18.
Professor Wu Mingbo, E-mail: wumb@upc.edu.cn.
- 中国炼油与石油化工的其它文章
- Synthesis and Evaluation of Environmentally Friendly Calcium Isostearate Detergent with Excellent Oil Solubility
- Study on the Adaptability of Etheri fi cation Feedstock to Reactor Type
- Modeling of Isobutane/Butene Alkylation Using Solid Acid Catalysts in a Fixed Bed Reactor
- Analysis and Modeling of Wangqing Oil Shale Drying Characteristics in a Novel Fluidized Bed Dryer with Asynchronous Rotating Air Distributor
- Experimental and Molecular Simulations for Evaluating the Effect of Lubricity Improvers on the Property of Jet Fuel
- Preparation and Tribological Properties of Lanthanumdoped Muscovite Composite Particles as Lubricant Additives in Lithium Grease

