基于荧光定量PCR DNA熔解曲线技术分析浸润性导管乳腺癌患者外周血和肿瘤组织TCR beta链CDR3谱系
贺晓燕,孙素红,杨伟明,唐文台,马 锐,张 天,姚新生
(1.遵义医学院 贵州省免疫学特色重点学科暨贵州省免疫学研究生教育创新基地,贵州 遵义 563099;2.遵义医学院附属医院 甲乳外科,贵州 遵义 563099;3.遵义医学院附属医院 病理科,贵州 遵义 563099)
临床医学研究
基于荧光定量PCR DNA熔解曲线技术分析浸润性导管乳腺癌患者外周血和肿瘤组织TCR beta链CDR3谱系
贺晓燕1,孙素红2,杨伟明2,唐文台3,马锐1,张天1,姚新生1
(1.遵义医学院 贵州省免疫学特色重点学科暨贵州省免疫学研究生教育创新基地,贵州 遵义563099;2.遵义医学院附属医院 甲乳外科,贵州 遵义563099;3.遵义医学院附属医院 病理科,贵州 遵义563099)
[摘要]目的 采用TCR beta链CDR3谱系荧光定量PCR的DNA熔解曲线技术,探讨浸润性导管乳腺癌患者外周血T细胞和肿瘤组织T细胞之间TRBV基因表达情况。方法 从遵义医学院附属医院甲乳外科采集乳腺癌志愿患者的乳腺肿瘤组织和外周血样本,选取病理诊断为浸润性导管癌的志愿患者23例,免疫组织化学检测ER、PR、PS2、C-erbB-2、nm23、P53和Ki-67的表达。分离每位志愿患者外周血单个核细胞(PBMCs),提取PBMCs和肿瘤部位组织总RNA,逆转录为cDNA,荧光定量PCR技术扩增各cDNA样本的TCR beta链CDR3区,DNA熔解曲线法对比分析各样本TRBV基因家族的表达情况。结果 23例浸润性导管乳腺癌志愿患者,外周血样本中TRBV6、TRBV8、TRBV12、TRBV14和TRBV24表达超过50%,肿瘤组织样本中TRBV6、TRBV12、TRBV14和TRBV24表达超过50%。选取的23例样本中的20例,其外周血和肿瘤组织均过表达相同的TRBV基因家族,但总TRBV基因家族的表达与ER、PR、PS2、C-erbB-2、nm2、P53和Ki-67的阳性或阴性没有明显的相关性。结论 浸润性导管乳腺癌患者的外周血和肿瘤组织之间TRBV基因表达出现一致性,但表现出复杂多样性,与乳腺肿瘤相关抗原无明显相关,其机制可能与乳腺癌个体化的全身和局部免疫应答相关,对乳腺癌外周血和肿瘤组织部位特异T细胞TRBV基因表达探讨可为乳腺癌的免疫机制和个体化治疗提供理论基础。
[关键词]浸润性导管癌;TRBV基因;TCR CDR3谱系;DNA熔解曲线技术;荧光定量PCR
Human peripheral T cell receptor (TCR) is an antigen receptor of T cells that belongs to the immunoglobulin superfamily. This receptor is composed of an α and β chain in 95% of cases; therefore, these cells are referred to as αβ + T cells[1-2]. The TCR beta chain is derived from the rearrangement of “BV-BD-BJ-BC” gene fragments. Complementarity-determining region 3 (CDR3) of the TCR beta chainis joined by theBVgene fragment (terminus), theBDgene fragment (middle), and theBJgene fragment (foreside), and then some nucleotide sequences are inserted between V-D and D-J by TdT[3].
CDR3 contributes to antigen recognition specificity, since T cells have the ability to adapt a variety of antigens. Different T cell clones correspond to different sizes and DNA sequences of CDR3 and form a diverse CDR3 gene repertoire, which determines the specificity of the TCR. Therefore, analysis of the diversity and length of the TCR CDR3 region and the expression frequency of the TCR CDR3 gene under different pathological states can be used to determine the clonal features of specific T cell responses and reflect the functional state of the T cell[4-6]. It has been reported that there is a correlation between TCR beta chain CDR3 spectratyping and tumor characteristics in lung cancer[7-8], gastric cancer[9], ovarian cancer[10], and colorectal cancer[11-12].
We previously have analyzed the TCR alpha chain CDR3 repertoire in PBMCs and TILs in breast cancer patients and found certain preferentially expressedTRAVgenes[13]. It is more complex to rearrange and reduce the bias frequency for the TCR alpha chain than the beta chain. Rearrangement of the TCR beta chain requires allelic exclusion; the TCR beta chain can choose several alpha chains in which to pair after finishing the beta chain rearrangement, which does not strictly require allelic exclusion for the TCR alpha chain. Moreover, rearrangement occurs more often for alpha chains during secondary rearrangement. Thus, the aim of this study was to exploreTRBVgene expression in PBMCs and in TILs in patients with IDCA tumors.
1Materials and methods
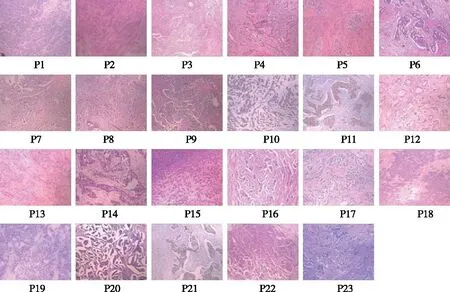
1.1PatientsCancerous breast tissue and peripheral blood samples were obtained from surgical dissections (Fig 1). All patients were negative for HbsAg and sero-negative for markers of hepatitis A, C, D, and E viruses, and HIV; and none had clinical or laboratory evidence of other infectious diseases, types of tumors, or immunological disorders.
1.2PrimersThe primers used forTRBVfamily-specific amplification have been previously described[14]. Twenty-sixTRBVsense primers and a common antisense primer toTRBCwere used. All the primers were synthesized by the Shanghai Invitrogen Corporation of China.
1.3Isolation of mononuclear cellsPBMCs were isolated by Ficoll-Hypaque density gradient centrifugation using peripheral blood (5 ml) from each patient. IDCA breast tissues were collected and digested by trypase.

Fig 1 The histopathological pictures of twenty-three patients with infiltrating ductal breast carcinoma
1.4Extraction of RNA and synthesis of the first-strand cDNATotal RNA from PBMCs and TILs of each patients was extracted by the RNA extraction kit (Omega) according to the manufacturer’s instructions. The cDNA was synthesized using cDNA synthesis kit (MBI-Fermentas). In brief, 7.0 μl of RNA was mixed with 2.0 μl of Oligo(dT) primer and incubated 10 min at 70 °C in water bath. The mixture was put on ice immediately for 2 min. 1.0 μl of dNTP mixture (10 mM each), 0.5 μl of RNase inhibitor, 0.5 μl of RevertAidTM M-MuLV Reverse Transcriptase and 4 μl of 1× M-MLV Buffer were added into the mixture and the total volume is 20 μl by adding the molecule-grade water free of RNase. The mixture was incubated for 60 min at 42 °C then 10 min at 70 °C to terminate the reaction. Fluorogenic quantitative polymerase chain reaction (FQ-PCR) can intuitively reflect the characteristic of CDR3 cDNA amplification and CDR3 spectratyping[15-17].
1.5Reaction systemFQ-PCR was carried out in a 20 μl volume with 1 μl of cDNA as the template, each primer at 0.3 μmol/l, and 10 μl of 2×Real-time PCR Master Mix (TOYOBO), containing Taq polymerase, dNTPs, PCR buffers, and SYBR green I. Amplification reactions for each sample were carried out using the GAPDH-specific primer paired with a specific primer for eachTRBVgene family, and melting temperatures (Tms) were determined. The standard curve using the GAPDH expression level in the JEC cell line was regarded as the relative standard.
1.6Reaction conditionsReactions were performed in a DNA Engine Opticon® 2 System and analyzed with Opticon Monitor 3.0 software (Bio-Rad) using the following procedure: incubation at 94 ℃ for 3 min, 94 ℃ melting for 20 sec, primer annealing at 56 ℃ for 30 sec, and extension at 72 ℃ for 30 sec and 80 ℃ for 2 sec for 40 cycles. A fluorescence signal was acquired every cycle during extension at 80 ℃. After a final extension at 72 ℃ for 10 min, a melting step was performed by slow heating from 75 ℃ to 95 ℃ with a ramping of 0.2 ℃/sec, during which the fluorescence signal was measured continuously. The PCR product was stored at -20 ℃.
2Results
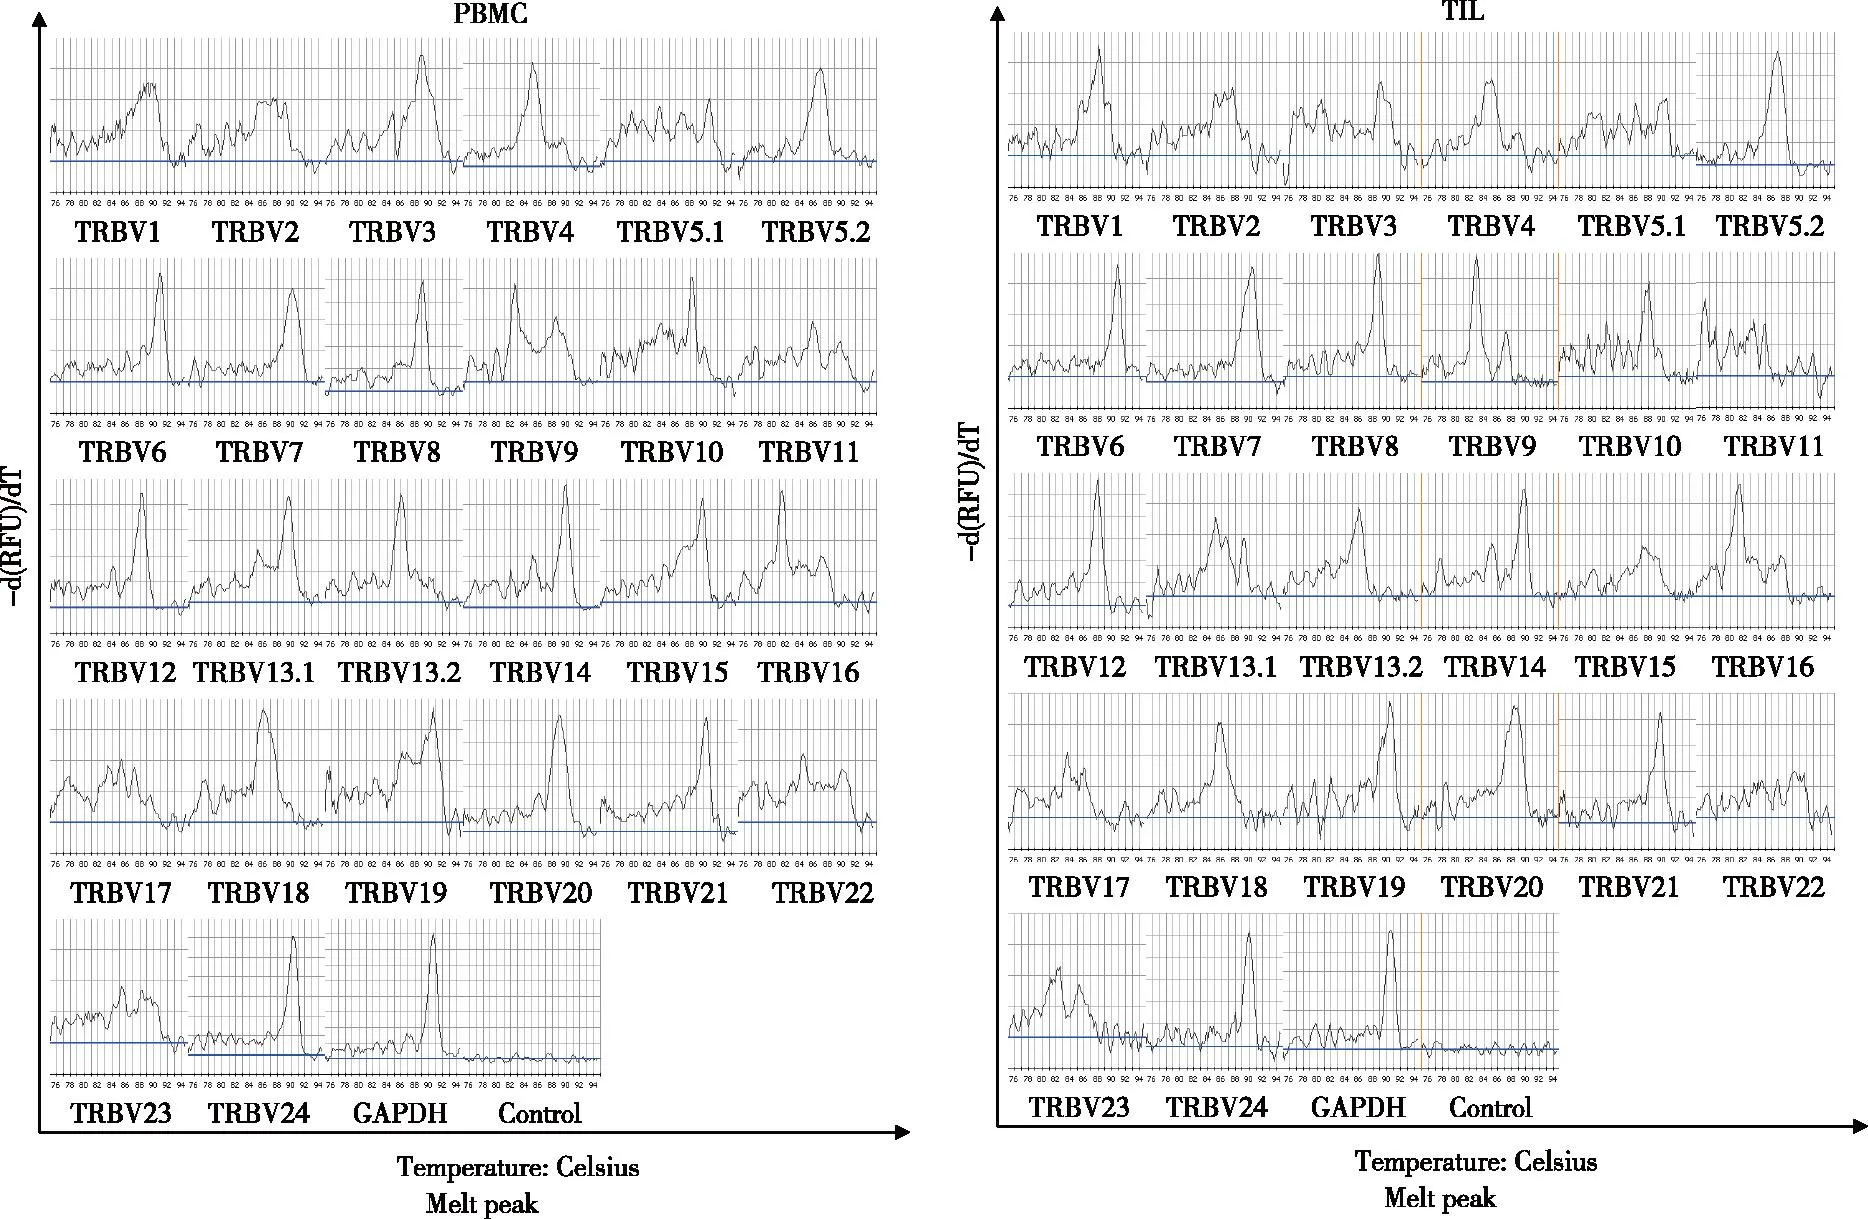
2.1SomeTRBVCDR3 genes showed monoclonal peaks in the PBMCs and TILs Melting curve spectratyping of 24TRBVCDR3 genes in PBMCs of patient 5 showed monoclonal peaks forTRBV5.2,TRBV6,TRBV7,TRBV8,TRBV12,TRBV13.2,TRBV20,TRBV21,TRBV24. In the TILs,TRBV5.2,TRBV6,TRBV7,TRBV8,TRBV12,TRBV21 andTRBV24 CDR3 spectratyping showed monoclonal peaks. Fig 2 shows an example of melting curve spectratyping for 24TRBVCDR3 genes in the PBMCs and TILs of patient 5(The melting curve spectratyping data for other patients are not shown).

A: Melting curve spectratyping of 24 TRBV CDR3 genes in the PBMCs of patient 5. The GAPDH products showed a single peak, while the negative control showed no peak. TRBV5.2, TRBV6, TRBV7, TRBV8, TRBV12, TRBV13.2, TRBV20, TRBV21and TRBV24 CDR3 spectratyping showed monoclonal peaks;B: Melting curve spectratyping of 24 TRBV CDR3 genes in the TILs of patient 5. The GAPDH products showed a single peak, the negative control showed no peak, and TRBV5.2, TRBV6, TRBV7, TRBV8, TRBV12, TRBV21 and TRBV24 CDR3 spectratyping showed monoclonal peaks. Fig 2 Melting curve spectratyping of 24 TRBV CDR3 genes in the PBMCs and TILs of patient 5
2.2Preferential expression of certainTRBVgenes in PBMCs and in TILs.There was preferential expression of certainTRBVgenes using TCR beta CDR3 spectratyping in PBMCs and in TILs of all 23 patients with IDCA tumors. The most commonTRBVgenes expressed in PBMCs from these patients (exceeding frequencies of 50%) wereTRBV6,TRBV8,TRBV12,TRBV14, andTRBV24 (Fig 3). In TILs, the following genes were expressed by more than 50% of patients:TRBV6,TRBV12,TRBV14, andTRBV24 (Fig 3). In 20 of the 23 patients, the sameTRBVgene was preferentially expressed in both PBMCs and TILs. For example,TRBV9,TRBV11, andTRBV13.2 were highly expressed in PBMCs and in TILs from patient 1. Data from all 23 patients are summarized in Table 1.
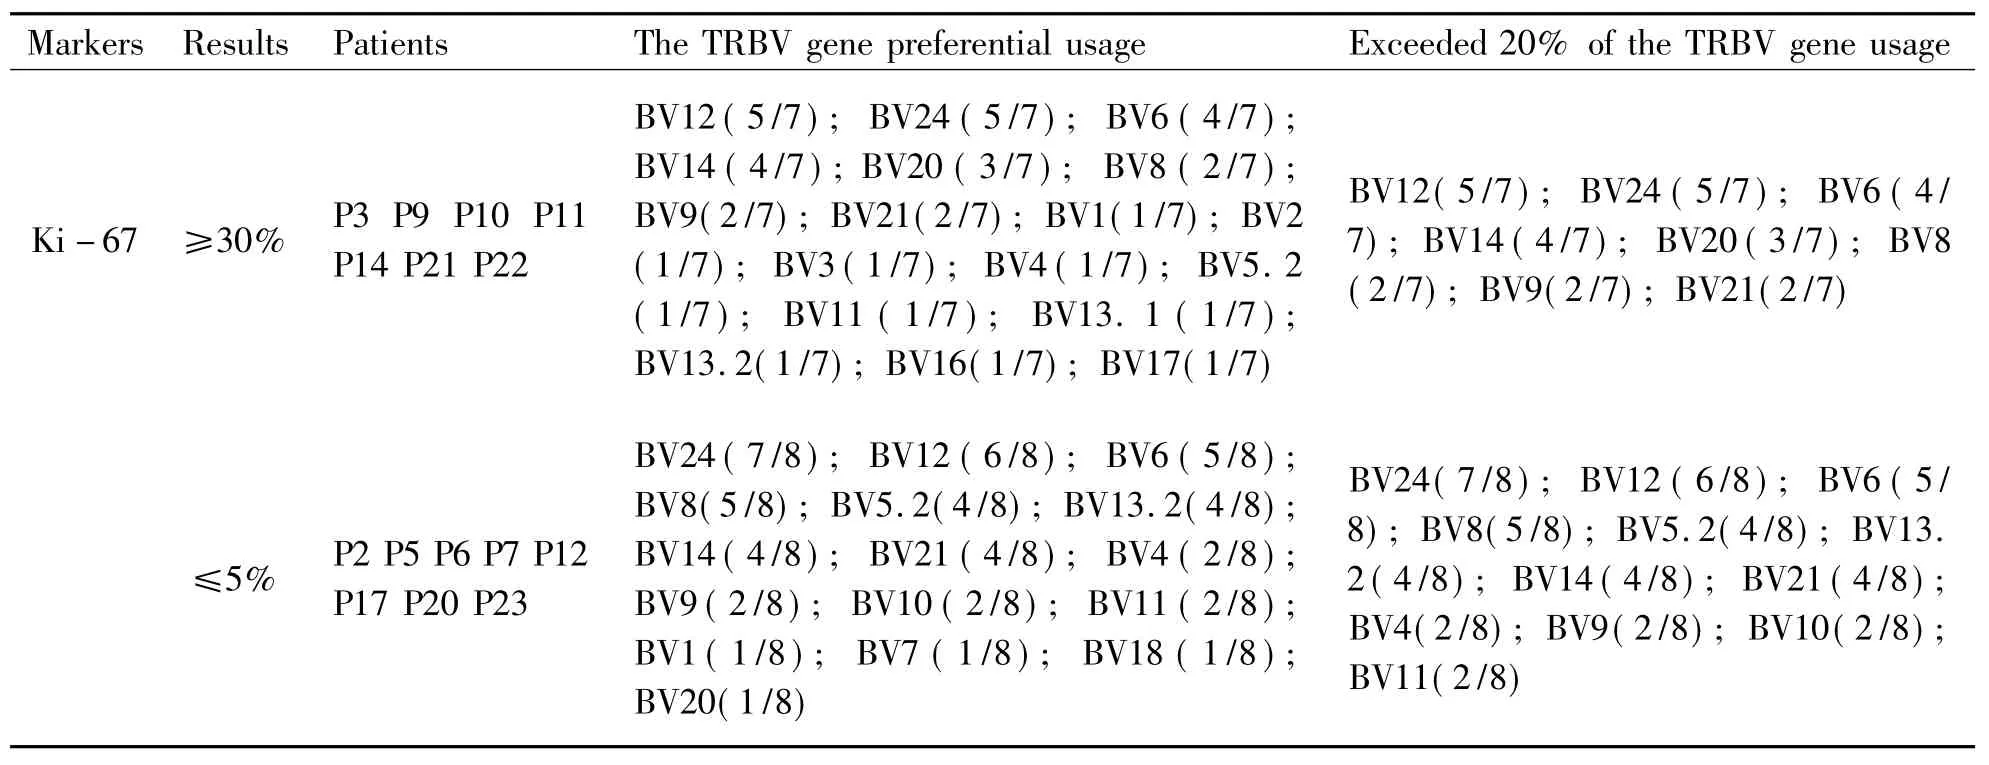
2.3The correlation between patients with positive or negative tumor markers and commonTRBVgene expression.We are not sure if significant correlations exist between preferentially expressedTRBVgenes in TILs and the expression of tumor markers including ER, PR, PS2, C-erbB-2, nm23, P53 and Ki-67. However, some of theTRBVgene preferential expression frequencies exceeded 20% in patients who expressed some tumor markers. For instance, 83% (5/6) of patients who had high expression levels of ER also had high expression levels ofTRBV13.2 andTRBV24 (Table 2).
Tab 1The preferential expression of TRBV CDR3 family genes in the PBMCs and tumor tissue of 23 patients with infiltrating ductal breast carcinoma

PatientsTRBVgenepreferentialusageofPB-MCsTRBVgenepreferentialusageofTILsCo-preferentialusageP1BV9;BV11;BV13.2BV9;BV11;BV13.2;BV19;BV24BV9;BV11;BV13.2P2BV1;BV9;BV11;BV13.2;BV24BV6;BV12;BV13.2;BV24BV13.2;BV24P3BV4;BV12;BV20;BV24BV1;BV9;BV11;BV13.2;BV24BV24P4BV5.2;BV6;BV8;BV10;BV12;BV14;BV24BV6;BV8;BV9;BV12;BV13.1;BV13.2;BV14;BV21;BV24BV6;BV8;BV12;BV14;BV24P5BV5.2;BV6;BV7;BV8;BV12;BV13.2;BV20;BV21;BV24BV5.2;BV6;BV7;BV8;BV12;BV21;BV24BV5.2;BV6;BV7;BV8;BV12;BV21;BV24P6BV6;BV8;BV12;BV14;BV18;BV21;BV24BV6;BV8;BV12;BV13.2;BV14;BV21;BV24BV6;BV8;BV12;BV14;BV21;BV24P7BV4;BV5.2;BV6;BV8;BV10;BV12;BV13.2;BV14;BV21;BV24BV6;BV8;BV12;BV13.2;BV14;BV21;BV24BV6;BV8;BV12;BV13.2;BV14;BV21;BV24P8BV6;BV8;BV10;BV14;BV24BV6;BV7;BV14;BV24BV6;BV14;BV24P9BV8;BV13.1;BV14;BV16;BV21;BV24BV6;BV8;BV12;BV24BV8;BV24P10BV1;BV6;BV9;BV11;BV13.2;BV14;BV20;BV24BV1;BV6;BV9;BV11;BV13.2;BV20;BV24BV11;BV13.2;BV24P11BV6;BV8;BV12;BV14;BV24BV6;BV8;BV10;BV12;BV14;BV24BV6;BV8;BV12;BV14;BV24P12BV6;BV8;BV12;BV14;BV21;BV24BV6;BV12;BV14;BV21;BV24BV6;BV12;BV14;BV21;BV24P13BV3;BV6;BV8;BV9;BV14;BV24BV6;BV8;BV12;BV13.2;BV14BV6;BV8;BV14P14BV2;BV6;BV12;BV14;BV21;BV24BV6;BV14;BV21;BV24BV6;BV14;BV21;BV24P15BV6;BV8;BV12;BV13.2;BV14;BV18;BV21;BV24BV8;BV12;BV13.2;BV14;BV24BV8;BV12;BV13.2;BV14;BV24P16BV6;BV8;BV12;BV14;BV21;BV24BV6;BV12;BV14;BV21;BV24BV6;BV12;BV14;BV21;BV24P17BV4;BV5.2;BV6;BV8;BV12;BV14;BV24BV6;BV12;BV14BV6;BV12,BV14P18BV5.2;BV15BV18NoneP19BV17;BV22BV5.2;BV7;BV12NoneP20BV5.2;BV10;BV12BV5.2;BV21BV5.2P21BV3;BV6;BV9;BV12BV5.2;BV7;BV8;BV12BV12P22BV5.2;BV12;BV17;BV20BV9;BV13.2NoneP23BV9;BV11;BV13.2;BV24BV3;BV9;BV11;BV13.2;BV14;BV24BV9;BV11;BV13.2;BV24

Fig 3 The frequency of the preferential expression of TRBV CDR3 families in 23 patients with infiltrating ductal breast carcinoma
Tab 2The TRBV gene preferential usage in TILs in patients positive or negative for tumor markers ER, PR, C-erbB-2, P53 and Ki-67

MarkersResultsPatientsTheTRBVgenepreferentialusageExceeded20%oftheTRBVgeneus-ageER+++P1P2P4P6P20P23BV13.2(5/6);BV24(5/6);BV6(3/6);BV9(3/6);BV12(3/6);BV14(3/6);BV21(3/6);BV8(2/6);BV11(2/6);BV3(1/6);BV5.2(1/6);BV13.2(1/6);BV19(1/6)BV13.2(5/6);BV24(5/6);BV6(3/6);BV9(3/6);BV12(3/6);BV14(3/6);BV21(3/6);BV8(2/6);BV11(2/6);-P3P5P13P15P16P21BV12(5/6);BV8(4/6);BV24(4/6);BV6(3/6);BV13.2(3/6);BV14(3/6);BV5.2(2/6);BV7(2/6);BV21(2/6);BV1(1/6);BV9(1/6);BV11(1/6)BV12(5/6);BV8(4/6);BV24(4/6);BV6(3/6);BV13.2(3/6);BV14(3/6);BV5.2(2/6);BV7(2/6);BV21(2/6);PR≥+P2P6P7P8P10P11P12P13P14P19P21P22P23BV6(9/13);BV24(9/13);BV12(8/13);BV14(8/13);BV13.2(7/13);BV8(5/13);BV21(4/13);BV7(3/13);BV9(3/13);BV5.2(2/13);BV11(2/13);BV1(1/13);BV3(1/13);BV10(1/13);BV20(1/13)BV6(9/13);BV24(9/13);BV12(8/13);BV14(8/13);BV13.2(7/13);BV8(5/13);BV21(4/13);BV7(3/13);BV9(3/13);-P1P3P4P5P9P15P16P17P18P20BV24(7/10);BV12(6/10);BV6(5/10);BV8(4/10);BV13.2(4/10);BV14(4/10);BV21(4/10);BV9(3/10);BV5.2(2/10);BV11(2/10);BV1(1/10);BV7(1/10);BV13.1(1/10);BV18(1/10);BV19(1/10)BV24(7/10);BV12(6/10);BV6(5/10);BV8(4/10);BV13.2(4/10);BV14(4/10);BV21(4/10);BV9(3/10);BV5.2(2/10);BV11(2/10);C-erbB-2≥+P3P7P8P9P10P12P14P15P18P20P21P22P23BV24(9/13);BV12(8/13);BV6(7/13);BV14(7/13);BV8(5/13);BV21(5/13);BV5.2(4/13);BV13.2(4/13);BV9(3/13);BV10(3/13);BV20(3/13);BV4(2/13);BV11(2/13);BV1(1/13);BV2(1/13);BV3(1/13);BV13.1(1/13);BV15(1/13);BV16(1/13);BV17(1/13);BV18(1/13)BV24(9/13);BV12(8/13);BV6(7/13);BV14(7/13);BV8(5/13);BV21(5/13);BV5.2(4/13);BV13.2(4/13);BV9(3/13);BV10(3/13);BV20(3/13)-P1P2P4P5P6P11P13P16P17P19BV24(8/10);BV6(7/10);BV8(7/10);BV12(6/10);BV14(6/10);BV5.2(3/10);BV9(3/10);BV13.2(3/10);BV21(3/10);BV11(2/10);BV1(1/10);BV3(1/10);BV4(1/10);BV7(1/10);BV10(1/10);BV17(1/10);BV18(1/10);BV20(1/10);BV22(1/10)BV24(8/10);BV6(7/10);BV8(7/10);BV12(6/10);BV14(6/10);BV5.2(3/10);BV9(3/10);BV13.2(3/10);BV21(3/10);BV11(2/10)P53≥+P3P8P10P11P12P19P20P21BV6(5/8);BV12(5/8);BV24(5/8);BV14(4/8);BV8(3/8);BV9(2/8);BV10(2/8);BV20(2/8);BV1(1/8);BV3(1/8);BV4(1/8);BV5.2(1/8);BV11(1/8);BV13.2(1/8);BV17(1/8);BV21(1/8);BV22(1/8)BV6(5/8);BV12(5/8);BV24(5/8);BV14(4/8);BV8(3/8);BV9(2/8);BV10(2/8);BV20(2/8)
Continue table

MarkersResultsPatientsTheTRBVgenepreferentialusageExceeded20%oftheTRBVgeneus-ageKi-67≥30%P3P9P10P11P14P21P22BV12(5/7);BV24(5/7);BV6(4/7);BV14(4/7);BV20(3/7);BV8(2/7);BV9(2/7);BV21(2/7);BV1(1/7);BV2(1/7);BV3(1/7);BV4(1/7);BV5.2(1/7);BV11(1/7);BV13.1(1/7);BV13.2(1/7);BV16(1/7);BV17(1/7)BV12(5/7);BV24(5/7);BV6(4/7);BV14(4/7);BV20(3/7);BV8(2/7);BV9(2/7);BV21(2/7)≤5%P2P5P6P7P12P17P20P23BV24(7/8);BV12(6/8);BV6(5/8);BV8(5/8);BV5.2(4/8);BV13.2(4/8);BV14(4/8);BV21(4/8);BV4(2/8);BV9(2/8);BV10(2/8);BV11(2/8);BV1(1/8);BV7(1/8);BV18(1/8);BV20(1/8)BV24(7/8);BV12(6/8);BV6(5/8);BV8(5/8);BV5.2(4/8);BV13.2(4/8);BV14(4/8);BV21(4/8);BV4(2/8);BV9(2/8);BV10(2/8);BV11(2/8)
3Discussion
TCR CDR3 is a special region of the T cell and is involved in peptide recognition. Specific recognition of a peptide on a certain T cell can induce clonal expansion of T cells that express a particular TCR V gene product. Preferential expression of the TCR V gene represents an antigen-driven immune response[18-19].Analysis of the cloning proliferation characteristics of theTRBVgene in breast cancer patients with a DNA melting curve technique can be used to understand clonal characteristics of a specific T cell at the gene level and can determine clonal proliferation of T cells with specificTRBVfamilies from a large number of clinical samples. If a correlation can be confirmed between the molecular characteristics of TCR monoclonal proliferation and a tumor-associated antigen, it would help researchers to find a new immunotherapy method for cancer diseases.
In this study, we determinedTRBVgene expression in PBMCs and in TILs from patients with IDCA tumors by a FQ-PCR technique. We found that one or moreTRBVfamilies were preferentially expressed in each patient; however, each of the patients exhibited differentTRBVprofiles (Table 1). In individual patients,TRBVgene expression generally differed in PBMCs and TILs.
Kirii et al. reported that there were some predominant TCR V beta families on specific cytotoxic T cells in the pancreas of breast cancer patients, such as TCR V beta 9 (TRBV9), V beta13.1 (TRBV13.1), and V beta17 (TRBV17)[20]. Ito et al. found that only one predominant TCR V beta 18 family (TRBV18) was predominantly expressed in the CD8+T cell subset of the lymph nodes of breast cancer patients, but PBMCs and lymph nodes expressed dominant CD8+T cell clones in different TCR V beta families for the most breast cancer patients, and the number of dominant clones is lower in the lymph nodes than in PBMCs[21].
We did not find a significant difference in the number ofTRBVgenes preferentially expressed between PBMCs (total of 127 preferentially expressedTRBVgenes) and TILs (total of 110 preferentially expressedTRBVgenes) in 23 patients with IDCA tumors (Table 1). In the PBMCs of these patients,TRBV6,TRBV8,TRBV12,TRBV14 andTRBV24 were the most commonly expressedTRBVgenes. In the TILs,TRBV6,TRBV12,TRBV14 andTRBV24 were detected most frequently (Fig 3). Furthermore, 87% (20/23) of the breast cancer patients had the same preferentially expressedTRBVgenes in PBMCs and in TILs, and the most highly expressed wasTRBV24 (Table 1).
Preferentially expressedTRBVgenes, determined from the melting curve spectratyping results, caused mono/oligo clonal T cell growth. The three possible sources for these T cells are as follows. (1) As TCR rearrangement is uncommon in early T cell development and differentiation, the preferential clone may be caused by chromosome ectopia or oncogene activation, which can produce these tumor T cells. (2) Viruses and other factors may induce individual T cells from the normal T lymphocyte library to turn into neoplastic hyperplasia, which is unable to be controlled by the immune system. These are known as tumor T cells. (3) In pathological conditions, peripheral T cells may cause secondary TCR rearrangement, and TCR clonal proliferation is produced by aberrant editing and revision. These are tumor T cells or response T cells.
We detected the expression of tumor markers including ER, PR, PS2, C-erbB-2, nm23, P53and Ki-67 in all 23 patients. We did not find a significant correlation betweenTRBVgene expression and tumor marker expression, but certain frequencies exceeded 20% (Table 2).
There might be some relationships between the common preferentially expressedTRBVgenes and the presence of a certain tumor-associated antigen (TAA). Zhang et al. detected T cell clonal proliferation in patients of rectal cancer and found some corresponding anti-tumor T lymphocytes[22]. In some tumors patients, monoclonal proliferative T lymphocytes activated with tumor antigen were transferred into PBMCs[23]. Others reported that TAAs in the blood circulation caused minimal residual disease and tumor metastasis and could continuously stimulate peripheral blood T lymphocytes[24].
This study lays the foundation for TCR CDR3 spectratyping for breast cancer. Therefore, the next experimental scheme is as follows: separate T cells that have aTRBVsingle-peak family (cell separation using antibodies of anti-humanTRBVfamilies with FCM); next, perform single cell PCR andTRAV/TRBVgene sequencing, and see how the α β chain pairs; prepare tetramers according to the major antigens of breast cancer (simulating the most likely T cell antigenic peptide according to the HLA of breast cancer patients); sort T cells of corresponding patients with FCM, and at the same time measureTRAV/TRBVbias, obtainTRAV/TRBVgene preferential expression using the same single-cell PCR, and compare the results; and finally search for tumor antigen T cells with a specific response.
Whether the preferential families we identified are breast cancer-specific must be further affirmed. This type of gene expression analysis in serum and tumor tissue from patients may provide guidance for individualized T cell-directed therapy for breast cancer.
[References]
[1] Arstila T P, Casrouge A, Baron V, et al. A direct estimate of the human αβ T cell receptor diversity[J]. Science, 1999, 286(5441): 958-961.
[2] Casrouge A, Beaudoing E, Dalle S, et al. Size estimate of the αβ TCR repertoire of naive mouse splenocytes[J]. J Immunol, 2000, 164(11): 5782-5787.
[3] Yao X S, Diao Y, Sun W B, et al. Analysis of the CDR3 length repertoire and the diversity of TCR α chain in human peripheral blood T lymphocytes[J].Cell Mol Immunol, 2007, 4(3): 215-220.
[4] Lim A, Baron V, Ferradini L, et al. Combination of MHC-peptide multimer-based T cell sorting with the immunoscope permits sensitive ex vivo quantitation an follow-up of human CD8+T cell immune responses[J]. J Immunol Methods, 2002, 261(1-2): 177-194.
[5] Kjer-Nielsen L, Clements C S, Purcell A W, et al. A structural basis for the selection of dominant αβ T cell receptors in antiviral immunity[J]. Immunity, 2003, 18(1): 53-64.
[6] Stewart-Jones G B, McMichael A J, Bell J I, et al. A structural basis for immunodominant human T cell receptor recognition[J].Nat Immunol, 2003, 4(7): 657-663.
[7] Duncan S R, Elias D J, Roglic M, et al. T-cell receptor biases and clonal proliferations in blood and pleural effusions of patients with lung cancer[J]. Hum Immunol, 1997,53(1): 39-48.
[8] Mami-Chouaib F, Echchakir H, Dorothée G, et al. Antitumor cytotoxic T-lymphocyte response in human lung carcinoma: identification of a tumor-associated antigen[J]. Immunol Rev, 2002, 188(1): 114-121.
[9] Ikeda H, Sato N, Matsuura A, et al. Analysis of T-cell receptor V region gene usage of cytotoxic T-lymphocytes and tumor-infiltrating lymphocytes derived from human autologous gastric signet ring cell carcinomas[J]. Cancer Res, 1993, 53(13): 3078-3084.
[10]Yamamoto K, Masuko K, Takahashi S, et al. Accumulation of distinct T cell clonotypes in human solid tumors[J]. J Immunol, 1995, 154(4): 1804-1809.
[11]Diederichsen A C, Zeuthen J, Christensen P B, et al. Characterisation of tumour infiltrating lymphocytes and correlations with immunological surface molecules in colorectal cancer[J]. Eur J Cancer, 1999, 35(5): 721-726.
[12]Zhou J, Ma R, Luo R, et al. Primary exploration of CDR3 spectratyping and molecular features of TCR β chain in the peripheral blood and tissue of patients with colorectal carcinoma[J]. Cancer Epidemiol, 2010, 34(6): 733-740.
[13]He X Y, Yang W M, Tang W T, et al. TRAV gene expression in PBMCs and TILs in patients with breast cancer analyzed by a DNA melting curve (FQ-PCR) technique for TCR alpha chain CDR3 spectratyping[J]. Neoplasma, 2012, 59(6): 693-699.
[14]Yao X S, Xie Z J, Ma L, et al. Analysis of the CDR3 region of alpha/beta T-cell receptors (TCRs) and TCR BD gene double-stranded recombination signal sequence breaks end in peripheral blood mononuclear cells of T-lineage acute lymphoblastic leukemia[J]. Clin Lab Haematol, 2006, 28(6): 405-415.
[15]Han M, Harrison L, Kehn P, et al. Invariant or highly conserved TCR alpha are expressed on double-negative (CD3+CD4-CD8-) and CD8+ T cells[J]. J Immunol, 1999, 163(1): 301-311.
[16]Yang J Z, Li M W, Wang J G, et al. Rapid detection of clonal expansion of T-cell receptor-beta gene in patients with HBV using the real-time PCR with DNA melting curve analysis[J]. Hepatol Res, 2010, 40(4): 407-414.
[17]Zhou J W, Ma R, Tang W T, et al. Primary exploration of molecular and spectratyping features of CDR3 of TCR α chain in the peripheral blood and tissue of patients with colorectal carcinoma[J].Acta Medica Mediterranea, 2011, 27: 23-30.
[18]Halapi E, Jeddi-Tehrani M, Osterborg A, et al. T cell receptor usage in malignant diseases[J]. Springer Semin Immunopathol, 1999, 21(1):19-35.
[19]Pannetier C, Cochet M, Darche S, et al. The sizes of the CDR3 hypervariable regions of the murine T-cell receptor beta chains vary as a function of the recombined germ-line segments[J]. Proc Natl Acad Sci USA, 1993, 90(9): 4319-4323.
[20]Kirii Y, Magarian-Blander J, Alter M D, et al. Functional and molecular analysis of T cell receptors used by pancreatic and breast tumor (mucin) specific cytotoxic T cells[J]. J Immunother, 1998, 21(3): 188-197.
[21]Ito K, Fetten J, Khalili H, et al. Oligoclonality of CD8+ T cells in breast cancer patients[J]. Mol Med, 1997, 3(12): 836-851.
[22]Zhang X Y, Chan W Y, Whitney B M, et al. T cell receptor Vβ repertoire expression reflects gastric carcinoma progression[J]. Clin Immunol,2001,101(1):3-7.
[23]Li Y Q, Yang L J, Chen S H, et al. T cell receptor V beta repertoire usage and clonal expansion of T cells in chronic myelogenous leukemia[J]. Chin Med J, 2004, 117(6): 840-843.
[24]Gaudin C, Dietrich P Y, Robache S, et al. In vivo local expansion of clonal T cell subpopulations in renal cell carcinoma[J]. Cancer Res, 1995, 55(3): 685-690.
[收稿2015-11-30;修回2015-12-30]
(编辑:王福军)
TRBV gene expression in PBMCs and TILs in patients with infiltrating ductal breast carcinomas analyzed by a DNA melting curve (FQ-PCR) technique using TCR beta chain CDR3 spectratyping
HeXiaoyan1,SunSuhong2,YangWeiming2,TangWentai3,MaRui1,ZhangTian1,YaoXinsheng1
(1.Department of Immunology, Research Center for Medicine & Biology and Innovation & Practice Base for Graduate Students Education, Zunyi Medical University, Zunyi Guizhou 563099, China;2.Department of Breast Surgery, The Affiliated Hospital of Zunyi Medical University, Zunyi Guizhou 563099, China;3.Department of Pathology, The Affiliated Hospital of Zunyi Medical University, Zunyi Guizhou 563099, China)
[Abstract]Objective To probe TRBV gene expression in peripheral blood mononuclear cells (PBMCs) and in tumor- infiltrating lymphocytes (TILs) in patients with infiltrating ductal breast carcinomas (IDCAs) using T cell receptor (TCR) beta chain complementarity-determining region 3(CDR3) spectratyping with a DNA melting curve and fluorogenic quantitative polymerase chain reaction (FQ-PCR) technique. Methods Peripheral blood and tissue samples were obtained from 23 patients with IDCA tumors. Total RNA was extracted from PBMCs and tumor tissues and then reverse transcribed into cDNA. FQ-PCR was used to amplify the human TCR beta chain CDR3 region with primers for TRBV and TRBC genes. Results TCR beta CDR3 spectratyping showed preferential expression of some TRBV genes in the PBMCs and TILs of all 23 patients with IDCA tumors. TRBV6, TRBV8, TRBV12, TRBV14, and TRBV24 were expressed in greater than 50% of PBMCs; and TRBV6, TRBV12, TRBV14and TRBV24 were expressed in greater than 50% of TILs. More than 80% of the patients (20/23) overexpressed the same genes in both PBMCs and TILs. Patients with positive or negative tumor markers of estrogen receptor (ER), progesterone receptor (PR), PS2, C-erbB-2, nm23, P53and Ki-67 had no significant common TRBV gene expression. Conclusion TRBV gene expression is complex and diverse in patients with IDCA tumors. TRBV gene expression may be attributable to the diversity of breast tumor antigens and the different immune responses observed in individual patients. Exploring the immunological mechanism of T cells may provide a basis for individual T cell-directed therapy for breast cancer.
[Key words]infiltrating ductal breast carcinomas; TRBV gene; TCR CDR3 spectratyping; DNA melting curve; FQ-PCR
[中图法分类号]R392
[文献标志码]A
[文章编号]1000-2715(2016)01-0035-09
[通信作者]姚新生,男,博士,教授,研究方向:T/B细胞CDR3受体组库的基础和应用,E-mail:immunology01@126.com。
[基金项目]国家自然科学基金资助项目(NO:81441048);贵州省科技厅基金资助项目(NO:2008-700105.2007-2122)。

