基于单台初至P波快速测定震级方法及应用
基于单台初至P波快速测定震级方法及应用
苗庆杰1,2, 刘希强2, 崔鑫2
(1.中国科学技术大学,安徽 合肥230026; 2.山东省地震局,山东 济南250014)
摘要:通过函数形式Bt·exp(-At)来拟合单台初至P波前2 s时间窗内数据的包络线,采用最小二乘法求出参数A和B,并提出三种绘制波形包络线的方法。应用实际地震记录对三种方法进行比较分析,得出一种绘制包络线的最优方法,改进利用波形包络求取震级的方法。利用山东数字化地震台网小于100 km的垂直向记录,经过处理和统计,得到震级与包络参数B、P波前2 s最大速度值之间的统计关系,内检结果表明与实际震级的偏差较小,为0.36;lgB和震中距Δ存在较好的线性关系,与震级大小无关。因此,可以由P波触发后2 s时间窗内最大振幅和参数B通过经验公式来快速估算地震震级,有效增加预警时间,大大缩小预警盲区。
关键词:单台; 地震预警; 震级估算; 包络线; 幅值
收稿日期:*2014-06-10
基金项目:国家支撑计划课题(2012BAKB04);中国地震局台网骨干专项(20130211);山东省地震局重点基金项目(编号:JJ1407Y)
作者简介:苗庆杰(1980-),男,山东定陶人,研究生,工程师,主要从事地震波分析处理与应用方面的研究工作.E-mail:qjmiao@163.com
中图分类号:P315.63文献标志码:A
DOI:10.3969/j.issn.1000-0844.2015.01.0248
Rapid Determination Method for Magnitude Based on First-arrival
P Wave Recorded at the Single Station and its Application
MIAO Qing-jie1,2, LIU Xi-qiang2, CUI Xin2
(1.UniversityofScienceandTechnologyofChina,Hefei,Anhui230026,China;
2.EarthquakeAdministrationofShandongProvince,Jinan,Shandong250014,China)
Abstract:As an effective means of reducing casualties and economic losses, earthquake early warning systems have received considerable attention and many have been implemented around the world.A complete earthquake early warning system includes the identification of the earthquake location,estimation of its magnitude,estimation of its intensity at a target zone,and the dissemination of relevant information.The rapid determination of the earthquake magnitude is the most important part of such a system,after determining the location of the earthquake,because its accuracy affects predictions of ground motion of a target area and has influence on the issuance of warnings.An earthquake early warning system should provide the longest emergency response time possible.Full use must be made of the limited information from seismic stations nearest to the epicenter when calculating the earthquake magnitude,using special algorithms to extract the parameters that can better reflect the characteristics of earthquake magnitude from few data.Therefore,it is necessary to develop some method to calculate earthquake magnitude that is non-traditional, stable,and reliable.In this study,we used a simple function of the form Bt·exp(-At) and determined A and B in terms of the least-squares method by fitting this function with a 2-s time window of the first-arrival P waveform envelope.We proposed three methods for drawing waveform envelopes,which we then compared and analyzed using actual seismic records.An optimal method of drawing the envelopes was achieved,improving the method using the waveform envelope to obtain the magnitude.Based on 225 vertical recordings from the sensors of the Shandong Seismic Network,whose distances of separation are <100 km and that have an SNR ≥ 3 after processing and statistics,we obtained a statistical relationship with magnitude,envelope parameter B,and the maximum speed for the 2-s time window of the first-arrival P waveform.An inspection of the results shows that the difference between this and the actual magnitude is small (0.36).According to a computational analysis of the Shandong Seismic Network data,we found a good linear relationship between lgB and epicentral distance Δ, regardless of the magnitude.Therefore,we can quickly estimate the magnitude of an earthquake using empirical formulas with the maximum amplitude of the 2-s P waveform and parameter B,effectively increasing the warning time and greatly reducing the warning blind spot.The fitting formula used to estimate the magnitude in this study has lower error and higher accuracy compared with the existing empirical formula when estimating earthquake magnitude in the Shandong region.However, because of the lack of seismic data for earthquakes >M5,the inversion formula has some limitations, and in addition,parameter B has strong regional characteristics.This study is based on the Rushan earthquake in the Shandong region,for which the statistical relationship between magnitude, envelope parameter B,and the maximum speed for the 2-s time window of the first-arrival P waveform was based.Therefore,the empirical relationship could be applied to the Jiaodong Peninsula that has similar geological structural characteristics.When an earthquake next occurs in the Jiaodong Peninsula,we will be able to obtain parameter B quickly using the data for the 2-s time window of the first-arrival P waveform at the station nearest to the epicenter.From this,it will be possible to estimate the earthquake magnitude simply and quickly,and effectively increase the warning time,which will greatly reduce the warning blind spot.
Key words: single station;earthquake early warning;magnitude estimation; envelope curve; amplitude
0引言
在地震防灾中快速启动紧急求援和危机管理中快速获取灾害信息方面,地震预警系统的作用日益凸显,目前世界上许多国家和地区都已经建立或正在建立地震预警系统[1]。一个完整的地震预警系统包括地震预警定位、地震震级的估算、预警目标区烈度的估计和预警信息发布等几个部分,其中震级估算是地震预警中一个基本问题,也是地震预警系统中最重要、最困难的一部分,在确定地震位置后,震级测定结果的准确度对后续目标地区的地震动估计与警报发布具有极其重要的影响。地震预警系统应该提供尽可能长的应急反应时间,这就意味着对信息有高度的时效性要求,计算震级时必须充分合理利用离震中最近地震台站的十分有限的信息,采用一些特殊的算法从这些信息中提取能够较好反映地震震级特征的参数。
目前国内外预警震级的测定有很多种方法,其所采用的相关参数也不尽相同,但方法都是基于下面两个基本结论:其一是初始破裂的形态可以预测地震的最终规模;其二是P波携带着地震本身的信息,S波则携带地震能量的信息。
虽然对于测定预警震级的两个基本结论的争论仍在继续,到目前为止还没有一个权威的结论,但是从近几年发表的一系列相关研究来看,由初始破裂信息估算地震的大小是可行的。通过采用一些特殊的、稳定的计算方法是可以得到比较满意的地震震级估计结果,如τPMax方法[2-6]、τc方法[7-13]、ML10方法[14]、Pd方法[5-9,15-17]等。
1快速测定震级的方法
本文的震级计算方法采用Odaka于2003年提出的波形包络算法[18],并对以往绘制包络线的方法进行改进,用f(t)=Bt·exp(-At)的函数形式对垂向速度记录P波前2 s的波形包络进行拟合,用B值代表P波到来后地震动幅值的增长率,通过大量的地震数据统计分析得到B值和速度峰值与震级的相关关系。当P波到达后,能够在给定的很短时间内,通过完全经验震级关系,快速从观测到的最大振幅和作为参数的B值估算出震级。
1.1三种绘制包络线的方法
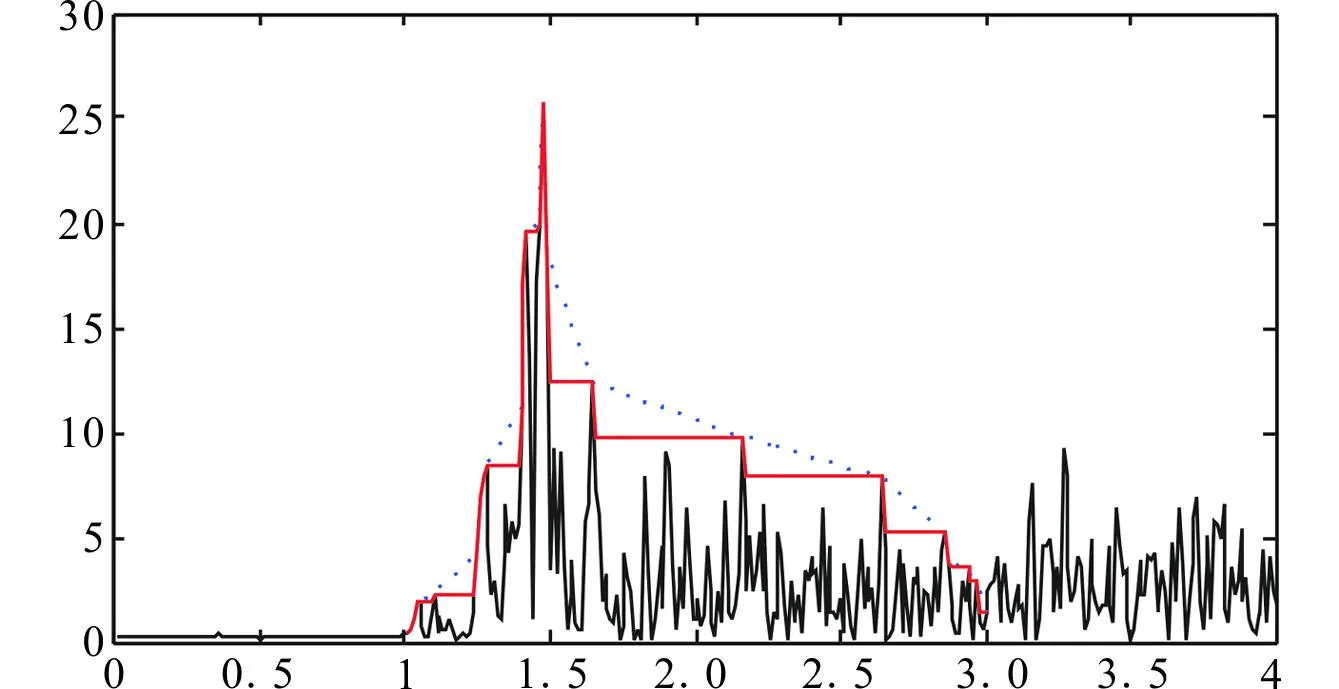
首先提出了三种绘制包络线的方法(图1)。

图1 三种方法绘制的地震记录P波前2 s的包络线 Fig.1 The envelopes in the first 2 seconds of P-wave arrival drawed by the three methods
方法①(红色折线)的包络线绘制方法如下:
首先对原始垂直向速度进行适当地处理和变换。对原速度记录做零线调整,并对调整后的结果取绝对值;其次,将P波到达后2 s内样点的y坐标值排成一个行向量,D=[d1,d2,d3,…,d200],然后再把这2s时间段所对应的包络线上的数据点的y坐标排成另外一个行向量,M=[m1,m2,m3,…,m200],于是包络线上的第一个数据点的值m1=d1,对于第二个数据点,如果d2≥d1,那么m2=d2,如果d2=d1,那么m2=m1,可以根据包络线的定义推导出包络线上的数据点的通项公式:M(i)=max(d1,d2,……,di);
方法②(蓝色折线)的包络线绘制方法是在方法①绘制的包络线的基础上依次连接相邻极值点,包络线的数据点为极值点;
方法③(蓝色折线)的包络线绘制方法是对方法②绘制的包络线进行线性插值后得到的。
1.2信号仿真检验
为了检验用于本研究所编写的程序方法的正确性,故在研究开始之前先进行信号仿真检验,先给渐变模型函数f(t)=Bt·exp(-At)中的B和A赋值,比如B=42,A=4(图2),然后再用所写的程序进行反演图示2中的曲线,得出B和A的值(图3),比较两者的B和A值是否与事先赋予的值一致,如果一致,就说明所编写的程序是正确的。
从图2和图3可以看出,通过程序反演计算出的B和A值与事先赋予的值一致,误差为0,说明本程序没有问题。

图2 模型函数当B=42,A=4时所显示的图示 Fig.2 Model function(B=42,A=4)

图3 反演图2中的曲线,求得B和A值 Fig.3 Obtaining values of B and A by inverting the curve in Fig.2
1.3对三种包络线拟合分析及比较
图4为分别使用渐变模型函数f(t)=Bt·exp(-At)对地震记录HAY201312091338.00U的三种包络线进行拟合的计算结果。
为了验证使用哪种方法所绘制的包络线进行拟合计算出的震级精度更高,选取17个ML≥2.5,信噪比大于3,垂向记录数为92条的乳山地震进行计算检验,见表1。分别对每条垂向记录的三种类型的包络线使用f(t)=Bt·exp(-At)的函数形式进行拟合,计算选定记录的B值、速度峰值,对这些记录的B值、速度峰值和它们的震级做线性回归,求出回归方程,然后反演出地震震级, 并统计震级偏差情况。
对这些地震事件里的垂直向的记录,分别使用上面介绍的三种方法绘制P波前2s的包络线并进行拟合计算相关参数,并对相关参数做线性回归,分别得到估算震级方程为:
拟合方法①绘制的包络线得到a=0.943,b=-0.348,c=2.768,预警震级估计公式为:
拟合方法②绘制的包络线得到a=1.525,b=-0.815,c=3.155,预警震级估计公式为:
表 1验证三种包络线的方法所选用的乳山地震资料
Table1The data of Rushan earthquake chosed to verify the methods of drawing three envelopes

编号发震时间纬度/(°)经度/(°)震级/ML12013-10-11T0.6∶36∶01.5536.842121.6862.722013-10-17T02∶36∶10.0736.836121.6962.632013-10-17T03∶55∶46.1036.827121.6882.942013-10-24T0.8∶01∶45.0736.850121.6842.652013-11-07T0.7∶01∶25.6036.842121.6892.562013-11-17T20∶18∶49.2636.849121.6792.572013-12-09T13∶38∶03.8736.830121.6803.282014-01-04T23∶31∶02.9036.834121.6892.692014-01-07T22∶24∶06.6036.820121.6704.7102014-01-08T0.1∶46∶30.5536.841121.6942.5112014-01-05T0.2∶39∶02.1436.836121.6962.6122014-01-08T19∶27∶20.2636.838121.6382.5132014-01-09T16∶54∶30.6536.829121.6813.5142014-01-10T19∶45∶30.4736.842121.6982.8152013-10-01T12∶07∶55.2736.828121.6963.6162013-10-05T03∶49∶11.9336.839121.6952.7172013-10-05T11∶30∶02.2236.829121.7013.2
拟合方法③绘制的包络线得到a=1.270,b=-0.656,c=2.917,预警震级估计公式为:
分别用三种震级估计公式估算出这些地震记录的震级,并计算误差。由图5可见,对按方法①绘制的包络线进行拟合,计算的震级平均偏差为0.375 3;对方法②绘制的包络线进行拟合,计算的震级平均偏差为0.346 5;对方法③绘制的包络线进行拟合,计算的震级平均偏差为0.376 6。由此可以看出,拟合采用方法②绘制的包络线计算的震级精度高于其他两种方法,故本文将按方法②进行相关研究。

图4 三种包络线拟合结果 Fig.4 Fitting results of three envelopes

图5 拟合三种方法绘制的包络线估算震级的误差分布直方图 Fig.5 Histogram of errors distribution of magnitudes estimated by the three envelopes
2资料处理及结果分析
2.1资料选取
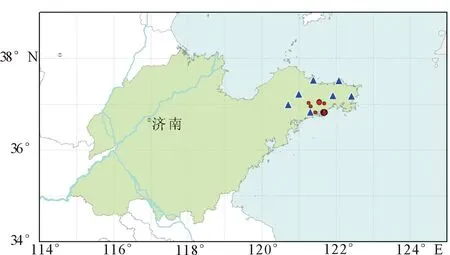
本文收集了山东数字地震台网记录到的2009年1月1日至2014年4月1日共56个ML2.0~4.7的乳山地震事件,所用地震事件的发震时刻、震级大小等详细资料如表2和图6所示。由于地震事件文件全部都是SEED格式文件,所以我们编制了转化程序把SEED格式的波形数据文件转换成ASSIC码格式的文本文件,并对地震记录进行基线校正等基本处理。
理论分析表明,利用垂向地震记录进行相关研究,震中距超过100 km时,由于折射、反射等原因,地震震相变得非常复杂,首先到达的也不是Pg震相,所以不容易提取特征参数,震级的估算也会产生较大误差。鉴于以上原因,考虑地震预警系统时效性要求高,本研究仅使用震中距在100 km内的地震台站波形记录参与统计分析,在此震中距范围内,P波成份比较简单,能够满足时效性要求,充分保证地震震级估计结果的准确性和可靠性。
选用的地震波形记录需要满足信噪比的要求,因此,本研究只选用P波触发后2 s时间内信噪比大于3的地震记录参与相关统计,根据以上地震波形记录的挑选原则,选出225条垂直向地震记录参与统计分析。

表 2 所选用的乳山地震资料

图6 震中及台站分布图 Fig.6 Distribution of epicenters and stations
2.2资料处理及结果
采用第1.3节所述的最优绘制包络线的方法对所挑选出的地震记录P波到达后前2 s的数据进行包络线的绘制,然后再用f(t)=Bt·exp(-At)形式的函数对包络线上的点进行拟合,求出系数B,即为拟合曲线在P波到时点的斜率。图7为HAY台地震记录做出的包络线和拟合曲线及计算出的相关特征参数。
对全部地震记录的特征参数做线性回归,得到a=1.699,b=-0.993,c=3.057,估算震级方程为:
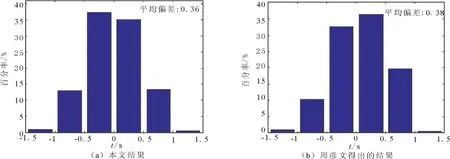
用式(4)估算出所有地震记录的震级,并计算偏差(图8(a)),其平均偏差为0.36。
2.3lgB与lgΔ的关系
有学者[19-21]对大量的地震数据记录研究分析后得到震中距lgΔ与lgB成线性负相关的关系,与震级的大小无关。因此可以通过计算P波初至阶段振幅的增长率B来估算出震中距。本文拟用山东省数字化地震台网记录到的ML≥2以上震中距在100 km以内的垂直向P波记录数据来反演A和B值,并分析检验lgB与lgΔ存在何种关系。
通过对收集到的225个样本进行计算分析(图9),发现lgB与震中距Δ存在近似线性关系,这个关系不受震级的影响,因此,可以把lgΔ换成lgB,地震震级可以由P波触发后2 s时间窗内振幅绝对值的最大值和参数B通过下面的经验公式来进行确定:
M=algPmax+blgB+c
公式中的a、b、c是可以通过最小二乘法确定的常数。
2.4与相关研究结果对比
周彦文[22]使用该方法利用山东台网2000年1月至2007年5月记录到的ML≥2以上41个数据拟合得出计算震级的反演公式
用经验公式(5)反演估算上述225条地震记录的震级,得出相应的误差分布,平均偏差为0.38;而本研究得出的经验公式反演上述地震记录得出的平均偏差为0.36(图8)。

图7 记录HAY201312091338.00U在P波到达后2 s内的包络线和拟合曲线及计算出的特征参数 Fig.7 The envelope and its fitting curve in 2 s after the arrival of P-wave and the calculated characteristic parameters at the record of HAY201312091338.00U

图8 拟合震级误差分布直方图 Fig.8 Histogram of errors distribution of the fitted magnitudes

图9 参数B与震中距Δ的经验关系 Fig.9 The relationship between B and Δ
3结论
(1) 提出了绘制波形包络线的三种方法,利用实际地震数据统计分析了分别以它们求取震级的误差指标,确立绘制包络线的最优方法,改进了利用波形包络求取震级的方法。
(2) 经过对山东数字化地震台网的地震数据计算分析,发现参数B值与震中距Δ具有近似线性关系,这个关系不受震级的影响,因此,地震震级可以由P波触发后2s时间窗内最大振幅和参数B快速测定。
(3) 基于山东数字化地震台网小于100km的垂向记录初至P波2s时间窗内的最大振幅和参数B值,经过处理和统计,得到了震级与包络参数B、P波前2s最大速度值之间的统计关系:
Mest=1.699lgPmax-0.993lgB+3.057
依据此震级统计公式,对地震数据进行了预测,表明与实际震级的偏差较小,为0.36。
(4) 通过和山东地区已有的估算震级经验公式对比发现,本研究所得出的拟合公式反演估算出的震级误差更低,精度更高。
4讨论
由于缺乏5级以上的地震数据,震级反演公式有一定的局限性,今后在有关震例增加后,需要做进一步的分析研究。参数B具有强烈的区域性特点,本研究是以山东地区的乳山地震数据为样本进行拟合求出参数B值,然后统计回归得出震级与2 s时间窗内的振幅最大值和参数B值之间的相关关系。因此,这个经验关系适用于地质结构特性相近的胶东半岛地区的所有台站,当胶东半岛地区再次发生地震时,就可用离震中最近的地震台站记录到的P波前2 s内的数据快速求出参数B,即可估算出震级,简单快速,有效增加了预警时间,并大大缩小了预警盲区。
参考文献(References)
[1]赵冰,刘希强.全球地震早期预警研究综述[J].西北地震学报,2011,33(4):392-402.
ZHAO Bing,LIU Xi-qiang.An Overview of Earthquake Early Warning Research Around the Word[J].Northwestern Seismological Journal,2011,33(4):392-402.(in Chinese)
[2]Nakamura Y.On the Urgent Earthquake Detection and Alarm System(UrEDAS)[A]//9th World Conference on Earthquake Engineering.1988,VII(2-9):673-678.
[3]Allen R M,Kanamori H.The Potential for Earthquake Early Warning in Southern California[J].Science,2003,300:786-89.
[4]Wurman G,Allen R M,Lombard P.Toward Earthquake Early Warning in Northern California[J].Journal of Geophysical Research,2007,112:B08311.
[5]Olson E L, R M Allen.The Deterministic Nature of Earthquake Rupture[J].Nature,2005,438:212-215.
[6]Park Y,Park S C,Kim K H,et al.Magnitude Scaling Relationships from the First 3 s of P-wave Arrivals in South Korea[J].Jouarnal of Seismology,2010,14(4):761-768.
[7]Kanamori H.Real-time Seismology and Earthquake Damage Mitigation[J].Annual Review of Earth and Planetary Sciences,2005,33:195-214.
[8]Wu Y M,Kanamori H.Experiment on an Onsite Early Warning Method for the Taiwan Early Warning System[J].Bulletin of the Seismological Society of America,2005,95(1):347-353.
[9]Wu Y M,Kanamori H.Rapid Assessment of Damaging Potential of Earthquakes in Taiwan from the Beginning of P Waves[J].Bulletin of the Seismological Society of America,2005,95(3):1181-1185.
[10]Wang W T,Ni S D,Chen Y,et al.Magnitude Estimation for Early Warning Applications Using the Initial Part of P Waves:A Case Study on the 2008 Wenchuan Sequence[J].Geophysical Research Letters,2009,36:L16305.
[11]Xu Y,Wu Z L,Jiang C S,et al.Estimating the Size of an Earthquake Using Short-period Seismograms of the First Three Seconds:a Simulated Experiment Using the 1999 Chi-Chi Earthquake Sequence[J].Acta Seismologica Sinica,2008,21(2):139-147.
[12]Peng H S,Wu Z L,Wu Y M,et al.Developing a Prototype Earthquake Early Warning System in the Beijing Capital Region[J].Seismological Research Letters,2011,82(3):394-403.
[13]许川佩,梁光发,吴玉龙.一种地震预警监测传感器模块的设计及实现[J].地震工程学报,2013,35(3):604-609.
XU Chuan-pei,LIANG Guang-fa,WU Yu-long.Design and Realization of a Seismic Monitoring Sensor Module[J].China Earthquake Engineering Journal,2013, 35(3):604-609.(in Chinese)
[14]Wu Y M,T C Shin,Y B Tsai.Quick and Reliable Determination of Magnitude for Seismic Early Warning[J].Bull Seism Soc Am,1998,88:1254-1259.
[15]Wu Y M,Zhao L.Magnitude Estimation Using the First Three Seconds P-wave Amplitude in Earthquake Early Warning[J]. Geophysical Research Letters,2006,33:L16312.
[16]Zollo A,Lancieri M,Nielsen S.Earthquake Magnitude Estimation from Peak Amplitudes of Very Early Seismic Signals on Strong Motion Records[J].Geophysical Research Letters,2006,33:L23312.
[17]Zollo A,Lancieri M,Nielsen S.Reply to Comment by P.Rydelek et al. on“Earthquake Magnitude Estimation from Peak Amplitudes of Very Early Seismicsignals on Strong Motion Records”[J].Geophysical Research Letters,2007,34:L20303.
[18]Odaka T,Ashiya K,Tsukada S,et al.A New Method of Quickly Estimating Epicentral Distance and Magnitude from a Single Seismic Record[J].Bulletin of the Seismological Society of America,2003,93(1):526-532.
[19]马亮.用于地震预警的单台定位技术研究[D].哈尔滨:中国地震局工程力学研究所,2013.
MA Liang.Research on Earthquake Location Using Single Station for Earthquake Early Warning[D].Harbin:Institute of Engineering Mechanics,China Earthquake Administration,2013.(in Chinese)
[20]宋晋东.应用于高速铁路的运行控制用地震动参数及单台地震预警技术[D].哈尔滨:中国地震局工程力学研究所,2013.
SONG Jin-dong.Research on Seismic Ground Motion Indices for Operation Control and Single Station Earthquake Early Warning Applied for High-speed Railway[D].Harbin:Institute of Engineering Mechanics,China Earthquake Administration,2013.(in Chinese)
[21]宋晋东.地震预警中地震波到时自动识别和震级快速估算研究[D].哈尔滨:中国地震局工程力学研究所,2007.
SONG Jin-dong.Study on Automatic Recognition of Seismic Arriving Time and Rapid Estimation of Magnitude in Earthquake Early Warning[D].Harbin:Institute of Engineering Mechanics,China Earthquake Administration,2007.(in Chinese)
[22]周彦文.基于单台P波记录的早期地震预警方法研究[D].兰州:中国地震局兰州地震研究所,2008.
ZHOU Yan-wen.Study on the Early Warning System Method Based on A Single Station’s P Wave Record[D].Lanzhou:Lanzhou Institute of Seismology,2008. (in Chinese)
监测研究

