Liquid chromatography-tandem mass spectrometry method for the estimation of adefovir in human plasma:Application to a pharmacokinetic study
Dipanjan Goswami,Sanjay Gurule,Arainda Saha, Poonam Vats,Arshad Khuroo,Tausif Monif
aSun Pharmaceutical industries Ltd.,Plot No.GP-5,Sector-18,Gurgaon-122015,Haryana,India
bDepartment of Clinical Pharmacology and Pharmacokinetics,Ranbaxy Laboratories,Ltd.,HSIDC,GP-5,Old Delhi Gurgaon Road,Udyog Vihar Industrial Area,Gurgaon 122 015,Haryana,India
Liquid chromatography-tandem mass spectrometry method for the estimation of adefovir in human plasma:Application to a pharmacokinetic study
Dipanjan Goswamia,✽,Sanjay Guruleb,Arabinda Sahab, Poonam Vatsb,Arshad Khuroob,Tausif Monifb
aSun Pharmaceutical industries Ltd.,Plot No.GP-5,Sector-18,Gurgaon-122015,Haryana,India
bDepartment of Clinical Pharmacology and Pharmacokinetics,Ranbaxy Laboratories,Ltd.,HSIDC,GP-5,Old Delhi Gurgaon Road,Udyog Vihar Industrial Area,Gurgaon 122 015,Haryana,India
Adefovir;
Liquid chromatographytandem mass
spectrometry;
Solid phase extraction;
Pharmacokinetic study
An analytical method based on solid phase extraction was developed and validated for analysis of adefovir in human plasma.Adefovir-d4was used as an internal standard and Synergi MAX RP80A (150 mm×4.6 mm,4 μm)column provided the desired chromatographic separation of compounds followed by detection with mass spectrometry.The method used simple isocratic chromatographic condition and mass spectrometric detection in the positive ionization mode.The calibration curves were linear over the range of 0.50-42.47 ng/mL with the lower limit of quantitation validated at 0.50 ng/mL. Matrix effect was assessed by post-column infusion experiment to monitor phospholipids and postextraction addition experiment was performed.The degree of matrix effect for adefovir was determined as 7.5%and ion-enhancement in five different lots of human plasma was 7.1%and had no impact on study samples analysis with 4.5 min run time.The intra-and inter-day precision values were within 7.7%and 7.8%,respectively,for adefovir at the lower limit of quantification level.Validated bioanalytical method was successfully applied to clinical sample analysis.
©2015 Xi’an Jiaotong University.Production and hosting by Elsevier B.V.All rights reserved.
1. Introduction
Adefovir,an acyclic phosphonate analog of deoxynucleoside monophosphate(IUPAC name:{[2-(6-amino-9H-purin-9-yl)ethoxy] methyl}phosphonic acid,PMEA),is a broad spectrum antiviral agent acting as a DNA polymerase inhibitor[1].It has activity against herpes virus(Epstein-Barr)and retroviruses including the human immunodeficiency virus(HIV)[1].Adefovir is largely used to treat chronic hepatitis B in adults,though the drug is reported for poor oral bioavailability[2].The oral bioavailability of adefovir has been substantially improved by using the bis-pivaloyloxymethyl ester of adefovir(bis-POM PMEA,adefovir dipivoxil,Fig.1)as a pro-drug
with enhanced lipophilicity and achieving higher systemic adefovir levels.Adefovir dipivoxil spontaneously hydrolyzes to mono-POMPMEA,which is rapidly converted into PMEA(adefovir)by enzyme. Adefovir is an acyclic nucleoside analog of adenosine monophosphate which is phosphorylated to the active metabolite adefovir diphosphate by cellular kinases[2].
✽Corresponding author.Tel.:+91 124 4194400.
E-mail address:dipanjan.goswami@Sunpharma.com(D.Goswami). Peer review under responsibility of Xi’an Jiaotong University.
2095-1779©2015 Xi’an Jiaotong University.Production and hosting by Elsevier B.V.All rights reserved. http://dx.doi.org/10.1016/j.jpha.2014.08.002
Although several methods have been reported to quantify adefovir in human plasma[3-6]including serum[7],by employing liquid chromatography-tandem mass spectrometry(LC-MS/MS), analytical limitations could not be overcome.The published methods demonstrated LC-MS/MS method for adefovir estimation but lacked sensitivity and had lengthy run time[5,7].Xie et al.[6] developed an LC-MS/MS method for the determination of adefovir with limit of quantitation 0.5 ng/mL but this method had matrix related issue.The reported method failed to use labeled/deuterated analog of adefovir for estimation from plasma to compensate equivalent matrix effect with that of analyte.Vela et al.[8]had developed an LC-MS/MS method using a very tedious and complex ion-pairing technique for adefovir estimation.An interesting LC-MS/MS method of adefovir had been reported with emphasis on hydrophilic interaction but failed to achieve lower limit of quantification(LOQ)below 1.00 ng/mL[9].Moreover, Chen et al.[10]achieved sensitivity 0.25 ng/mL using protein precipitation extraction method.But the method had lengthy analysis run time(>7 min)and also the method-related issue was not addressed adequately.
Bioavailability/bioequivalence studies are frequently conducted on healthy volunteers with adefovir dipivoxil 10 or 20 mg tablet, marketed as Hespera(Gilead Sciences,Inc.,Foster City,CA). Regulatory guidance[11,12]suggests that LOQ should be sufficient to characterize pharmacokinetic parameters based on expected peak plasma concentration(Cmax).European Medicine Agency[12]suggests 5%of Cmaxshould be achieved to have sufficient sensitivity to capture profile in elimination phase of a drug.A monograph on adefovir states that the following oral administration of a 10 mg single dose of Hespera in chronic hepatitis B patients,the mean Cmaxwas 18.4 ng/mL with mean elimination half-life of 7.48 h[13].But,published literature reflected high variation(14.9-24.7 ng/mL)in mean Cmaxfor 10 mg adefovir tablet,though administered to healthy volunteers [9,10].Such variation could be attributed to matrix effect or any other aspects of method limitations.Therefore,it becomes imperative to develop a precise,accurate,and high throughput method for estimation of adefovir in human plasma.For conducting the bioequivalence study on adefovir(i.e.10 mg Hespera tablet),method sensitivity should be such that concentration profile up to 36 h(~5 half lives)could be plotted.Though 1.0 ng/mL LOQ could have sufficed[12]to characterize pharmacokinetic parameter,we further decreased method sensitivity to 0.5 ng/mL.
In the present study,a systematic evaluation of matrix interference was investigated by using protein precipitation extraction (PPE)followed by solid phase extraction(SPE)combination technique to bring down matrix effect below 10%level effectively. The unique method highlights adefovir stability as well as selectivity in blank(untreated)plasma,hemolyzed and lipemic plasma samples.The method had been successfully applied to clinical sample analysis.
2. Experimental
2.1. Chemicals and reagents
Working standards of adefovir(purity-99.35%)and adefovir-d4(deuterium labeled adefovir;purity-98.0%)were procured from Ranbaxy Research Laboratories Limited,India and Toronto Research Chemicals,Canada,respectively.Ammonium acetate, formic acid,liquor ammonia and methanol were purchased from Qualigens Fine Chemicals(GSK Ltd.,Mumbai,India).Oasis®MAX(30 mg/1 cc)solid phase cartridges were purchased from Waters Corporation(Milford Massachusetts,USA).Water was purified using a Milli-Q device(Millipore,Bangalore,India). Drug-free(blank)human plasma containing K3EDTA(ethylenediaminetetraacetic acid tripotassium salt),as anticoagulant,was obtained from Yash Laboratories,New Delhi,India.
2.2. Preparation of calibration standards and quality control samples
Adefovir,a water insoluble,polar drug[13],was found to be better solubilized in acidified water(pH ~1.2).Stock solutions of adefovir and internal standard(ISTD)were prepared separately by dissolving the accurately weighed compounds in acidified water to obtain a final concentration of approximately 1 mg/mL.Stock solutions were stored at refrigerated temperature(1-10°C).Two separate stock solutions of adefovir were prepared for bulk spiking of calibration standards(CS)and quality control(QC)samples. Primary dilutions and working standard solutions were prepared from stock solutions using methanol:water(50:50,v/v).These working(standard)solutions were used to prepare the CS and QC samples.Blank human K3EDTA plasma was screened prior to spiking to ensure that it was free from endogenous interference at retention times of adefovir and ISTD.Eight-point calibration standards(CS)and QC samples were prepared by spiking the
blank human plasma with appropriate concentration of adefovir. Calibration standards samples were prepared at concentrations of 0.50,1.27,3.44,6.88,11.47,19.11,31.85 and 42.47 ng/mL.The lowest limit of quantification quality control(LOQQC),low quality control(LQC),medium quality control(MQC)and high quality control(HQC)samples were prepared at concentrations of 0.50,1.41,16.73 and 33.47 ng/mL,respectively.The(bulk)spiked CS and QC samples were stored below-15°C and protected from light until analysis.The ISTD working solution(200.0 ng/ mL)was prepared in methanol:water(50:50,v/v).
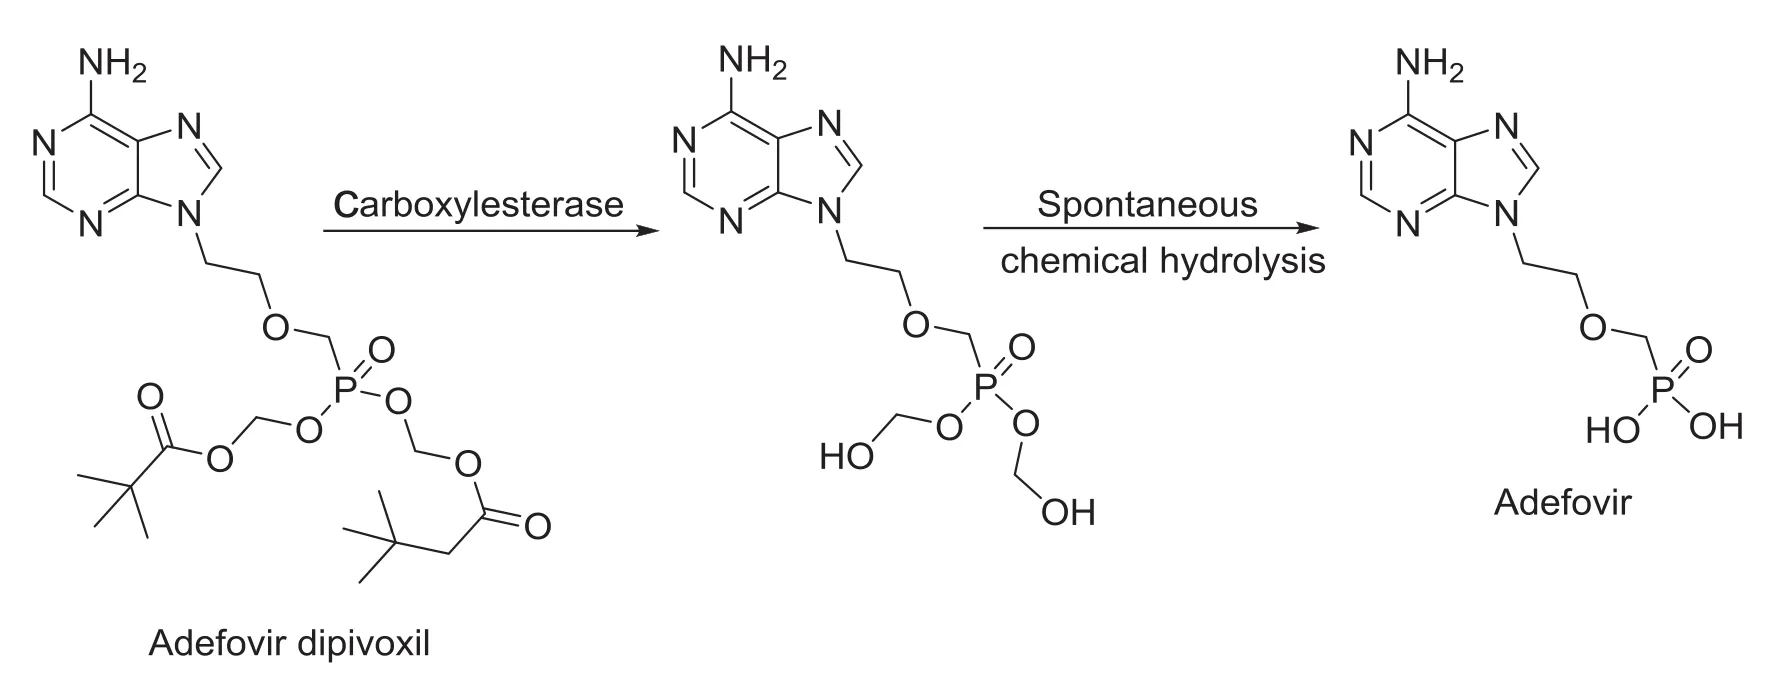
Fig.1 In-vivo hydrolysis of adefovir dipivoxil to adefovir.
2.3. Plasma sample preparation
500 μL of plasma sample was pipetted into polypropylene tubes (12 mm ×75 mm)and50 μL ofISTD working solution (200.0 ng/mL of ISTD)was added with the use of multistepper. Samples were vortexed approximately for 30 s.Samples were pretreated with 0.400 mL of 5%ammonia solution and vortexed again(approximately for 30 s).The pretreated samples were loaded onto the cartridge(Oasis®MAX,30 mg/1 cc)and centrifuged at 1500 rpm(or 453 g)for 1 min at 2-10°C.The cartridges were washed with 1 mL of 5%ammonia solution and then 1 mL of methanol.Compounds were then eluted with 1 mL of 2%formic acid solution.The extracted samples were evaporated to dryness at 20 psi and 50°C under a stream of dry nitrogen using a Zymark TurboVap LV evaporator(Caliper,Hopkinton,MA, USA).Samples were reconstituted with 300 μL of reconstitution solution(methanol:10 mM ammonium acetate:70:30,v/v).The reconstituted samples were transferred into autosampler glass vials.20 μL of sample was injected into the LC-MS/MS system for analysis.
2.4. LC-MS/MS instrumentation and analytical conditions
The liquid chromatography separation was performed using a Shimadzu scientific instruments(Shimadzu Corporation;Kyoto, Japan)comprising two LC-20AD pumps,a cooling autosampler (SIL 20AC),a column oven of temperature control(CTO-20AC) and a CBM 20 A controller.Chromatographic separations were achieved on Synergi MAX-RP 80A(150 mm×4.6 mm,4 μm; Phenomenex,Torrance,USA)column using a mobile phase mixture of 10 mM ammonium acetate buffer(pH 8.7)and methanol(75:25,v/v),at isocratic flow rate of 0.6 mL/min.The column and autosampler temperature were kept at 35°C and 10°C,respectively.An Applied Biosystems Sciex API 4000 (MDS-Sciex®,Concord,Canada)consists of an electrospray ionization(ESI)interface,which was operated in positive ion mode.Quantification was carried out using multiple reaction monitoring(MRM)mode of the transitions m/z 274.3→161.8 and 278.1→166.2 for adefovir and ISTD,respectively.Unit resolution was applied to both Q1 and Q3.Dwell time was set at 150 ms for adefovir and ISTD.Nitrogen was used as the nebulizer,auxiliary,collision and curtain gas.The source parameters of the mass spectrometer were optimized and maintained as follows:collision activated dissociation(CAD)gas,6;curtain gas (CUR),40;gas 1(nebulizer gas),50;gas 2(heater gas),55;turbo ion spray(IS)voltage,5500 V;and source temperature,650°C. Other optimized compound parameters for monitoring analyte were set as follows:declustering potential(DP),43 V;entrance potential (EP),8 V;collision energy(CE),40 V;and collision cell exit potential(CXP),9 V.
Calibration curves were constructed by calculating the analyte to ISTD peak area ratio(y)against analyte concentrations(x).Data acquisition and processing were performed using Analyst version 1.4.1 software(MDS Sciex,Toronto,Canada).
2.5. Method validation
Method validation of adefovir in human plasma was carried out, following US Food and Drug Administration guidelines and Guidance from European Medicine Agency[11,12].The method was validated for selectivity,sensitivity,linearity,precision and accuracy,recovery,matrix effect,re-injection reproducibility, dilution integrity and stability of adefovir during both short-term sample processing and long-term storage.
2.5.1. Selectivity and signal-to-noise(S/N)ratio
The selectivity of the method towards endogenous plasma matrix components,and concomitant medications was assessed in ten batches(6 normal,2 hemolyzed and 2 lipemic)of blank human K3EDTA plasma.These samples were processed using the proposed extraction protocol and analyzed with the set chromatographic conditions at LOQ level.The peak area of the co-eluting components or interferences in blank sample should be less than 20%and 5%from those of the analyte and ISTD,respectively. The sensitivity was demonstrated by checking signal and noise in spiked samples at the lowest quality control concentration.For determination of signal-to-noise(S/N)ratio,four replicates of LOQQC along with pooled blank matrix samples were processed and analyzed.The S/N ratio of spiked samples was deemed acceptable when

2.5.2. Linearity and LOQ
Three calibration curves were used to demonstrate the linearity of the method.The ratio of area responses for adefovir was used for regression analysis.Each calibration curve was analyzed individually by using least square weighted (1/x2)linear regression(obtained by best fit method).Back-calculations were made from these curves to determine the concentration of adefovir in each calibrator.A correlation coefficient(r)>0.99 was desirable for all the calibration curves.The sensitivity was demonstrated by checking signal and noise in spiked samples at the lowest QC concentration.In addition,the analyte peak at LOQQC concentration should be identifiable, discrete and reproducible with accuracy within±20%and a precision≤20%.
2.5.3. Precision and accuracy
The intra-and inter-day precision and accuracy were performed for adefovir in K3EDTA plasma.The intra-day accuracy and inter-day accuracy were determined by replicate analysis of QC samples (n=6)at LOQQC,LQC,MQC and HQC.The precision of the method was determined by calculating the percentage coefficient of variation(%CV)for each level.The deviation at each concentration level from the nominal concentration was expected to be within ±15.0%,excluding at LOQQC level(±20%).Similarly,the mean accuracy should not deviate by±15.0%,excluding at LOQQC level (±20%).
2.5.4. Relative recovery,absolute matrix effect and relative matrix effect
The relative recovery(RRE)for the analyte and ISTD at low, middle and high QC concentration levels was determined by measuring the mean peak area response of six replicates of extracted quality control samples(spiked before extraction)against the mean peak area response of post-extracted samples(spiked after extraction)containing the analyte and ISTD at concentrations equivalent to those obtained in the final extracted concentration for the analyte and ISTD in the QC samples.
RRE of adefovir and ISTD was estimated by using the following equation:

The absolute matrix effect(AME)was estimated by the following equation:

When,AME=1 indicates no matrix effect,AME<1 indicates ion-suppression and AME>1 indicates ion-enhancement.As extraction protocol involves a terminal drying step,hence spiking (addition of reference samples)was carried out in post-extracted blank plasma sample to perform matrix factor.The concentration of the analyte and ISTD was obtained in reference sample representing the QC concentration(at LQC,MQC and HQC levels).The control sample was reference solution prepared at an appropriate concentration in reconstitution solution.
2.5.5. Re-injection reproducibility and dilution integrity
Re-injection reproducibility was performed by injecting QC samples(at LQC,MQC and HQC levels)from an accepted precision-accuracy batch. The calculated concentration of re-injected QC samples was determined against the CS samples from the same precision and accuracy batch.Percentage difference between original and re-injected value was calculated by using following equation:

The dilution integrity experiment was performed with an aim to validate the dilution test to be carried out on higher analyte concentrations above upper limit of quantification(ULOQ),which may be encountered during real subject sample analysis.Dilution integrity test was performed by preparing samples at a concentration approximately two times the concentration of 90%ULOQ. These samples were diluted to two and four times with blank matrix so as to bring the concentration within calibration curve and then analyzed against fresh CS samples.The acceptance criteria for the diluted QC samples should be the same as those of QC samples in precision and accuracy batch.
2.5.6. Stability
Stability experiments were carried out to examine the analyte stability in stock solutions and in plasma samples under different conditions.Stock solution stability at refrigerated temperature (1-10°C)was assessed by comparing the peak area response of stability sample of the analyte and ISTD with the area response of sample prepared from fresh stock solutions.The stock solution of adefovir and ISTD was considered stable if the deviation from nominal value was within±10.0%.The stability of adefovir in matrix was examined at low and high QC levels by analyzing four replicates of QC samples against freshly spiked CS samples. The stability data from various exercises,e.g.,autosampler stability,bench-top stability in plasma,freeze/thaw stability and long-term stability were evaluated as per regulatory guidelines [12,13].
The percentage stability was calculated by using the formula:

The bench-top stability of spiked plasma samples stored at room temperature was evaluated for~6.5 h.The autosampler stability was determined by storing reconstituted QC samples for~49 h under autosampler condition(at 10°C)before being analyzed.The freeze-thaw stability was conducted by comparing the stability samples that had been frozen below-15°C and thawed at room temperature three times,with freshly spiked QC samples.Four aliquots of each LQC and HQC concentration level were used for the freeze-thaw stability evaluation.For long-term stability evaluation,the concentrations obtained after 76 days were compared with initial concentrations.All stability exercises were performed against freshly spiked CS samples.
Human K3EDTA whole blood spiked with working solutions (at LQC and HQC levels)was prepared and kept at bench at room temperature(stability samples).After 2.0 h aqueous dilutions were spiked in human K3EDTA whole blood(comparison samples). After plasma was separated from blood sample,four aliquots of each QC sample(stability as well as comparison samples)were analyzed.The percentage stability of adefovir in human whole blood was calculated by mean of area ratio of stability samples against the comparison samples.The analyte was considered stable if the stability was within 85-115%.The percentage stability was calculated using the formula:

3. Results and discussion
3.1. MS parameters optimization
Primary objective of method development was to achieve adequate sensitivity,minimum overall analysis time(plasma processing and chromatographic run)and the use of a small plasma volume for processing,which is crucial for adefovir,especially for lower dosage formulation.To develop a rapid and sensitive method,it was equally necessary to optimize the chromatographic and mass spectrometric conditions,as well as to have an efficient extraction procedure for adefovir.The present study was conducted using ESI ionization source as it produced high intensity for the analyte and ISTD and a good linearity in regression curves.
Three pKavalues i.e.,2,4 and 7(ACD/Chem Sketch software, Version 12.5)are noted for adefovir.The pKa7 is due to-NH2group presence in purine nucleus while 2 and 4 pKavalues are attributed to two-OH groups(Fig.1).The amino group,attached to purine nucleus,was easily ionized in positive ion mode.ESI mass spectrum for adefovir and ISTD,in the positive mode,was dominant with protonated(M+H)+ions as both were easily
protonated.Addition of base further enhanced the intensity of these ions to obtain protonated precursor ion peaks at m/z 274.3 and 278.1 for adefovir and ISTD,respectively.
The mass fragmentation pattern of adefovir revealed several peaks of significant intensity by varying collision energy from 5 to 55 V (using nitrogen as CAD gas).The observed fragmentation for the protonated precursor ion of adefovir was noted as m/z 274 Da.The protonated precursor ion of adefovir was stable up to 15 V collision energy,with negligible fragmentation.This could be due to its high stability and possibly due to low molecular mass of nitrogen as CAD gas.Further increase in collision energy(up to 25 V)formed the fragment at m/z 256 Da,but poor relative peak intensity(~21%)was noted.Such effect is due to loss of water molecule followed by rapid elimination of phosphono methoxy group to form ion at m/z 162 Da. However,the ion at m/z 162 Da was further fragmented(employing collision energy of 30-35 V)with the loss of propyl group at m/z 136 Da.Though the fragments at m/z 145 Da and 136 Da were noted by setting collision energy at 50 V,their intensities did not reach even 20%.Therefore,dominant fragment ion m/z 162 Da was stabilized at 35-40 V(with relative intensity 100%).This formed the basis of our product ion selection,m/z 162,for quantitation.The MRM state file parameters(like nebulizer gas,CAD gas,ion spray voltage,and temperature)were suitably optimized to obtain a consistent and adequate response for the analyte.A dwell time set at 150 ms per
transition eliminated cross talk completely between adefovir and ISTD MRMs.
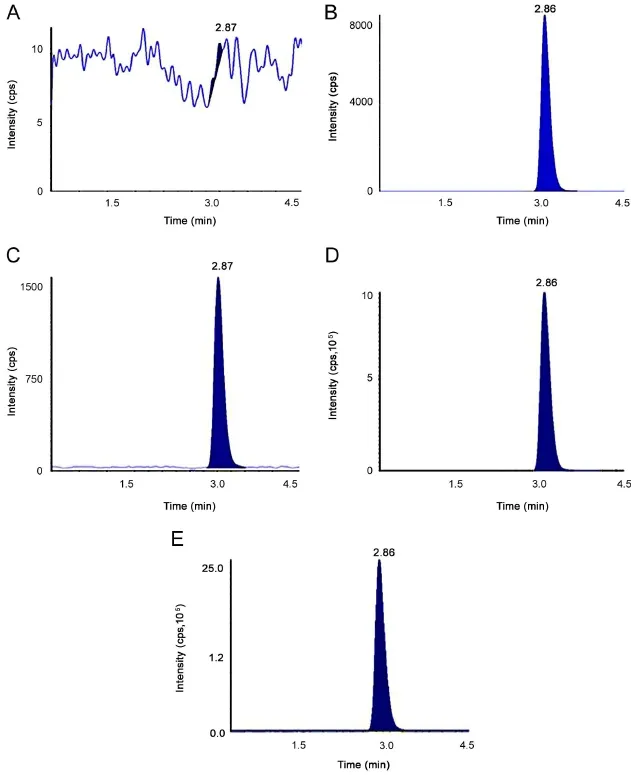
Fig.2 Chromatograms of(A)blank plasma spiked with IS sample[at RT of adefovir],(B)blank plasma spiked with ISTD sample[at RT ofadefovir-d4],(C)LLOQ,(D)ULOQ and(E)real subject sample(17.51 ng/mL,after 1.0 h of oral administration).

Table 1 Intra-and inter-day precision and accuracy data for the determination of adefovir.

Table 2 Relative recovery of adefovir.
3.2. Chromatographic conditions and sample preparation
Chromatographic analysis of adefovir and ISTD was carried out under isocratic conditions to obtain adequate response,sharp peak shape,and a shorter run time.The use of volatile buffers like ammonium formate and ammonium acetate(in combination of methanol-acetonitrile)for the separation of adefovir had been evaluated also.It was observed that the pH of mobile phase and selection of column were critical parameters.Chromatographic separation was tried using various combinations of methanol-acetonitrile,acidic buffers and additives(like formic acid,glacial acetic acid and liquor ammonia solution)on different reversed phase columns with 5 μm particle size[viz., Xterra column (150 mm×4.6 mm), Chromolith RP-18 (100 mm×4.6 mm),Atlantis HILLIC (100 mm×4.6 mm), Ascentis C8(100 mm×4.6 mm),Zorbax SB C8(100 mm×4.6 mm),and BDS Hypersil C18(50 mm×4.6 mm)]to optimize liquid chromatographic parameters.The analytes showed nonlinear behavior on Chromolith RP-18 column while HILLIC column was marked unsuitable due to co-eluting matrix compounds especially with hemolyzed plasma samples.The Synergi MAX-RP 80A(150 mm×4.6 mm;4 μm)column with C12 bonded phase was sterically less hindered than a C18 and was therefore tried.The column is bound to extreme surface area(475 m2/g)silica 80A, produced desired hydrophobic retention.The required selectivity as well as sharper,symmetric peaks,for both adefovir and ISTD,was noted and matrix interference for hemolyzed and lipemic plasma samples was deemed negligible.The mobile phase consisting of 10 mM ammonium acetate buffer and methanol(75:25,v/v)with pH approximately 8.7±0.1 was found most suitable for eluting the analyte and ISTD from Synergi MAX-RP 80A column within run time of 4.5 min.
Initially,the extraction of adefovir was carried out via protein precipitation(with acetonitrile,methanol,and acetone)but high backpressure with frequent clogging of the column was noted. Liquid-liquid extraction technique was also evaluated to isolate the drugs from plasma using diethyl ether,dichloromethane, methyl tert-butyl ether,and isopropyl alcohol(alone and in combination)as extracting solvents.However,the recovery was inconsistent with significant ion enhancement(greater than 40% CV).Furthermore,optimization of solid phase extraction was done employing Waters Oasis®HLB,Waters Oasis®MCX, Waters Oasis®MAX and Phenomenex Strata cartridges.Finally better retention was provided on the Waters Oasis®MAX as compared to other cartridges.Using 5%ammonia liquor and methanol during washing step imparted consistent recovery with minimal matrix interference.Current regulatory agencies support ISTD should preferably belong to the same class,with the same physicochemical and spectral properties,to improve the method precision,accuracy and linearity.Adefovir-d4,an isotopic labeled compound of adefovir,was selected as an ISTD due to similar structural and physicochemical properties with those of adefovir.Moreover,there was no significant effect of ISTD on analyte recovery,sensitivity,ion enhancement or matrix effect.
3.3. Method validation parameters
3.3.1. Selectivity and signal-to-noise(S/N)ratio
Representativechromatogramsobtained from blank plasma, plasma spiked with LOQ,and real subject sample for adefovir and ISTD are presented in Fig.2.The mean interference observed at the retention time of the analyte between 10 different lots of human plasma including hemolyzed and lipemic plasma(containing K3EDTA as the anticoagulant)was calculated as 3.4%and 0.4% for adefovir and ISTD,respectively.Six replicates of LOQ samples were prepared from the cleanest blank samples and analyzed samples were deemed acceptable with CV< 4%. We observed S/N ratio was>25 during method validation and clinical sample analysis,which was within an acceptable limit [11,12].
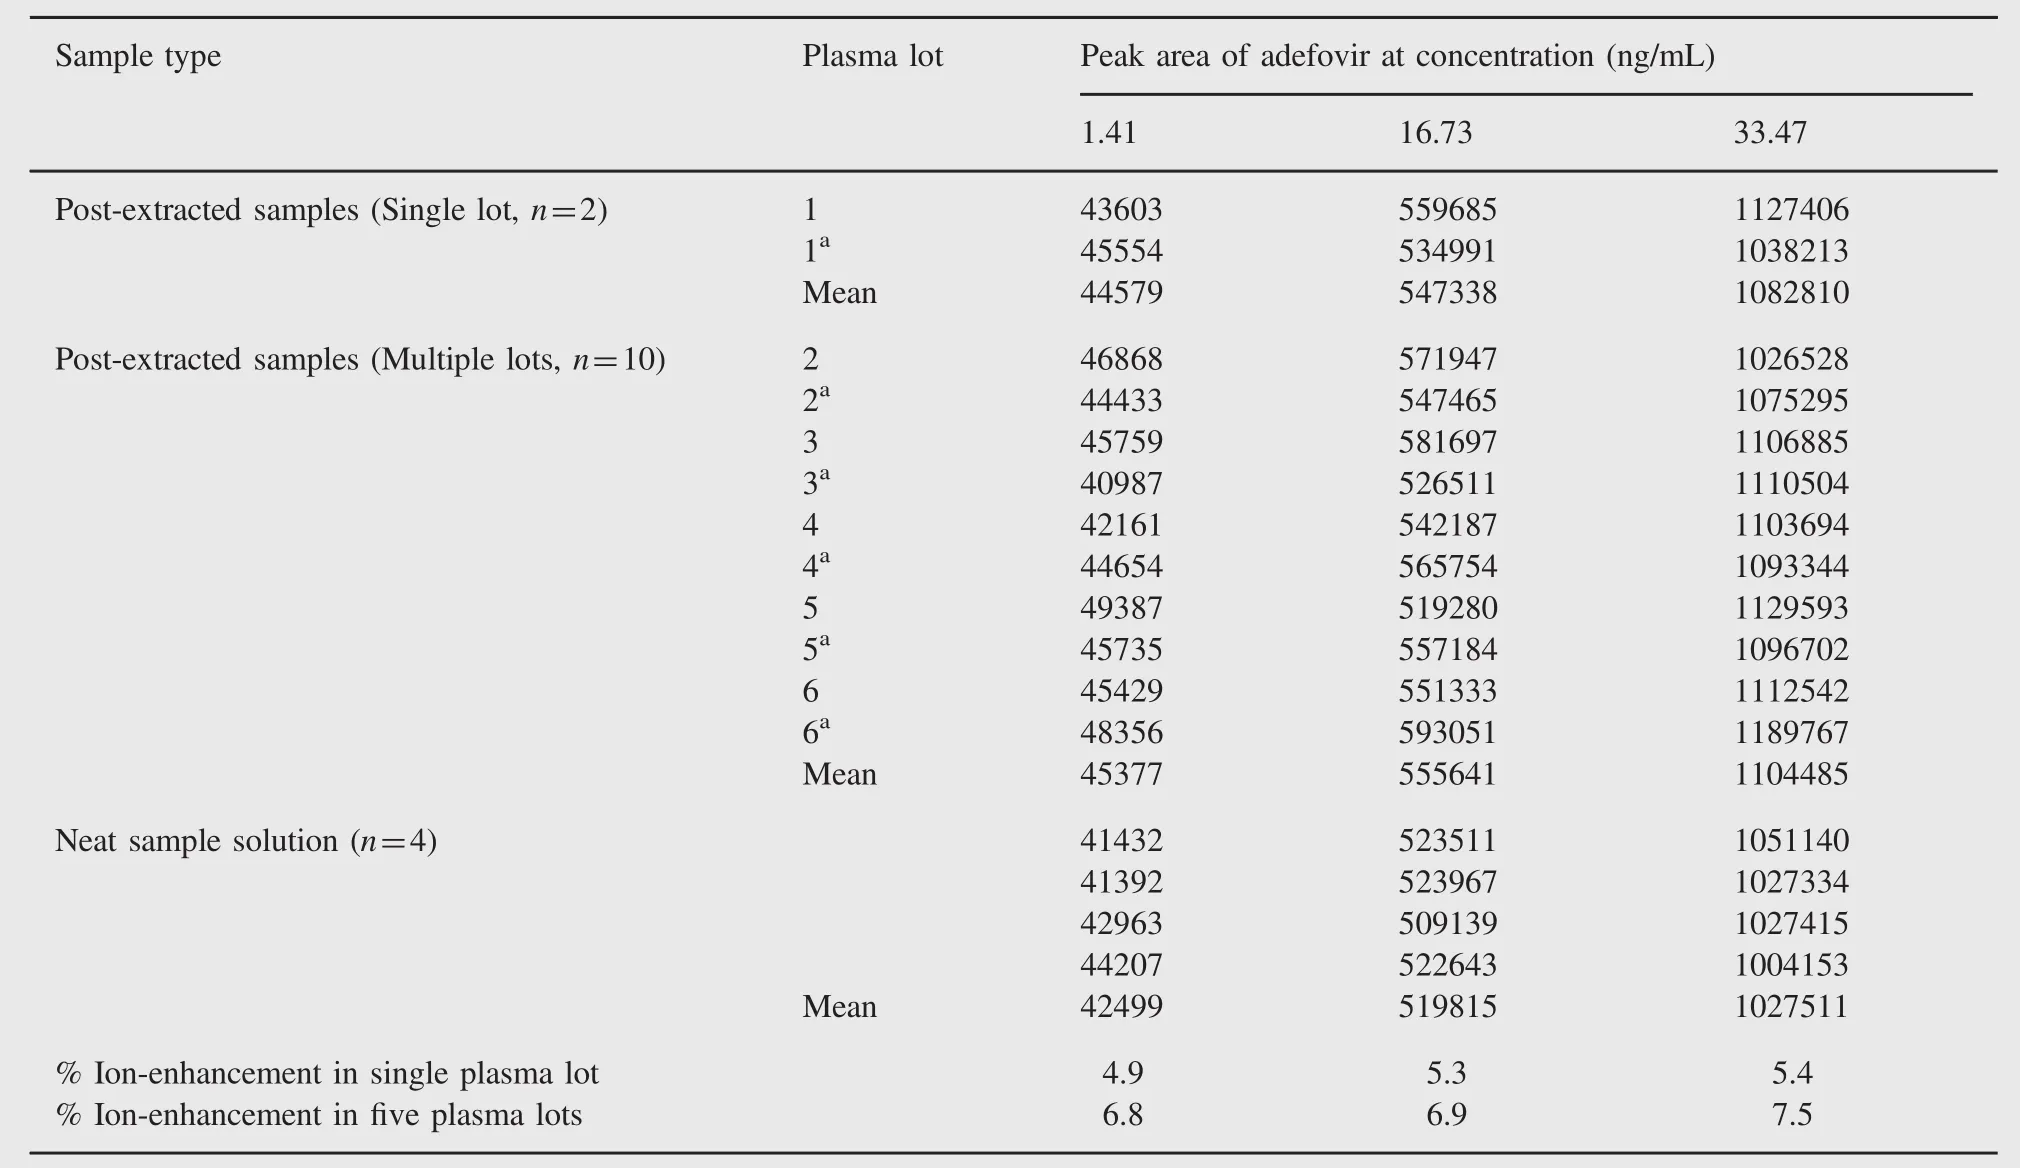
Table 3 Absolute matrix effect(ion-enhancement)of adefovir.
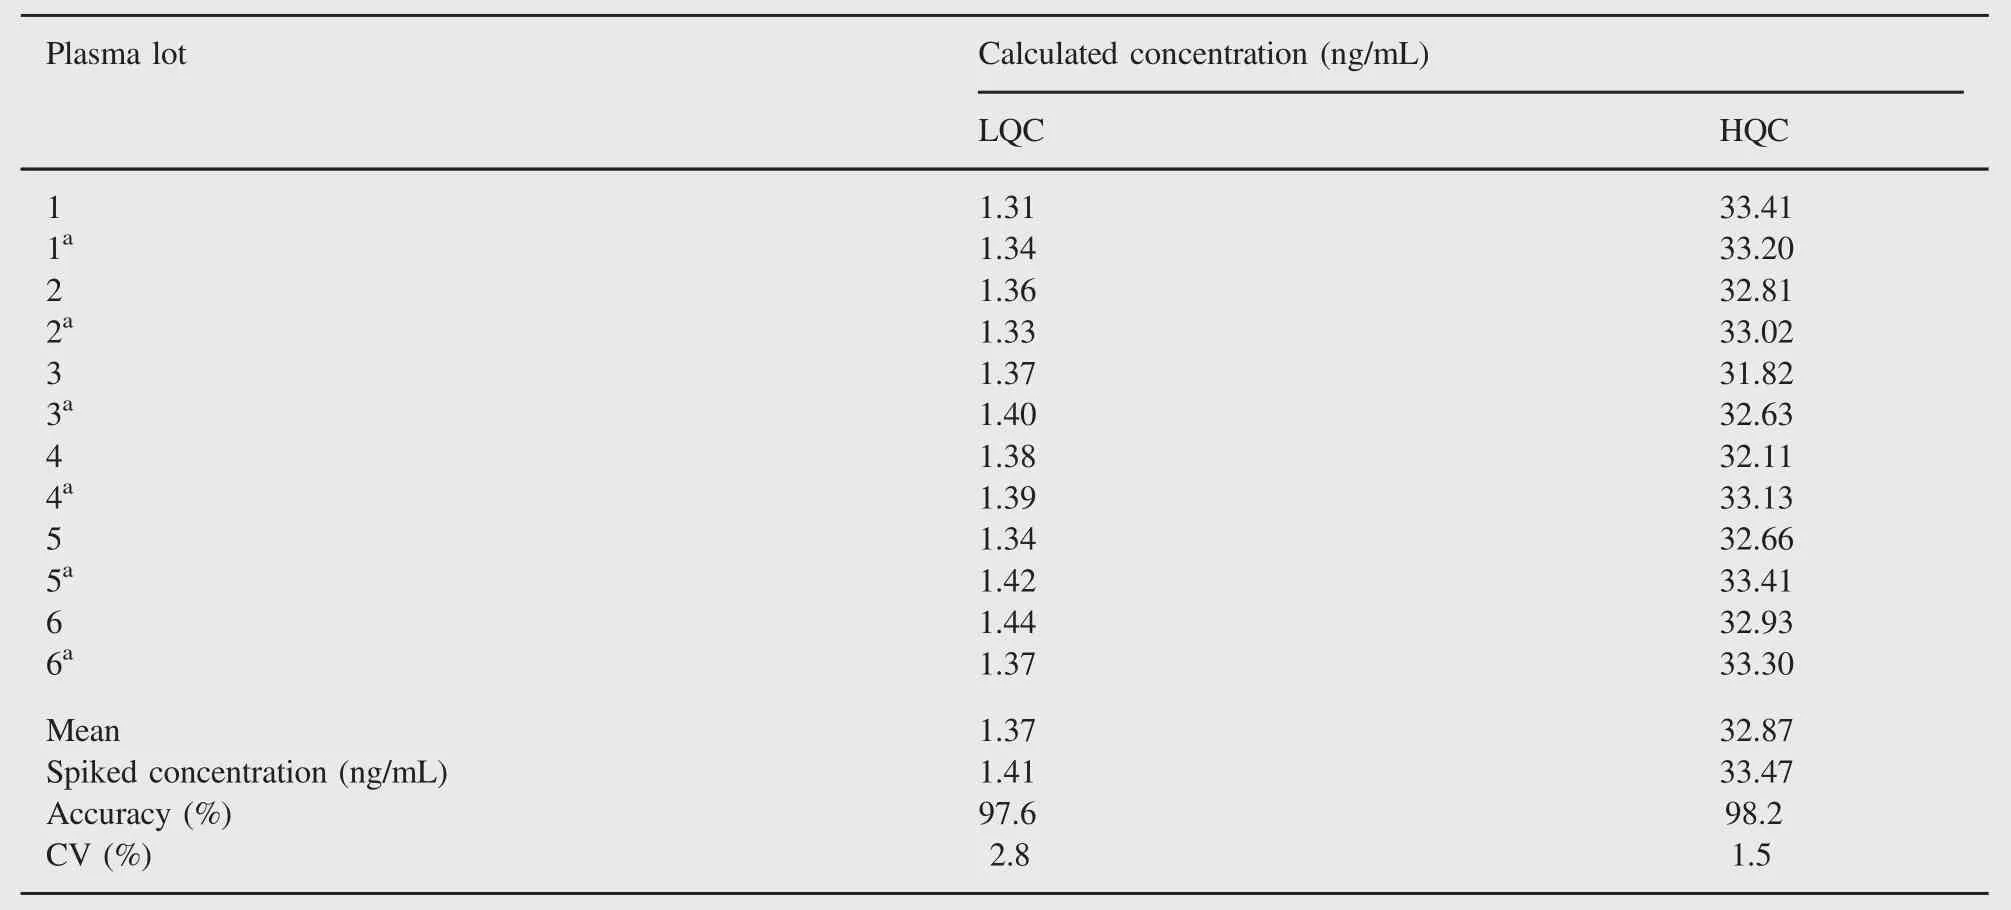
Table 4 Relative matrix effect of adefovir.
3.3.2. Linearity,precision and accuracy
The linearity of adefovir was determined by weighted least square regression analysis of standard plot that consisted of eight point standard curve.The calibration was linear from 0.50 to 42.47 ng/mL for adefovir.Best-fit calibration curves of chromatographic response versus concentrations were determined by weighted least square regression analysis with weighting factor of 1/concentration2.The correlation coefficient(r2)was consistently greater than 0.9997 during the course of validation for adefovir.Accuracy ranged from 99.2%to 103.8%,94.0%to 103.6%and 95.3%to 102.5%for within batch, intra-and inter-day,respectively.These were within the acceptance criteria of±15%of the nominal value at low,middle and high QC levels and within±20%of the nominal concentration at LOQQC concentration.Precision ranged from 0.9%to 5.9%,5.1%to 7.7%and 4.5%to 7.8%for within batch,intra-day and inter-day,respectively. Precisions(%CV)were within the acceptance criteria of≤15%atlow,middle and high QC concentrations and≤20%at LOQQC concentration.Intra-and inter-day precision and accuracy are presented in Table 1.

Table 5 Stability of adefovir(n=4).

Table 6 Whole blood stability.
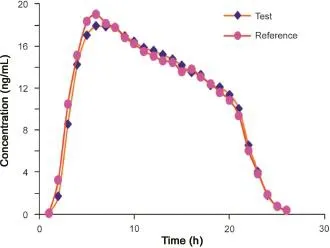
Fig.3 The linear plasma mean concentration versus time profile.
3.3.3. Relative recovery,absolute matrix effect and relative matrix effect
The relative recoveries of adefovir at LQC,MQC and HQC levels were 55.9%,55.9%and 52.6%,respectively.The precision of relative recovery across the low,middle and high QC levels was 3.5%and the results are shown in Table 2.
The assessment of matrix effect constitutes an important and integral part of validation for quantitative LC-MS/MS for supporting pharmacokinetic studies.The results of absolute matrix effect are acceptable(CV less than 6%at all QC levels).The ion enhancement was 4.9-5.4%(for single lot)and 6.8-7.5%(for five different lots)of human plasma,which is demonstrated in Table 3. The acceptable results of relative matrix effect are presented in Table 4.Also,a matrix-effect experiment by the post-infusion method was conducted during method development to check ion suppression or enhancement at adefovir and ISTD retention times. It was confirmed that there was no significant ion enhancement at retention times of adefovir and ISTD.
3.3.4. Re-injection reproducibility and dilution integrity
Re-injection reproducibility exercise was performed to check whether the instrument performance remains unchanged after hardware deactivation because of any instrument failure during real subject sample analysis.Percentage difference for all reinjected QC samples(at LQC,MQC and HQC levels)was less than 2.9 and deemed acceptable.The result of dilution integrity was deemed acceptable for 2 times and 4 times dilutions.
3.3.5. Stability
Stock solution stability was performed to check stability of adefovir and ISTD in stock solutions prepared in acidified water(pH~1.2)and stored at 1-10°C in a refrigerator.The freshly prepared stock solutions were compared with stock solutions prepared before 16 days.The percentage changes for adefovir and ISTD were 0.6 and 2.2, respectively,which indicate that stock solutions were stable for at least 15 days.Bench-top stability and autosampler stability for adefovir were investigated at LQC and HQC levels.The results revealed that adefovir was stable in plasma for at least 6.5 h at room temperature and~49 h in an autosampler temperature(10°C).It was confirmed that repeated freezing and thawing(three cycles)of plasma samples,spiked with adefovir at LQC and HQC levels,did not affect their stability. The long-term stability results also indicated that adefovir was stable in matrix up to 76 days,stored below-15°C.The results obtained from all these stability studies are shown in Table 5. Whole blood stability data were found acceptable and are presented in Table 6.

Table 7 Pharmacokinetic parameters(mean±SD)of adefovir after the administration of an oral dose of 10 mg test and reference adefovir formulations to healthy Indian male volunteers.
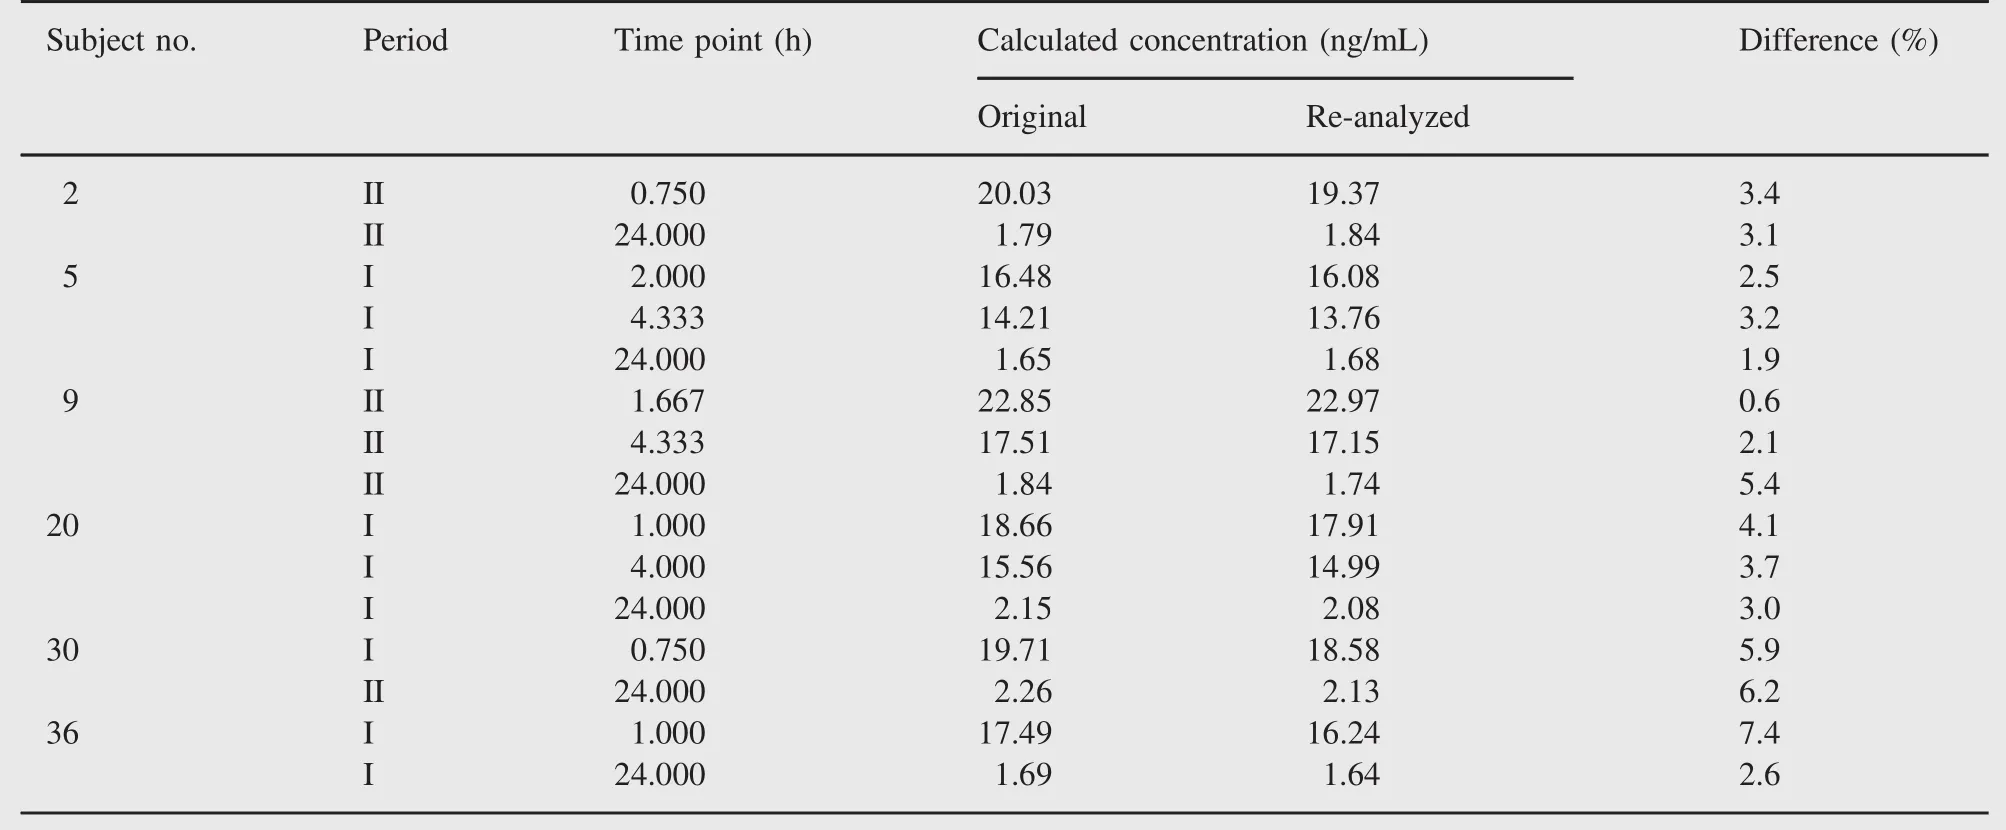
Table 8 Representative incurred sample re-analysis data with I as the first period and II as the second period.
3.4. Method application
An open label,balanced,randomized,two-treatment,two-period, two-sequence,single-dose,crossover design was used for the assessment of pharmacokinetics and bioequivalence.Thirty-six healthy adult male volunteers who gave written informed consent took part in this study.The study was approved by Ethics Committee of Institutional Review Board at Majeedia Hospital (New Delhi,India).After an overnight fast of at least 10 h,all subjects were given a single oral dose of 10 mg adefovir dipivoxil immediate release tablet during each period of the study.Blood samples were collected before(pre-dose)and at 0.167,0.333, 0.500,0.750,1.000,1.333,1.667,2.000,2.333,2.667,3.000, 3.333,3.667,4.000,4.333,4.667,5.000,5.500,6.000,8.000, 12.000,16.000,24.000,36.000 and 48.000 h post-dose in each period.After separation of plasma from the blood by centrifugation,plasma samples were stored frozen below-15°C until analysis.
The plasma mean concentration time profile of adefovir is depicted in Fig.3.The estimated pharmacokinetic parameters derived from the plasma concentration profiles are summarized in Table 7.Bioequivalence was established for Ranbaxy test drug and innovator Hespra 10 mg adefovir dipivoxil immediate release tablet.Further mean plasma concentration at 36 h sampling time point was computed as 0.73 ng/mL.The present method LOQ of 0.5 ng/mL was justified since concentration-profile till 5 half lives of drug(10 mg adefovir tablet)was captured with 0.5 ng/ mL sensitivity.
The results of incurred sample re-analysis(ISR)showed that 98.4%sampling point concentrations for adefovir were within ±20%of original concentration value.
The%difference from the original analysis was calculated as

These results additionally supported our improved method techniques and reproducibility of data for subject sample analysis as well.Representative ISR data are further presented in Table 8.
4. Conclusion
In summary,a rapid,specific,reproducible and high-throughput LCMS/MS method to quantify adefovir using adefovir-d4as an internal standard was developed and validated.The reported literature failed to highlight a systematic procedure to control ion-enhancement which is the intrinsic property of typical anti-viral drug adefovir.Our method is highly selective and addresses the short-comings of previous reported methods.The selectivity of method in hemolyzed and lipemic plasma and stability of adefovir in blood are unique features of the method.Overall the developed method presented adequate sensitivity,excellent selectivity,controlled ion enhancement and desired reproducibility for the quantification of adefovir in human plasma.The other major advantage of this validated method is the shorter runtime of 4.5 min,allowing the quantitation of over 300 samples per day.Bioequivalence was established with Hepsera®
10 mg adefovir tablets and pharmacokinetic parameters were similar to that of the monograph on innovator[13]based on our improved method.This method has been extensively validated like our previous method validation reported[14,15],catering to the requirement of global regulatory agencies like USFDA and EMA.Moreover,the ISR at the end of the study further added strength to our current method.All these advantages would make it efficient for routine therapeutic drug monitoring as well as for the analysis of large number of plasma samples obtained from exploratory pharmacokinetic studies.
Acknowledgments
The authors wish to acknowledge the support and facilities received from Ranbaxy Research Laboratories Gurgaon,India, for carrying out this work.Usual disclaimer applies.
[1]K.C.Cundy,Clinical pharmacokinetics of the antiviral nucleotide analogues cidofovir and adefovir,Clin.Pharmacokinet.36(1999)127-143.
[2]R.B Qaqish,K.A.Mattes,D.J.Ritchie,A new antiviral agent for the treatment of hepatitis B virus infection,Clin.Ther.25(2003) 3084-3099.
[3]B.P Kearney,S Ramanathan,A.K Cheng,et al.,Systemic and renal pharmacokinetics of adefovir and tenofovir upon coadministration, J.Clin.Pharmacol.45(2005)935-940.
[4]S.Lecompte,M.Furtado,A.Hardy,et al.,Quantitative determination of adefovir in human plasma using LC/MS/MS,APPS 001(2004)608.
[5]H.C.Bi,G.P.Zhong,S.Zhou,et al.,Determination of adefovir in human plasma by liquid chromatography/tandem mass spectrometry: application to a pharmacokinetic study,Rapid.Commun.Mass Spectrom.19(2005)2911-2917.
[6]H.T.Xie,G.J.Wang,M.J.Xu,et al.,A new LC-MS-MS method for quantitative analysis of adefovir,and its use for pharmacokinetic studies in healthy Chinese volunteers,Chromatographia 71(2010) 587-593.
[7]D Sun,H Wang,B Wang,et al.,Development and validation of a sensitive LC-MS/MS method for the determination of adefovir in human serum and urine,J.Pharm.Biomed.Anal.42(2006)372-378.
[8]J.E Vela,L.Y Olson,A.Huang,et al.,Simultaneous quantitation of the nucleotide analog adefovir,its phosphorylated anabolites and 2’-deoxyadenosine triphosphate by ion-pairing LC/MS/MS,J.Chromatogr.B Analyt.Technol.Biomed.Life Sci.848(2007)335-343.
[9]Z.Xiong,Y.Zhang,F.Qin,et al.,Hydrophilic interaction liquid chromatography-tandem mass spectrometry for the determination of adefovir in human plasma and its application to a pharmacokinetic study,J.Chromatogr.B Analyt.Technol.Biomed.Life Sci.878 (2010)2111-2116.
[10]X.Chen,D.Liu,L.Zhu,et al.,Development and validation of a liquid chromatography/tandem mass spectrometry procedure for the quantification of adefovir in human plasma,Rapid.Commun.Mass Spectrom.19(2005)1893-1898.
[11]Draft Guidance for Industry:Bioanalytical Method Validation.US Department of Health and Human Services,Food and Drug Administration Centre for Drug Evaluation and Research and Centre for Veterinary Medicine,September 2013.〈http://www.fda.gov/down loads/Drugs/GuidanceComplianceRegulatoryInformation/Guidances/ UCM368107.pdf〉.
[12]European Medicines Agency:Guideline on Bioanalytical Method Validation(〈http://www.ema.europa.eu/docs/en_GB/document_library/ Scientific_guideline/2011/08/WC500109686.pdf〉).
[13]HEPSERA®(adefovir dipivoxil)Tablets:Patient Information(〈http:// www.rxlist.com/hepsera-drug/clinical-pharmacology.htm〉).
[14]D.Goswami,A.Khuroo,S.Gurule,et al.,Controlled ex-vivo plasma hydrolysis of valaciclovir to acyclovir demonstration using tandem mass spectrometry,Biomed.Chromatogr.25(2011)1189-1200.
[15]D.Goswami,A.Saha,S.Gurule,et al.,Metaxalone estimation in biological matrix using high-throughput LC-MS/MS bioanalytical method,J.Chromatogr.B.Analyt.Technol.Biomed.Life Sci.902 (2012)132-136.
Received 2 December 2013;revised 25 July 2014;accepted 4 August 2014 Available online 23 August 2014
 Journal of Pharmaceutical Analysis2015年3期
- Journal of Pharmaceutical Analysis的其它文章
- Non-covalent binding analysis of sulfamethoxazole to human serum albumin:Fluorescence spectroscopy,UV-vis,FT-IR,voltammetric and molecular modeling
- Determination of diclofenac in pharmaceutical preparations by voltammetry and gas chromatography methods
- Comparison of conventional and supported liquid extraction methods for the determination of sitagliptin and simvastatin in rat plasma by LC-ESI-MS/MS
- Quality evaluation of synthetic quorum sensing peptides used in R&D
- Extraction,characterization and biological studies of phytochemicals from Mammea suriga
- Selective extraction of dimethoate from cucumber samples by use of molecularly imprinted microspheres
