Investigation of a transonic separating/reattaching shear layer by means of PIV
S.Scharnowski,C.J.Kähler
Institute of Fluid Mechanics and Aerodynamics,Bundeswehr University Munich,Neubiberg,Germany
Investigation of a transonic separating/reattaching shear layer by means of PIV
S.Scharnowski∗,C.J.Kähler
Institute of Fluid Mechanics and Aerodynamics,Bundeswehr University Munich,Neubiberg,Germany
A R T I C L E I N F O
Article history:
Received 25 October 2014
Accepted 8 December 2014
Available online 3 February 2015
Backward-facing step
Shear layer
Reattachment
Particle Image Velocimetry
The separating/reattaching flow over an axisymmetric backward-facing step is analyzed experimentally by means of particle image velocimetry(PIV).The main purpose of the measurements is the investigation of the mean flow field as well as of the Reynolds stress distributions at a Mach number of 0.7 and at a Reynolds number of 3.3×10⁵based on the step height.Due to the strong progress of optical flow measurements in the last years it was possible to resolve all flow scales down to 180µm(≈1%of the step height)with high precision.Thanks to the high spatial resolution it was found for the first time that the Reynolds stress distribution features a local minimum between the first part of the shear layer and a region inside the recirculation region.This implies a more complex wake dynamics than assumed before.
©2015 The Authors.Published by Elsevier Ltd on behalf of The Chinese Society of Theoretical and Applied Mechanics.This is an open access article under the CC BY-NC-ND license(http:// creativecommons.org/licenses/by-nc-nd/4.0/).
The flow around a backward-facing step(BFS)is one of the canonical test cases in aerodynamics which was extensively studied both experimentally and numerically in the last decades.Although the geometry is rather simple,the flow field is relatively complex,as illustrated in Fig.1.The incoming turbulent boundary layer developing along the forebody is forced to separate at the sharp edge.As a result of a Kelvin-Helmholtz instability tiny coherent vortices are generated in the first part of the very thin shear layer which increases in size as they are convecting downstream.According to Simpson[1],the spanwise coherence starts to break down after 3 step heights due to secondary instabilities,and the turbulent structures become fully three dimensional even faster upstream of reattachment.This on average causes a broadening of the shear layer with increasing distance from the point of separation.Due to the enhanced turbulent mixing the shear layer reattaches on the lower wall.The mean flow field is characterized by a large recirculation region,which is separated from the outer region by the dividing streamline.However,the reattachment location is not fixed in space and time due to the dynamic of coherent vortices.Some of the coherent shear layer vortices move into the recirculation region by an adverse pressure gradient,according to Chandrasuda[2]and McGuinness[3]and they interact with the next generation of shear layer vortices or trigger the instability as they disturb the shear layer itself,if they survive sufficiently long before they vanish due to viscosity.Due to this feedback,the shear layer of a backward-facing step differs significantly from a free shear layer.Furthermore,the vortices traveling upstream into the primary recirculation region decay into smaller vortices due to secondary Kelvin-Helmholtz instabilities,or they become larger and weaker due to viscosity effects.Due to the increasing pressure with decreasing distance from the step,the upward motion of the fluid along the lower wall separates again.As a result,a secondary recirculation region is formed on average in the corner of the primary recirculation region with opposite sign of vorticity.
Bradshaw and Wong[4]as well as Eaton and Johnston[5]showed in their review papers that for a 2D BFS the stream-wise extension of the primary recirculation region mainly depends on the step height and on the state of the incoming boundary layer. The reattachment length is between 5 and 7 times the step height for a fully turbulent incoming flow state at the point of separation. This holds for a Reynolds number range of Reh=3000-300 000 based on the step height.Simpson[1]showed in his review paper,that the instantaneous impingement location of the shear layer moves up-and downstream by as much as±2 step heights.The second half of the separated flow region is characterized by a strongly curved shear layer,indicated by the dividing streamline in Fig.1.In this region the shear layer broadens and the Reynolds stresses increase.Eaton and Johnston[5]compared several experiments on 2D models and concluded that the streamwise location with maximum stream-wise Reynolds normal stress and shear stress is close to the reattachment location or slightly upstream.However,it is not evident if this is an artifact of a low measurement resolution or in case it holds true,what is the physical effect that leads to the strong intensity of the Reynolds stresses close to the mean reattachment location.

Fig.1.Backward-facing step flow field.
The early measurements[4,5]were performed by point-like probes(LDAand hot-wire).Thus,they revealed only profiles rather than spatial distributions of the velocity,and they were not able to detect instantaneous flow structures.PIV,on the other hand,allows to measure non-intrusively thousands of 2D or 3D velocity fields within a few seconds.Huang and Fiedler[6]used PIVto study the temporal development of the starting flow of a backwardfacing step in a water tunnel at Reh=4300.They showed that an initially formed regular vorticity street collapses after a short time(t·U/h=17)due to vorticity interaction.More recent experiments[7,8]investigated turbulent structures within instantaneous velocity fields to detect vortices and measure their size and swirling strength at relatively low Reynolds numbers(Reh≈5000).It was shown thatthe size ofspan-wise aligned rollers grows nearly linearly in the first part of the shear layer for a 2D BFS.Furthermore,a significant fraction of counter rotating vortices indicated an early three dimensional breakdown resulting in a varying reattachment location.Le,Moin,and J.Kim[9]also observed this phenomena in direct numericalsimulations(DNS)for a similar test case.
Roshko and Thomke[10]investigated the turbulent reattachment downstream of an axisymmetric step in supersonic flow by means of intrusive pitot probe measurements and non-intrusive schlieren images.They found that the reattachment length is only 2.8-3.7 times the step height for Mach numbers between 2 and 4.5.Bitter et al.[11]performed measurements at Ma=0.7 and presented also a value of 3.7 for this quantity.Low speed experiments also showed a decreased length of the reattachment location[12,13]indicating that the round shape of the model reduces this quantity significantly.The flow over a cylindrical forebody elongated by a second cylinder of smaller diameter and finite length was in the focus of several numerical investigations[14-17]andofexperiments presented in Ref.[18].Depres etal.[18]performed unsteady wallpressure measurements on the elongated cylinder at Mach numbers between 0.6 and 0.85.Two characteristic frequencies were found inthe pressure spectra.The corresponding Strouhal numbers(based on the forebody's diameter d)are Std=0.2 and Std=0.6,which are related to the formation oflarge scale vortices and convection of turbulent eddies in the separated shear layer,respectively.Bitter etal.[11]analyzed the pressure dynamics for a similar model,with a very long base cylinder,using fast-responding pressure-sensitive paint.They showed the spatial distribution of the surface pressure:The maximum amplitude corresponds to a Strouhal number of Std=0.21 and was detected at a location shortly after reattachment.
The aim of this work is the estimation of the mean velocity and the Reynolds stress distribution in the wake of an axisymmetric BFS at a transonic Mach number and a high Reynolds number. Since only little information is available in the literature for such conditions,these statistical flow properties are very important for the validation of new numerical approaches as well as for the comparison of different experiments.To achieve the aim a large amount of statistically independent PIV recordings will be analyzed with high resolution evaluation methods.Only nonintrusive and spatially resolving techniques,like PIV,are suited to provide the required results.

Fig.2.Axisymmetric backward-facing step with rearsting.The laserlightsheetand the field of view(FOV)for high-repetition rate PIV measurements are illustrated. Numerical values are given in mm.
The measurements were performed in the Trisonic Wind tunnel at the Bundeswehr University in Munich.It is a blow down wind tunnel with a test section of 675 mm height,300 mm width and 1200 mm length.The total pressure range of the wind tunnel is pt=(1.2,...,5)bar,leading to a Reynolds number range of Reh≈(1.2,...,12)×105.The Mach number is adjustable between 0.3 and 3.0.The facility is described in detail in Ref.[19].
The tests were performed on a blunt axisymmetric model,sketched in Fig.2.The configuration consists of a 36°cone with a spherical nose of R=5 mm and a cylindrical part with a length of 164.3 mm and a diameter of d=54 mm.The connection between cone and main body is smooth to avoid leading edge separation. The model was made of aluminum and the surface is polished to avoid diffuse reflections at the wall,which would bias the near wall PIV measurements[20,21].A rear sting,21.5 mm in diameter,in the base of the cylinder was used for mounting the model in the middle of the test section of the wind tunnel.Thus the step height is h=16.25 mm.Compared to a strut mounting,applied by van Oudheusden and Scarano[22],the rear sting avoids strong 3D effects on the flow in and around the base region of the model. The model's size is selected to optimize for the blockage effect in the test section of the wind tunnel and the spatial resolution of the PIV measurements.
For the PIV measurements the flow is seeded with DEHS(Di-Ethyl-Hexyl-Sebacat)tracer particles with a mean diameter of 1µm[23].Due to the limited run time of the facility(about 50 s)and the large number of recordings required for the measurement of statistical quantities,a high-repetition rate PIV system was used.The laser beam is shaped into a 1 mm thick light sheet which illuminates the tracer particles on the field of view(FOV),as sketched in Fig.2.21 500 PIV double images,1280×400 px in size,were captured at a Mach number of Ma=0.7 and a total pressure of p0=1.5 bar leading to a Reynolds number of Reh= 3.3×10⁵,based on the step height.The recording frequency was 2 kHz,corresponding to a total measurement time of T=10.75 s. Since the vortex shedding frequency is around 900 Hz[11],the images are considered as uncorrelated,which is essential for the computation of statistical values.
Two different evaluation procedures were applied to the PIV images in order to achieve instantaneous as well as ensemble averaged velocity fields.The first method,window correlation including iterative concepts with window shifting and image deformation[24],allows to compute 21 500 instantaneous velocity fields from which one is shown in Fig.3(a).Here,the spatial resolution is rather low(322px corresponding to 5%of the main body diameter)because each interrogation window should contain at least 6-10 particle images in order to keep the number of spurious vectors at an acceptable level[25,26].The second evaluation approach is the single-pixel ensemble-correlation. It can be used for a large amount of PIV image pairs and results in improved spatial resolution and dynamic spatial range[27,28].Recently,the single-pixelevaluation was further expanded to estimate Reynolds stresses in turbulentflows with nearly singlepixel resolution[29].Furthermore the evaluation technique wasenhanced by compensating bias errors due to curved stream lines[30].
In the following the approaches are used to evaluate the mean velocity as well as the Reynolds stress distribution.The instantaneous velocity fields,computed by window correlation,are used to analyze the shape and size of coherent structures in the model's wake.
Instantaneous flow fields,as shown in Fig.3(a),are unique and not very useful for the comparison of different experiments or for the validation of numerical flow simulation.For this reason the mean velocity distribution is required.Figure 3(b)shows the mean velocity field computed from 21 500 PIV image pairs with singlepixel ensemble-correlation.According to the findings of Kähler et al.[27],the in-plane resolution of the vector field is about 180µm≈0.01h.
The boundary layer upstream of the BFS strongly influences the wake flow topology[4,5].The boundary layer thickness and the free stream velocity at x/h=-0.3 were estimated to beδ99=(0.40±0.02)h=(6.5±0.3)mm and u∞=(237±1)m.s-1,respectively.The displacement thickness at x/h=-0.3 is
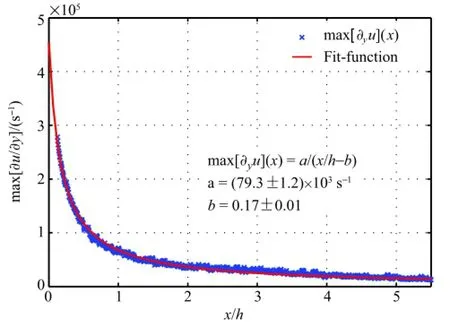
Fig.4.Maximum velocity gradient in the separated shear layer.

leading to a shape factor of H12=δ1/δ2≈1.17.Thus,for the analyzed Mach and Reynolds number combination the boundary layer at the end of the main body is fully turbulent.From the last data points,the near wall gradient was estimated to be∂u/∂y|y=h>8.6×105s-1.Hence,the wall-shear stress can be estimated to

and the friction velocity

where the viscosity and the density areµ=1.66×10⁻⁵Ps.s and ρ=1.43 kg.m-3,respectively.The viscous sub-layer could not be resolved with the chosen setup and evaluation techniques.A higher resolution combined with PTV evaluation techniques,based on those discussed in Cierpka,Scharnowski,and Kähler[21],would be required for this task.
At x/h=0 the separation forms a thin shear layer which broadens further downstream.Fig.4 shows the developmentofthe maximum velocity gradient with respect to the horizontal location estimated from the velocity distribution in Fig.3(b).A reciprocal fit function shows good agreement with the measurement points. The decay of the velocity gradient goes hand in hand with a growing shear-layer thickness,which reaches values in the order of the step height downstream of reattachment.At x/h=3.52±0.10 the ensemble-averaged flow reattaches on the rear sting,which is slightly shorter than numerical predictions presented by Deck and Thorigny[14].The difference might be due to differences in the turbulence level of the incoming and boundary layer flow along the model,as discussed in Isomoto and Honami[31]or the disturbances in the recirculation region are not high enough in the numerical simulation.Inside the dividing streamline a distinct recirculation region develops,wherein the maximum mean upstream velocity is≈88 m s-1.
Besides the mean velocity distribution,analyzed in the previous section,the velocity fluctuations are essential to characterize the flow over the BSF and to compare to other experiments or to validate turbulence models used for CFD simulations.Fig.5 shows the distribution ofthe Reynolds normalstress in the axialdirection,in the radial direction,and the Reynolds shear stress computed by using the single-pixel approach.This method allows for the reliable estimation of Reynolds stresses without spatial lowpass filtering,by analyzing the shape of single-pixel correlation functions.The evaluation procedure was developed by the authors and is discussed in detail in Scharnowski,Hain,and Kähler[29].
The normal stress in the axial direction,in Fig.5(a),has a maximum around x/h≈2.5 and it decreases towards the upstream part of the recirculation region as well as for locations downstream of reattachment,in agreement with the findings of Eaton and Johnston[5].Additionally,the shear layer shortly after separation shows high stress values.The stress distribution clearly shows two maxima and a valley in between at y/h≈0.75 within the recirculation region.The two regions of high stress intensity with the valley in between were not reported in the works based on point-wise measurements[4,5].Also,more recent PIV measurements by Hudy et al.[13]and Bitter et al.[19]did not resolve this topology,due to the limited spatial resolution and spatial low-pass filtering.Recently,Weiss and Deck[32]detected a similar distribution with two maxima in numerical flow simulations.Scharnowski et al.[33]analyzed the spatialdistribution ofvortices in the models wake and showed that the double peak structure in the streamwise Reynolds stress distribution is a result of the mean vortexdistribution.They detected a very high density of vortices in the developing shear layer and a small region just below in that the amount of detected vortices is significantly lower.This region corresponds to the local minimum in the stress distributions from Fig.5(a).Furthermore,the single-pixel evaluation detects increasing stresses near the surface of the rear sting at y/h=0.The high stress values at the reattachment location are caused by the strong fluctuation of the reattachment line.Profiles of the axial Reynolds stress at the location ofreattachmentpresented in the literature[8,5,13]are in good qualitative agreement with those in Fig.5(a). However,they did not report a strong increase in the near wall region.
The maximum position of the Reynolds normal stress in the radial direction,in Fig.5(b),is shifted downstream to x/h≈3.3 compared to that of the u′2-distribution.In the radial direction,the v′2-distribution has its maximum at y/h≈0.3 close to reattachment.Figure 5(b)shows not a very deep valley,as in the case of u′2,but two inflection points around y/h≈0.7 can be clearly resolved.
The Reynolds shear stress distribution in Fig.5(c)is mainly negative within the separated region leading to turbulence production.The maximum position of the u′v′distribution is around x/h≈3.6,which is in agreementwith the findings ofEaton and Johnston[5].The line plots within the recirculation region in Fig.5(c)show again two maxima around y/h=0.7.The primary maximum at y/h≈0.9 corresponds to the oscillating shear layer and the secondary one at y/h≈0.5 is a result of the higher probability of vortices in the recirculation region,as discussed in Ref.[33].
To examine the relation between vortical motion and Reynolds stresses,the two pointcorrelation function was calculated fromthe instantaneous velocity fields.For the velocity component ui,the two-point correlation coefficient is defined as

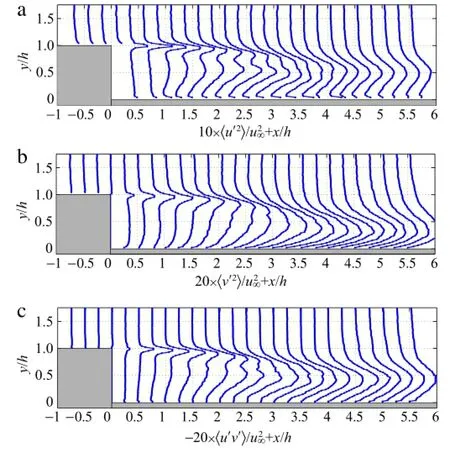
Fig.5.Distribution of the Reynolds normal stresses in(a)the axial direction,in(b)the radial direction,and(c)the Reynolds shear stress estimated from the shape of the correlation functions using single-pixel ensemble-correlation.
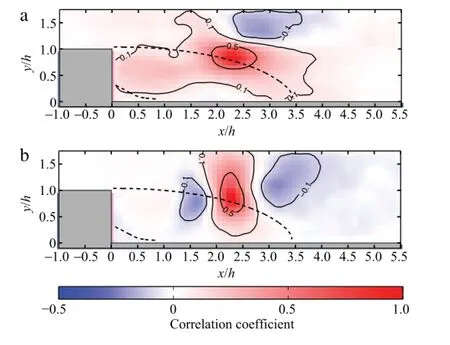
Fig.6.Two-point correlation of the axial(a)and radial(b)velocity component for a characteristic location in the shear layer.Dividing streamlines of the primary and secondary recirculation regions are indicated by dashed lines.

Figure 6 shows the spatial distribution of the two-point correlation coefficient of the axial Ruuand radial velocity component R vv for a characteristic location in the shear layer.It can be seen from Ruu(Fig.6(a))that large coherent structures develop in the separated region.The shape of the structures reveals a direct connection between both sides of the dividing stream line,leading to the conclusion thatvortices inside and outside the recirculation region are coherent with each other.
In Fig.6(b),the two-point correlation of the vertical velocity component Rvvis illustrated.The negative correlation next to the maximumindicates vortices with their center axis aligned perpendicular to the measurementplane:The verticalvelocity component in the upstream and downstream part of a vortex are of opposite sign,which causes a negative correlation coefficient.Additionally,the correlation with the previous and the following vortex can be seen from the neighboring extrema in the Rvv-distribution.Thus,it can be concluded that the shear layer vortices are generated more or less periodically as expected from the Kelvin-Helmholtz instability.The distance between neighboring minimum and maximum in R vv grows with increasing distance from the model's base as the Kelvin-Helmholtz vortices grow in size.Figure 7 shows this distance with respect to the horizontal position x/h for shear layer vortices at y/h=1.Whereλis the distance between the maximum and the minimum and the corresponding x-location in Fig.7 is the mean between the center position of both extrema.The distance 2λis the mean separation oftwo coherentvortices,which increases nearly linearly with x,as can be seen from the figure.From this it can be concluded that the size of the vortices in the shear layer grows linearly and the vortices are accelerated while traveling downstream.Both effects resultin a constant Strouhalnumber.
Due to improved PIV evaluation methods it was possible to estimate turbulence statistics in the wake of a axisymmetric backward-facing step flow without spatial low-pass filtering at a Mach number of 0.7 and at a Reynolds number of 3.3×10⁵. A low magnification imaging approach combined with singlepixel ensemble-correlation allows to achieve a very large dynamicspatial range and high accuracy required to resolve the strong flow gradients.
The mean flow field of the axisymmetric backward-facing step features a recirculation region that extends more than one model diameter in the axial direction in accordance with the literature. The shear layer reattaches on the model's rear sting at x/h= 3.52 which matches well with previous investigations by other authors at low Ma numbers.The motion of the separated shear layer causes an increase in the velocity fluctuations and thus in the Reynolds stress level.Between the shear layer and the primary recirculation region a distinct valley in the stress distributions was found.Two-point correlation of the in-plane velocity components revealed large coherent structures in the recirculation region.A periodic generation of shear layer vortices was found and the spatial separation between coherent structures was determined. The results are very important for the validation of new numerical methods as well as for a better understanding of the flow physics.
This work was supported by the German Research Foundation DFG in the framework of the TRR40.Technical language revisions by Rodrigo Segura are also appreciated.
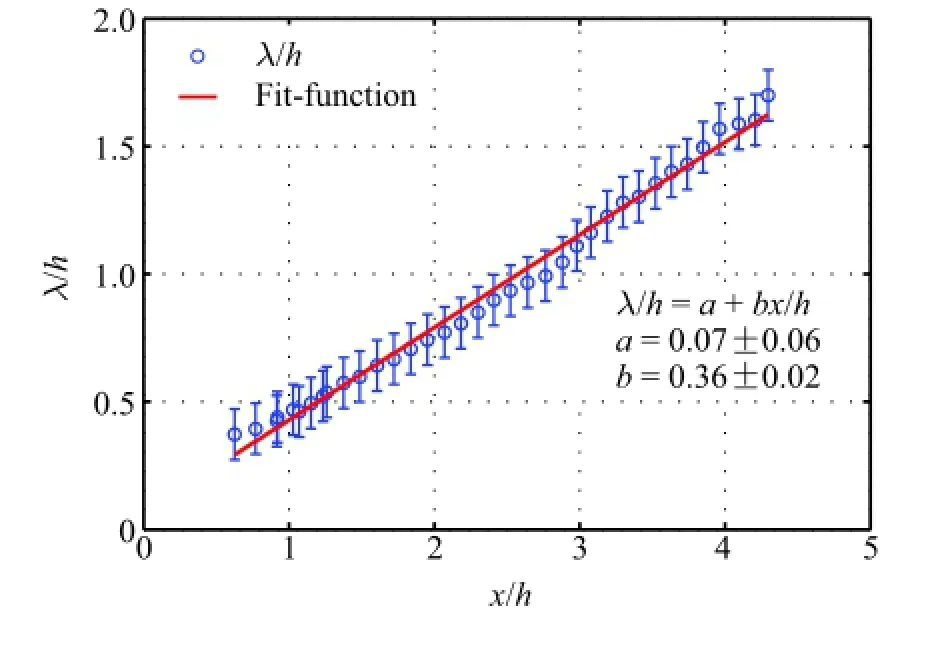
Fig.7.Separation between neighboring coherent structures estimated from the distance between minimum and maximum of Rvvas shown in Fig.6(b).
[1]R.L.Simpson,Turbulent boundary-layer separation,Annu.Rev.Fluid Mech.21(1989)205-234.
[2]C.Chandrasuda,A reattaching turbulent shear layer in incompressible flow(Ph.D.thesis),Imperial College London,University of London,1975.
[3]M.McGuinness,Flow with a separation bubble:steady and unsteady aspects(Ph.D.thesis),University of Cambridge,1978.
[4]P.Bradshaw,F.Y.F.Wong,The reattachment and relaxation of a turbulent shear layer,J.Fluid Mech.52(1972)113-135.http://dx.doi.org/10.1017/ S002211207200299X.
[5]J.K.Eaton,J.P.Johnston,A review of research on subsonic turbulent flow reattachment,AIAA J.19(1981)1093-1100.http://dx.doi.org/10.2514/3. 60048.
[6]H.T.Huang,H.E.Fiedler,A DPIV study of a starting flow downstream of a backward-facing step,Exp.Fluids 23(1997)395-404.http://dx.doi.org/10. 1007/s003480050127.
[7]F.Scarano,C.Benocci,M.L.Riethmuller,Pattern recognition analysis of the turbulentflow pasta backward facing step,Phys.Fluids11(1999)3808.http:// dx.doi.org/10.1063/1.870240.
[8]C.Schram,P.Rambaud,M.L.Riethmuller,Wavelet based eddy structure education from a backward facing step flow investigated using particle image velocimetry,Exp.Fluids 36(2004)233-245.http://dx.doi.org/10.1007/ s00348-003-0695-9.
[9]H.Le,P.Moin,K.J.Kim,Direct numerical simulation of turbulent flow over a backward facing step,J.Fluid Mech.330(1997)349-374.http://dx.doi.org/10. 1017/S0022112096003941.
[10]A.Roshko,G.J.Thomke,Observations of turbulent reattachment behind an axisymmetric downstream-facing step in supersonic flow,AIAA J.4(1966)975-980.
[11]M.Bitter,T.Hara,R.Hain,D.Yorita,K.Asai,C.J.Kähler,Characterization of pressure dynamics in an axisymmetric separating/reattaching flow using fast-responding pressure-sensitive paint,Exp.Fluids 53(2012)1737-1749. http://dx.doi.org/10.1007/s00348-012-1380-7.
[12]L.M.Hudy,A.M.Naguib,J.W.M.Humphreys,Wall-pressure-array measurements beneath a separating/reattaching flow region,Phys.Fluids 15(2003)706-717.http://dx.doi.org/10.1063/1.1540633.
[13]L.M.Hudy,A.M.Naguib,W.M.Humphreys,S.M.Bartram,Particle image velocimetry measurements of a two/three-dimensional separating/reattaching boundary layer downstream of an axisymmetric backward-facing step,in: 43rd AIAA Aerospace Sciences Meeting and Exhibit,Reno,NV,United States,10-13 Jan,2005.
[14]S.Deck,P.Thorigny,Unsteadiness of an axisymmetric separating-reattaching flow:Numerical investigation,Phys.Fluids 19(2007)065103.http://dx.doi. org/10.1063/1.2734996.
[15]P.E.Weiss,S.Deck,J.C.Robinet,P.Sagaut,On the dynamics of axisymmetric turbulent separating/reattaching flows,Phys.Fluids 21(2009)075103. http://dx.doi.org/10.1063/1.3177352.
[16]J.H.Meiss,W.Schröder,Large-eddy simulation of the base flow of a cylindrical space vehicle configuration,in:6th European Symposium on Aerothermodynamics for Space Vehicles,Versailles,France,2008.
[17]V.Statnikov,C.Glatzer,M.Meinke,W.Schröder,EUCASS Flight Physics Book,Vol.5,2012.
[18]D.Depres,P.Reijasse,J.P.Dussauge,Analysis of unsteadiness in afterbody transonic flows,AIAA J.42(2004)2541-2550.
[19]M.Bitter,S.Scharnowski,R.Hain,C.J.Kähler,High-repetition-rate PIV investigations on a generic rocket model in sub-and supersonic flows,Exp. Fluids 50(2011)1019-1030.http://dx.doi.org/10.1007/s00348-010-0988-8.
[20]C.J.Kähler,U.Scholz,J.Ortmanns,Wall-shear-stress and near-wall turbulence measurements up to single pixel resolution by means of longdistance micro-PIV,Exp.Fluids 41(2006)327-341.http://dx.doi.org/10.1007/ s00348-006-0167-0.
[21]C.Cierpka,S.Scharnowski,C.J.Kähler,Parallax correction for precise near-wall flow investigations using particle imaging,Appl.Opt.52(2013)2923-2931. http://dx.doi.org/10.1364/AO.52.002923.
[22]B.W.van Oudheusden,F.Scarano,PIV investigation of supersonic base-flowplume interaction,in:A.Schröder,C.E.Willert(Eds.),Topics in Applied Physics,Springer Verlag,2008,pp.465-474.
[23]C.J.Kähler,B.Sammler,J.Kompenhans,Generation and control of particle size distributions for optical velocity measurement techniques in fluid mechanics,Exp.Fluids 33(2002)736-742.http://dx.doi.org/10.1007/s00348-002-0492-x.
[24]M.Stanislas,K.Okamoto,C.J.Kähler,J.Westerweel,F.Scarano,Main results of the third international PIV Challenge,Exp.Fluids 45(2008)27-71. http://dx.doi.org/10.1007/s00348-008-0462-z.
[25]M.Raffel,C.E.Willert,S.T.Wereley,J.Kompenhans,Particle Image Velocimetry:a Practical Guide,Springer Verlag,2007.
[26]R.J.Adrian,J.Westerweel,Particle Image Velocimetry,Cambridge University Press,2010.
[27]C.J.Kähler,S.Scharnowski,C.Cierpka,On the resolution limitofdigitalparticle image velocimetry,Exp.Fluids 52(2012)1629-1639.http://dx.doi.org/10. 1007/s00348-012-1280-x.
[28]C.J.Kähler,S.Scharnowski,C.Cierpka,On the uncertainty of digital PIV and PTV near walls,Exp.Fluids 52(2012)1641-1656.http://dx.doi.org/10.1007/ s00348-012-1307-3.
[29]S.Scharnowski,R.Hain,C.J.Kähler,Reynolds stress estimation up to singlepixel resolution using PIV-measurements,Exp.Fluids 52(2012)985-1002. http://dx.doi.org/10.1007/s00348-011-1184-1.
[30]S.Scharnowski,C.J.Kähler,On the effect of curved streamlines on the accuracy of PIV vector fields,Exp.Fluids 54(2013)1435.http://dx.doi.org/10.1007/ s00348-012-1435-9.
[31]K.Isomoto,S.Honami,The effect of inlet turbulence intensity on the reattachment process over a backward-facing step,J.Fluids Eng.111(1989)87-92.
[32]P.Weiss,S.Deck,Numerical investigation of the robustness of an axisymmetric separating/reattaching flow to an external perturbation using ZDES,Flow Turbul.Combust.91(2013)697-715.http://dx.doi.org/10.1007/ s10494-013-9484-6.
[33]S.Scharnowski,V.Statnikov,M.Meinke,W.Schröder,C.J.Kähler,Combined experimental and numerical investigation of a transonic space launcher wake,in:5th European Conference for Aeronautics and Space Sciences EUCASS,Munich,Germany,2013.
∗Corresponding author.
E-mail address:sven.scharnowski@unibw.de(S.Scharnowski).
*This article belongs to the Fluid Mechanics
 Theoretical & Applied Mechanics Letters2015年1期
- Theoretical & Applied Mechanics Letters的其它文章
- Adjoint-based optimization of flapping plates hinged with a trailing-edge flap
- Numerical simulation of unsteady flows over a slow-flying bat
- Propulsive performance of two-and three-dimensional flapping flexible plates
- Learning from bat:Aerodynamics of actively morphing wing
- A coupled immersed boundary-lattice Boltzmann method and its simulation for biomimetic problems
- A modified criterion for wave-induced momentary liquefaction of sandy seabed
