
In-situ synthesized mesoporous TiO2-B/anatase microparticles:Improved anodes for lithium ion batteries☆
2015-11-13 02:32WeiZhuangLinghongLuWeiLiRongAnXinFengXinbingWuYudanZhuXiaohuaLu
Wei Zhuang,Linghong Lu*,Wei LiRong AnXin FengXinbing WuYudan ZhuXiaohua Lu*
1State Key Laboratory of Materials-Oriented Chemical Engineering,College of Chemistry and Chemical Engineering,Nanjing Tech University,Nanjing 210009,China
2National Engineering Technique Research Center for Biotechnology,College of Biotechnology and Pharmaceutical Engineering,Nanjing Tech University,Nanjing 211816,China
Keywords:
A B S T R A C T
1.Introduction
Lithium ion batteries have attracted increasing attentions because of their important role in the stationary energy storage systems for smart grids and electric vehicle batteries[1,2].However,the current lithium ion batteries employing carbonaceous materials as anodes are inadequate to meet the requirements of high power,large energy capacity and safety because of material-related issues[3,4].Variousnanomaterials such as carbon nanotubes,graphene,carbon nanofibres and titanates have been developed to improve the performance of batteries[5,6].Titanates have a higher lithium intercalation/deintercalation potential at approximately 1.5 V versus Li+/Li,which can effectively avoid safety problems[6,7].TiO2,which has multiple polymorphs,including anatase,rutile,brookite,and TiO2-B,has succeeded as one of the most fascinating materials in the modern era[8,9].In these four phases,anatase and TiO2-B provide a nearly theoretical specific capacity of 335 mA·h·g-1(LiTiO2)as lithium insertion hosts[10-12].Because of its high insertion voltage and low toxicity,anatase is suggested as an alternative anode material for lithium ion batteries and shows improved capacity retention and safe operation[13].
Different morphologies of anatase have been prepared,such as nanotube,nanofiber,nanoparticle and mesoporous structure[7,14].They all perform equivalently well as anode materials in the secondary rechargeable lithium ion batteries[15,16].However,anatase suffers from relatively poor rate performance,probably due to its dense crystal structure[17].Recent researches have showed that the lithium ion storage capacity of TiO2-B is larger than that of anatase(335mA·h·g-1corresponding to the insertion of one Li per TiO2inducing a complete reduction Ti4+→Ti3+)and it is safe against overcharging[18,19].However,TiO2-B is a metastable crystalline phase,which can gradually convert to anatase,degrading both structure stability and lithium intercalation stability of TiO2-B[10,20,21].Therefore,developing novel low-cost TiO2anode materials with long term cycling stability,large capacity,and excellent rate performance is still a challenge.
Excellent rate capability and stability are contributed by high lithium ion diffusion rate in both bulk and interface of materials[22].A small particle size and a large surface area can significantly reduce the diffusion distance of lithium ions in the bulk phase,increasing charge and discharge rates and decreasing volumetric changes and lattice stresses.Another similar strategy is to fabricate mesoporous materials for improving the kinetics of storage reactions[14,23].The transfer of electron can be effectively improved through interface modification,such as surface carbon coating[24],metal coating[25]and non-metallic element lattice doping[26].However,it is difficult to improve lithium ion diffusion performance of anode materials[27,28].Recently,heterojunction composites have been proposed to enhance lithium ion interface transfer,especially those with lattice matched heterojunction interface modification[29,30].
In this work,we start a controllable synthesis method for preparing mesoporous nanostructured TiO2materials with TiO2-B/anatase heterojunction interface.Such TiO2nanocomposite electrode material may combine the advantages of both anatase and TiO2-B polymorphs.TiO2-B phase accelerates the diffusion of charges through the interface,while the anatase phase maintains the capacity stability.The rate capability and cycling performance are also characterized.
2.Experimental
2.1.Sample preparation
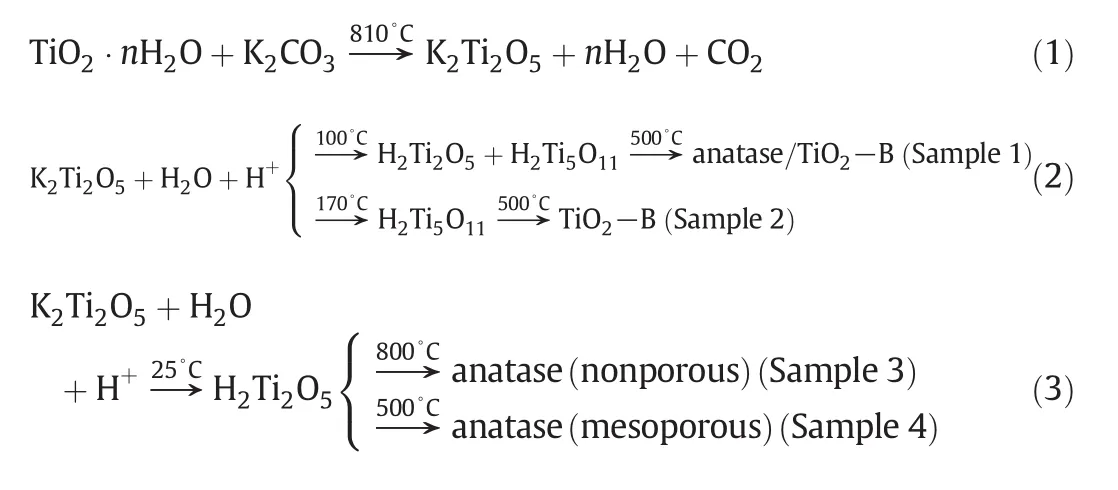
Titania with various structures has been successfully synthesized by the template-free and soft chemical method[31,32].The summary of the preparation method is as follows.(I)Preparation of K2Ti2O5:a TiO2/K2O mixture with molar ratio of 1.9 was prepared by uniformly adding K2CO3(reagent grade)to TiO2·nH2O and then sintered at 810°C for 2 h,described by reaction(1).(II)Hydration and ion exchange of K2Ti2O5:by controlling hydration temperatures at 25°C,100 °C and 170 °C,three types of intermediates can be obtained after ion exchange,H2Ti2O5,H2Ti5O11/H2Ti2O5and H2Ti5O11materials,respectively,as shown by reactions(2)and(3).It needs to be noted that the phase transition under certain conditions for preparation of K2Ti2O5is a non-uniform phase transition in the solid-liquid interface.Hydrated K2Ti2O5was suspended in 100 ml of vigorously stirred 0.1 mol·L-1HCl solution until K+ions were completely exchanged.The product was filtered and washed with distilled water and dried in a desiccator at 60°C under vacuum.Residual of K+<0.2%(by mass)in the final product,detected by inductively coupled plasma-mass spectrometry(ICP-MS).(III)Thermal treatment of hydrated titanate:the dried samples were calcinated in a muffle oven at 500°C in air for 2 h.After natural cooling,anatase,TiO2-B and TiO2-B/anatase composite were synthesized,described by reactions(2)and(3).
2.2.Characterization
The material crystal phase was determined by powder X-ray diffraction(XRD,Bruker D8,CuKαradiation)and Raman spectra(Super LabRam).The textural properties were studied by N2adsorption-desorption measurements(ASAP 2020M)at a liquid nitrogentemperature.The sample morphology and microstructure were observed by scanning electron microscopy(SEM,Hitachi S-4800)and transmission electron microscopy(TEM,Philips Tecnai G2 20)at 200 kV.
2.3.Electrochemical performance
All electrochemical measurements were done in Swagelok type cells with pure lithium foil as the counter and reference electrode and Whatman glass fiber as the separator.For preparation of working electrode,a slurry was prepared by mixing the active material,Super P carbon(Alfa Aesar)and PVdF(Kynar flex)in a mass ratio of 85:8:7 in N-methyl-pyrrolidone.The slurry was cast on a copper foil(Alfa Aesar,

Fig.1.(a)FE-SEM image of Sample 1 with microparticle morphology;(b)magnified FE-SEM image with mesoporous structure(inset:N2adsorption-desorption curves of Sample 1);(c)TEM image of Sample 1 constituted with nanocrystals(inset:selected area electron diffraction result);(d)HRTEM image of Sample 1 with anatase nanocrystals packaged with TiO2-B thin layer and conformed heterojunction structure[inset:schematic diagram of distributed TiO2-B with cross-sectional view(left)and surface view(right)].

Table 1 Specific surface area,pore volume and most probable pore size of different samples
thickness 0.05 mm)and was dried in vacuum at 100°C for 24 h.The electrolyte used for the above cell con figuration was 1 mol·L-1LiPF6in a mixture of ethylene carbonate(Aldrich)and dimethyl carbonate(Aldrich)(mass ratio of 1:1).The galvanostatic charge-discharge characteristics of the cells were recorded over the voltage range between 1.0 V and 3.0 V using a NEWARE BTS-5 V50 mA computer controlled battery test station at different rates of 1-40 C at room temperature(25°C).1C is equivalent to 330mA·g-1for titania.Cyclic voltammetry was performed in the voltage range of 1.0-3.0 V using an advanced electrochemical system of Autolab 302 N at a scanning rate of 0.1 mV·s-1.
3.Results and Discussion
3.1.Morphology and structural properties
Mesoporous TiO2-B/anatase nanocomposite particles(Sample 1)with a high surface area were synthesized by the template-free soft chemistry method.Reference samples were prepared with similar methods,including mesoporous TiO2-Bparticles(Sample2),nonporous anatase particles(Sample3)and mesoporous anatase particles(Sample 4).The microstructure of samples was characterized by FE-SEM and N2adsorption/desorption isotherms.As shown in Fig.1(a),Sample 1 exhibits microparticle morphology with densely distributed mesopores.InFig.1(b),Sample1 presents loosely aligned about 30 nm nanocrystals with around 10 nm mesopores.N2adsorption-desorption isotherms[the inset of Fig.1(b)]of Sample 1 indicate the presence of well developed mesoporosity.The textural properties of other samples calculated by BET and BJH method are summarized in Table 1.All the three mesoporous samples have a similar surface area and a pore structure.It allows us to exclude the electrochemical performance differences caused by the surface area and pore structure of these samples.TEM result of Fig.1(c)shows that Sample 1 is combined by connecting nanocrystals,with anatase and TiO2-B coexisting.HRTEM image[Fig.1(d)]gives the evidence of bi-crystalline structure of Sample 1 with typical TiO2-B distributed on anatase crystal lattice surface and conforms to the heterojunction structure.
The crystalline phase of the samples was investigated by powder X-ray diffraction(XRD)analyses,as shown in Fig.2(a).Five distinct diffraction peaks of Samples 1,3 and 4 can be indexed to anatase(JCPDF 21-1272).Peaks corresponding to the TiO2-B phase(JCPDF 35-0088)are not observed for these three samples because the amount is very low and the distribution is uniform.The diffraction peaks of Sample 2 are mainly ascribed to the TiO2-B phase.Raman spectra as shown in Fig.2(b)reveal that TiO2-B and anatase coexist in Sample 1,while Samples 3 and 4 are pure anatase phase and Sample 2 is pure TiO2-B phase.In Fig.2(c),a low peak belonging to TiO2-B phase is observed on the partial magnified XRD patterns of Sample1 with TiO2-Band anatase phases coexisting,con firming the low amount of TiO2-B.However,no peak in this area is seen for other samples.UV Raman spectroscopy is found to be more sensitive to the surface phase of a solid sample that absorbs UV light[33].We can see in Fig.2(d)that the characteristic peaks of TiO2-B detected by UV Raman spectroscopy are stronger than visible Raman spectroscopy.These confirm that Sample 1 is TiO2-B surrounded anatase.

Fig.2.(a)XRD patterns of samples and standard peak spectra of anatase and TiO2-B;(b)Ramanspectra(incident light laser:514 nm)of different TiO2samples;(c)partial XRD patterns of samples;(d)Raman spectra of Sample 1 at different incident light lasers.

Fig.3.Calibrated curves of the intensity of Raman spectra and mass percent(a)and content analysis(b)of TiO2-B in Sample 1.
We correlate the Raman areas of anatase and TiO2-B main peaks to the relative proportions of both polytypes,as shown in Fig.3(a).The standard curve plotted by Eq.(4)characterized with a 514 nm laser as the incident light agrees well with reported results in literature.

The ratios IA/(IA+IB),where IAand IBare the Raman peak areas of 144 and 123 cm-1of anatase and TiO2-B,respectively,are plotted against the mass anatase percentage in Fig.1(c).The content of TiO2-B calculated from the standard curve is only about 5%,as shown in Fig.3(a)(star).The analysis process of TiO2-B in Sample 1 is shown in Fig.3(b).
3.2.Electrochemical performance
The electrochemical performance of these materials was evaluated in lithium half-cells.The activity materials were coated on Cu foil,with thickness about 15 μm and loading amount about 2 mg·cm-2.Fig.4(a)shows the discharge capacities of different samples at the current rate of 130 mA·g-1within a cut-off window of 1.0-3.0 V.The capacity is divided into three parts:homogeneous bulk lithium insertion,bulk intercalation storage and pseudocapacitive(interfacial)storage[34].Samples 3 and 4 presenta close bulk intercalation capacity of up to 140 mA·h·g-1.As the heat treatment temperature increases,nanoparticle size grows,so the mesoporous structure disappears and the surface area decreases.Therefore,the surface lithium capacity stored in the form of pseudocapacitance in Sample 3 is lower than that in Sample 4.Comparison between Samples 4 and 2 clearly shows the superiority in lithium capacity of TiO2-B material as compared to anatase,which is consistent with previous reports[35,36].As shown in Fig.A1,TiO2-B/anatase nanocomposite of Sample 1 presents the capacity between Samples 2 and 4,indicating the enhanced capacity due to the TiO2-B phase.As discussed above,the 5%(by mass)TiO2-B contributes 20%improvement compared to the anatase counterpart of Sample 4.

Fig.4.Electrochemical properties of TiO2samples.(a)Discharge curves at 130 mA·g-1(A:homogeneous Li insertion into the bulk;B:bulk intercalation reaction;C:pseudo-capacitive(interfacial)storage);(b)cyclic voltammograms of Samples 1 and 4 at the scan rate of 0.1 mV·s-1between 1.0 and 3.0 V;(c)rate performance at the rates of 1 C to 40 C of Samples 1 and 4;(d)cycling performance of Sample 1 compared to other samples at the current rate of 1 C(1 C=330 mA·g-1).
The cyclic voltammogram[CVs,Fig.4(b)]pro files of Samples1 and 4 show pairs of cathodic/anodic peaks at 1.70 V/2.05 V,attributing to the reversible transition of lithium-ion in anatase phase.In addition,two additional pairs of peaks with formal potentials in the range of 1.5-1.6 V appear in the CVs of Sample 1.This can be assigned to the pseudocapacitive behavior of lithium storage in TiO2-B phase lattice attributing to the oxidation/reduction of Ti3+/Ti4+along with the lithium insertion/extraction[1].By analyzing the differential capacity increment curve of the charge branch(Fig.A2),the contribution of TiO2-B to the total lithium storage is 20%,which is much higher than its mass content of 5%.This indicates that the TiO2-B phase in Sample 1 plays key roles for maintaining the capacity by the fast pseudocapacitive process of lithium storage and synergistically enhancing the lithium capacity because of its uniform distribution and specific TiO2-B/anatase heterojunction interfaces[37].
Fig.4(c)gives clear results for rate performance of samples.All the anatase containing samples show good capacity retentions higher than 90%attributed to the structure stability of anatase polymorph,while that of singlephase TiO2-B(Sample2)is less than 85%.The results suggest that Sample 1 has high capacity and excellent stability of lithium ion intercalation and de-intercalation.Interestingly,the irreversible capacity of Sample 1 accounts for 17.5%,less than 18.7% of Sample 2,i.e.Sample 1 gives better stability than Sample 2.The capacity and stability are further investigated by cycling charge-discharge performance at different current rates(1 C=330 mA·g-1),as shown in Fig.4(d).The results reveal that the lithium-half cells assembled(Sample 1)exhibit high Li+storage capacity(208 mA·h·g-1at 1 C)and superior rate performance,which is much better than those of anatase counterpart Sample 4 as well as other anatase nanomaterials reported in literature,such as 154 mA·h·g-1for mesoporous nanospheres[38],165 mA·h·g-1for anatase nanoporous mesocrystals,and 115 mA·h·g-1for anatase nanoparticles[16].
Such TiO2nanocomposite electrode material combines the advantages of both anatase and TiO2-B polymorphs.Surprisingly,this trace of 5%(by mass)TiO2-B determined by Raman spectra brings the first discharge capacity of this material to 247 mA·h·g-1(vs.205 mA·h·g-1of the anatase counterpart)at the current rate of 130 mA·g-1.Stability testing at 1 C reveals that the capacity maintains at 171 mA·h·g-1,which is better than 162 mA·h·g-1for single phase anatase or 159 mA·h·g-1for TiO2-B.The rate capability is significantly higher than pure anatase material,from 80 mA·h·g-1to 100 mA·h·g-1at 40 C,increased by 25%.
The improved performance may be attributed to the combination effects of mesoporous anatase structures,open lattice channel of TiO2-B and TiO2-B/anatase heterojunction interfaces,as shown in Fig.5.The primary crystal phase of anatase provides the capacity stability owing to the structural stability.The existence of mesoporous structures shortens the diffusion distance of lithium ions,increases the contact area with electrolyte,and significantly improves the capacity.The structure of the surface layer of TiO2-B(010)crystal face with a larger lattice channel is beneficial to the transfer of lithium ions.Regarding the lithium-ion adsorption of TiO2-B(010),quantitative calculation results show that the surface of crystal channels plays an important role in lithium ion penetration into the materials.The structure accelerates the diffusion of charges within the interface and bulk of materials.At the TiO2-B/anatase heterojunction interfaces,lattice and band-gap matched structures provide an ideal connection of the two individual components in the composite,rendering synergistically enhanced performance.The structure speeds up the diffusion of lithium ions and electrons within the interface and materials,and structural stability of the anatase core increases the capacity stability.
4.Conclusions
TiO2-B/anatase microparticles were synthesized through a templatefree and soft chemistry method.5%(by mass)of TiO2-B gives 20%improvement in the first discharge capacity compared to the anatase counterpart.Stability testing reveals that the nanocomposite is more stable than the TiO2-B counterpart.This nanocomposite also shows superior rate performance,with100mA·h·g-1at40C,increased by nearly 25%compared to pure anatase.The superior lithium storage performance is attributed to the mesoporous structure offering a large electrode-electrolyte contact area and a specific TiO2-B/anatase interface facilitating electronic transport along and across the interface.Thus the developed novel microparticle electrode material processes the advantages of both anatase and TiO2-B polymorphs with a mesoporous nanostructure and a heterojunction interface,meeting the demands of electric vehicle batteries and other stationary energy storage applications.
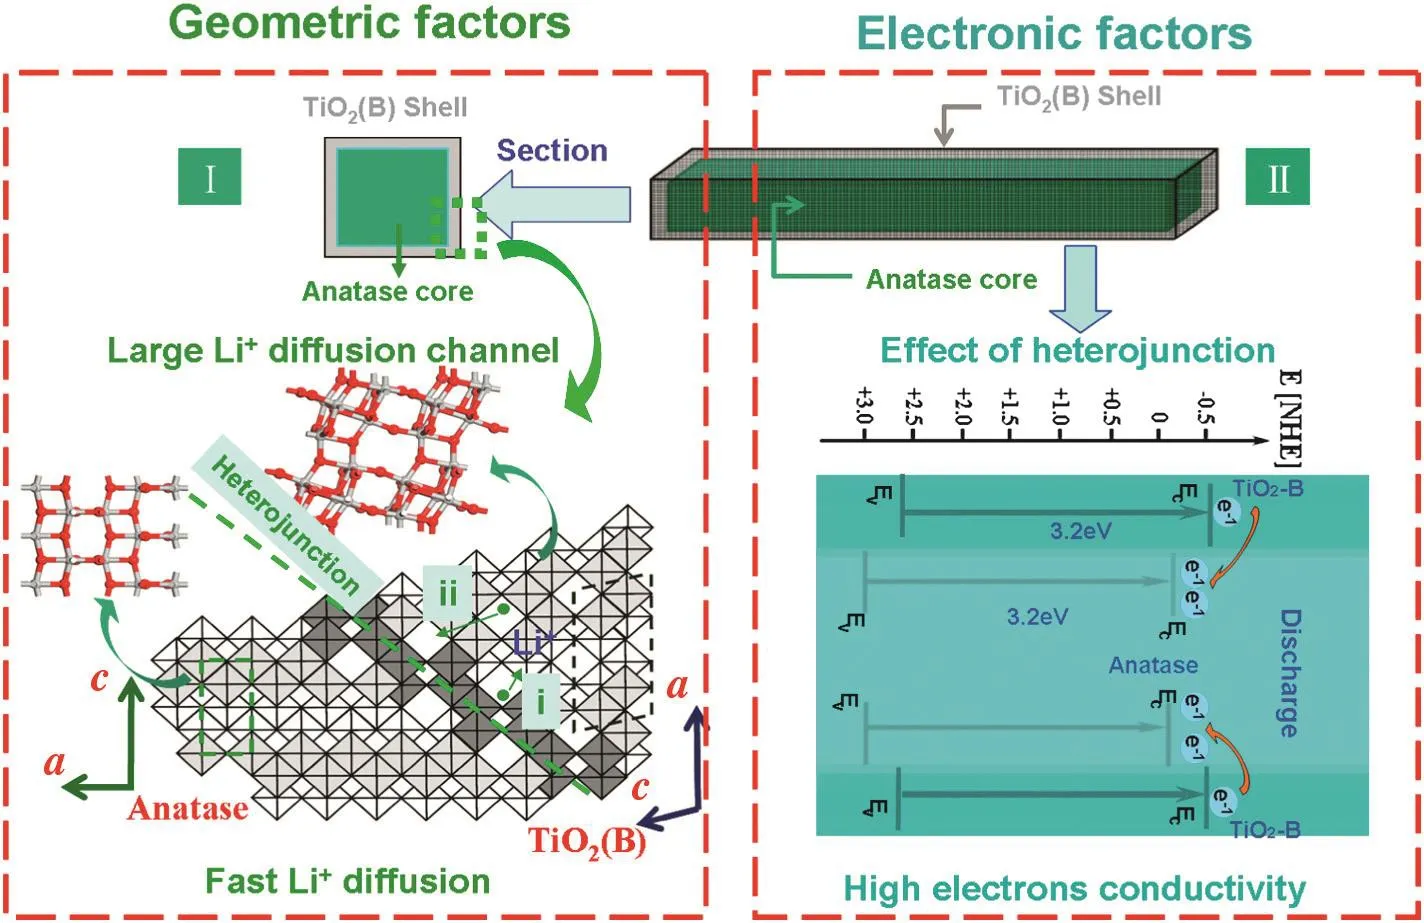
Fig.5.Schematic illustration of the relationship between structure and performance of mesoporous TiO2-B/anatase microparticles composed of nanocrystals.(I)Geometric factors:TiO2-B shell with large Li+diffusion channel enhancing the diffusion rate;(II)electronic factors:the heterojunction structure between TiO2-B and anatase promoting electronic conductivity.
Appendix
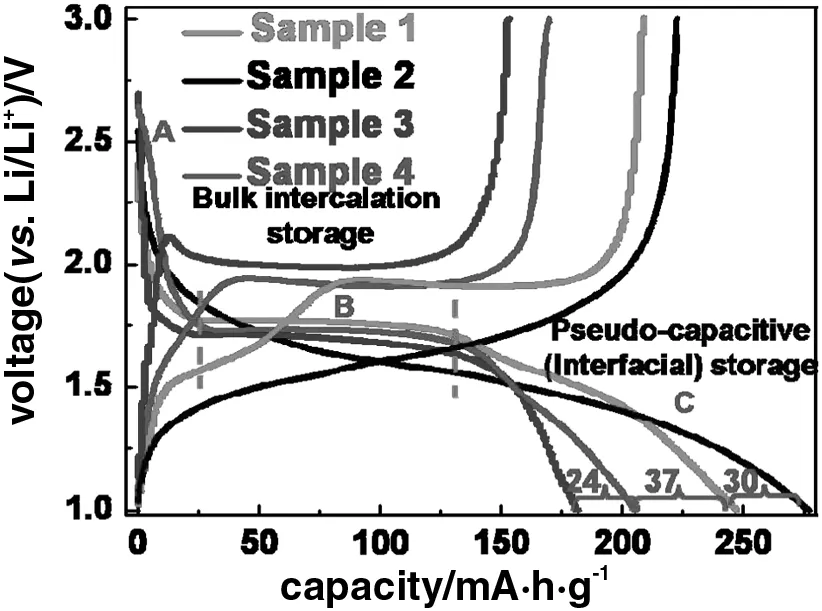
Fig.A1.Discharge-charge curves of the samples at the current rate of 130 mA·g-1.
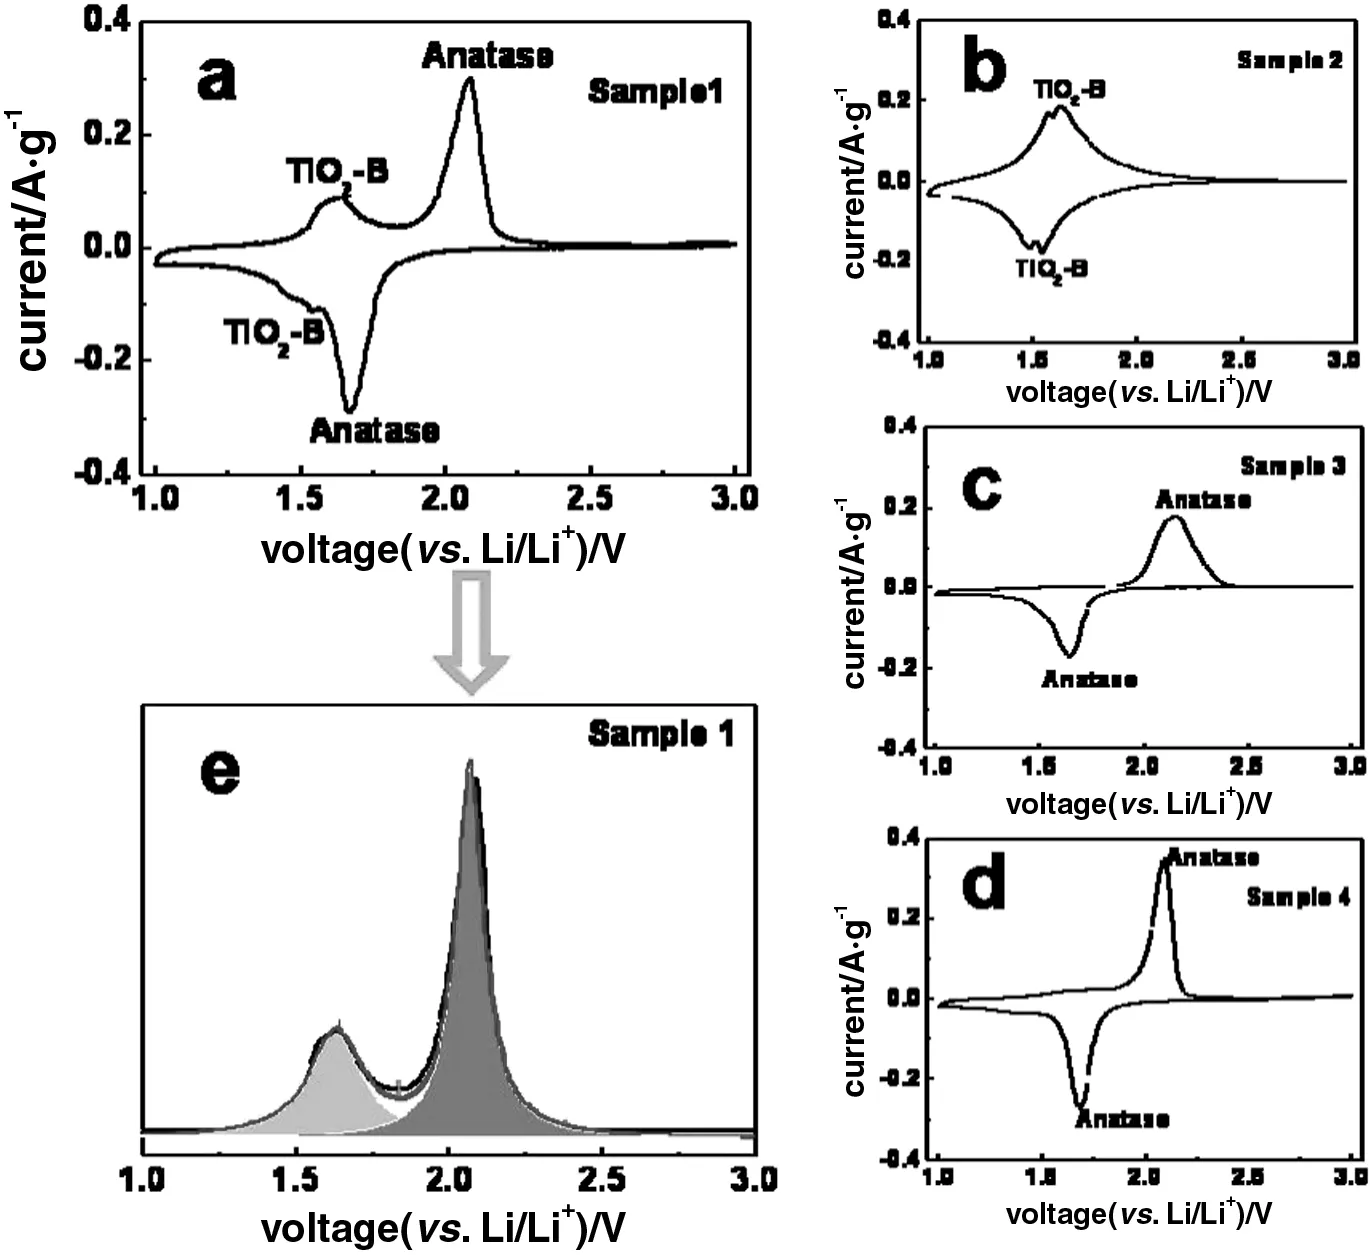
Fig.A2.Cyclicvoltammograms(CV)at the scan rate of 0.1 mV·s-1between1.0 and3.0 V.(a)Sample 1;(b)Sample 2;(c)Sample 3;(d)Sample 4 and(e)the content analysis of TiO2-Bin Sample 1 by CV.
 Chinese Journal of Chemical Engineering2015年3期
- Chinese Journal of Chemical Engineering的其它文章
- Micromixing characteristics in a gas-liquid-solid stirred tank with settling particles☆
- An experimental study of drag reduction by nanofluids in slug two-phase flow of air and water through horizontal pipes☆
- Effect of surfactant type on interfacial area and liquid mass transfer for CO2absorption in a bubble column☆
- Effects of bubbly flow on bending moment acting on the shaft of a gas sparged vessel stirred by a Rushton turbine☆
- Enhanced heat transfer in a heat exchanger square-duct with discrete V- finned tape inserts☆
- A novel purification process for dodecanedioic acid by molecular distillation