An experimental study of drag reduction by nanofluids in slug two-phase flow of air and water through horizontal pipes☆
A.R.Pouranfard,D.Mowla*,F.Esmaeilzadeh
Environmental Research Center in Petroleum and Petrochemical Industries,School of Chemical and Petroleum Engineering,Shiraz University,Shiraz,Iran
Keywords:
A B S T R A C T
1.Introduction
The phenomenon of drag reduction in pipeline flows was reported at fir st by a British chemist,Toms,in 1948[1].Drag reduction is beneficial to pipeline systems in several ways;it can save pumping power,increase the flow rate or decrease the size of pumps in turbulent pipe flow systems.Several studies have been conducted on drag reduction by polymeric additives[2-8],but some studies have been conducted on drag reduction in the pipe flows by nanofluids[9-18].Nano fluids are suspensions including a base liquid such as oil,water,ethylene glycol and nanoparticles that have been dispersed into liquid phase by surfactants and ultrasonication.Few studies have been conducted on different properties of nanofluids such as tribological properties.In addition,nanofluids can modify the surface tension for two-phase systems.Until now,there has been just one experiment conducted on pressure drop in two-phase pipe flows.Wang and Bao[19]studied the two-phase flow of nitrogen and water-based CuO nanofluids into vertical capillary tubes and concluded that the effect of nanofluids on the two-phase flow patterns resulted from the change of the gas-liquid surface tension.
In our study,SiO2nanoparticles,which were non-expensive,effective and easily accessible,were used as drag reducing agents.The nanofluids and air in different turbulent flow conditions were injected into the horizontal smooth and rough pipes under slug flow regime.Slug flow was preferred,because it was a significant flow regime as far as transport processes were concerned.The unusual nature of slug flow,i.e.alternating sections of gas and liquid,was able to apply singlephase drag reduction information combined with two-phase flow data for analyzing the physical structure of slug flow.The extent of drag reduction under different flow conditions was measured and the results were extended to be used in large scales.
2.Definition of Drag Reduction
Drag reduction is defined as a flow phenomenon in which a small amount of additives decreases significantly the friction factor of a flu id.Here,the purpose of drag reduction is to improve capacity,reduce pumping power and improve mechanical efficiency using active agents,known as Drag Reduction Agents(DRA).In single and multi-phase flows,drag reduction percentage(η)can be defined as the fraction of drag reduction in the frictional pressure drop under the same flow rate:

In this equation,ΔP is the pressure drop in the absence of DRA and ΔPDRAis the pressure drop in the presence of DRA.
3.Experimental Methods
3.1.Nano fluids preparation
In this study,distilled water(DW)and nanosilica particles were used to make nanofluids.Nanosilica-particles(nano-SiO2)were provided by Merck Company.As specified by the vendor,the particle sizes were 20-30 nm,and the true material density was 2.4 g·cm-3with 180-600 m2·g-1specific surface area(SSA).There are two different methods for producing stable nanofluids.The first is to use a surfactant.In this method,surfactant is dissolved in base liquid at the mass concentration of 0.5%and then solid nanoparticles and surfactant solution are mixed to make well-dispersed and homogenous suspensions.The other method is to attach hydrophilic functional group of base liquid onto the surface of nanoparticles,and acidic mixtures are used to modify the surfaces of solid[19].In this study,the first method was used to produce the nanofluid suspensions,and sodium dodecyl sulfate(SDS,Sigma-Aldrich Co.)was used as surfactant.At first,SDS was dissolved in DW at0.5%(by mass)as base fluid under magnetic stirring.After that the mixture was stirred by a magnetic stirrer and was sonicated with a 400 W,40 kHz ultrasonic processor to produce well-dispersed and homogenous suspensions.Nano fluid suspensions were prepared in the range of 0.1%-1%(by mass).All nano fluids were appropriately dispersed and were kept stable even after a two-week period,that was suitable for experimentation.The viscosities and densities of prepared nanofluid suspensions for the experimental conditions at a temperature of 25°C are given in Table 1.

Table 1 Viscosities and densities of prepared nanofluids at 25°C
3.2.Experimental procedure
The main purpose of this study was to investigate the drag reduction by nanofluid on two-phase slug flow of air-water through horizontal pipes.The test section of the experimental set-up consisted of a smooth Unique pipe( five-layer composite pipe of polyethylene and aluminum,produced by Foshan Rifeng Enterprise Co.,Tehran,Iran)with 9 m length and 1.27 cm ID,four parallel horizontal galvanized rough pipes with 9 m length and 1.27,1.905,2.54,3.175 cm IDs.In the first set of experiments,the pressure drop in horizontal slug flow of air-water through each pipe was determined in the range of 250-1500 L·h-1of water and 300-2400 L·h-1of air flow.Then,nanofluid suspensions at 0.1%-1%mass concentration in the range of 250-1500 L·h-1flow rate of liquid were injected through pipes and the pressure drop values were also recorded.Due to the importance of drag reduction in turbulent flow conditions,this study focused on the turbulent flow through horizontal pipes.
Air and water properties for the experimental conditions at 25°C temperature are given in Table 2.

Table 2 Air and water properties at 25°C
The axial pressure dropthrough pipes was determined by a differential pressure transmitter,model KH3351(Rosemount Co.,U.S.A.),with 0.1 Pa precision.To eliminate the entrance and exit effects,the differential pressure taps were installed at 1.5 m away from the entrance and end of the pipes.Each nanofluid solution was prepared as the master solution and then injected in the pipes by a gear pump at the entrance of the pipes.Flow diagram of the experimental apparatus is shown in Fig.1,schematically.

Fig.1.Schematic diagram of experimental apparatus.
To investigate the precision of the experimental data,the obtained experimental friction factors were compared with Blausius equation for single-phase flow(Fig.2).The friction factors obtained from experimentations were calculated by


Fig.2.Experimental data in comparison with the theoretical data.
The Blausius equation is
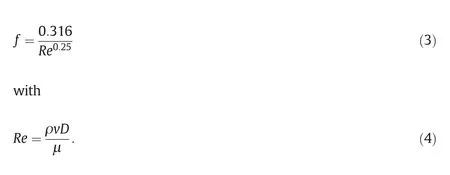
4.Results and Discussion
For two phase flows,experimental data was organized with the slip Reynolds number,Re,which is de fined as follows:

The slip velocity and density are considered as following:

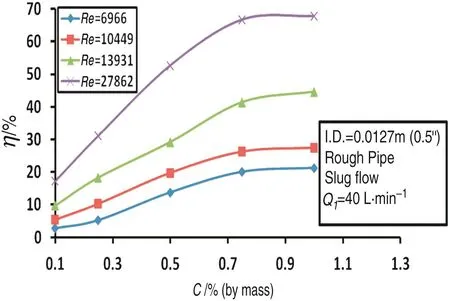
Fig.3.Drag reduction under different flow conditions in a rough pipe with slug flow regime.

Hl,liquid holdup and Hg,gas void fraction,were calculated from Beggs and Brill correlations[3].In order to achieve appropriate experimental measurements each test was conducted at least 3 times for each nanofluid concentration and the maximum error between the data from these runs was seen about 5%.
Fig.3 shows the effect of Reynolds number or flow conditions on the percentage of drag reduction in an iron galvanized rough pipe(0.5″diameter)with slug flow regime.As can be seen,η increased as Reynolds number increased and there was a critical concentration above which drag reduction was not seen,which was about 0.75%(by mass)of nanosilica particles.
Fig.4 illustrates the percentage of slug flow drag reduction value in smooth and rough pipes with nano-SiO2mass concentrations in the range of 0.1%to 1%under different air flow rates.All figures show the same trend in drag reduction.Drag reduction in rough pipes was more than that in smooth pipes due to the lower degree of turbulence in smooth pipes compared to rough ones.

Fig.4.Estimation of η in rough and smooth pipes in slug flow regime and different Reynolds numbers.
The effect of pipe roughness on the percentage of drag reduction in slug flow regime is shown in Fig.5.

Fig.5.Variations of drag reduction at different rough pipes with slug flow regime.
As shown,η increased at a given nanoparticle concentration as the pipe diameter decreased or the relative roughness(ɛ/D)increased.The reason behind that was the higher degree of turbulence in pipes with higher relative roughness.
Fig.6 compares η in single-phase flow with that in two-phase slug flow regime into a pipe line which has 0.0127m(0.5'')diameter and 9 m long under turbulent flow conditions at Re=27862,typically.

Fig.6.Drag reduction in single-phase flow in comparison with η in two-phase flow in a rough pipe under specified flow conditions.
The obtained results indicate that the percentage of drag reduction in two-phase flow is more than that in the single-phase one.A possible reason for more drag reduction in two-phase flow system is the surface tension reduction by nanofluids,along with the polishing of pipe surface by nanosilica particles that reduces turbulence dissipation rate[9,14,15,18].
To do so,20 cm of a pipe was cut to divide the pipe by two equal parts.The SEM image of the lower internal surface of the cut-off pipe that was in contact with passing fluid was provided(Fig.7).The SEM photo of the pipe before using nanofluid was also provided.Then,the cut-off piece was attached to the pipe,and the cut-off slot was sealed by the appropriate adhesive(®Loctite 243,Henkel Co.,China).The curing time of the adhesive was 48 h according to the vendor and the outside of the pipe was bound to help the cut-off part seal.The experiment was done with Reynolds number of 13931,and nano fluid mass concentration of 0.75%through 0.0127m(0.5'')diameter pipe.After the experiment was done,the cut-off pipe was pulled out and its SEM image was taken.The SEM image from the surface of the pipe(Fig.7)shows the reduction of the roughness as a result of being filled by nanoparticles.Comparing Fig.7(a)and(b)shows clearly that the roughness of the pipeline has been reduced by the addition of nanoparticles into the pores of pipe surface.Furthermore,SiO2possibly forms ceramic composites with metal during friction to increase the anti-wear capability,as shown in Fig.7(b).This phenomenon causes drag reduction and friction reduction between pipe surface and liquid phase.
Furthermore,to investigate the effect of nanoparticles,the surface tension(σ)between air-liquid was measured in different cases.To calibrate the measuring apparatus,surface tension between air and pure water was measured at 25°C and compared with literature data that showed less than 1%error.The results show that σ decreases as nanofluid concentration increases,as shown in Fig.8.When SDS was added to water,σ reduced from 71.38 to 44.64 mN·m-1.But,the dispersion of nanosilica in the base fluid(water+SDS)leads to greater reduction in surface tension.

Fig.8.Variations of surface tension(σ)with nanofluid concentration.
Comparison of SDS solution(base fluid)and nanofluid effects on drag reduction in two different pipes in Fig.9 shows that nanofluids caused more reduction in drag,because dispersion of nanoparticles into the base fluid caused more reduction in surface tension between air-liquid(as shown in Fig.8).
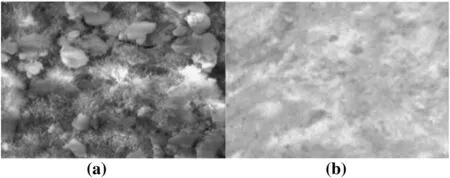
Fig.7.The SEM images of a rough pipe surface.(a)Before nanofluid injection.(b)After nano fluid flow for 8 h.
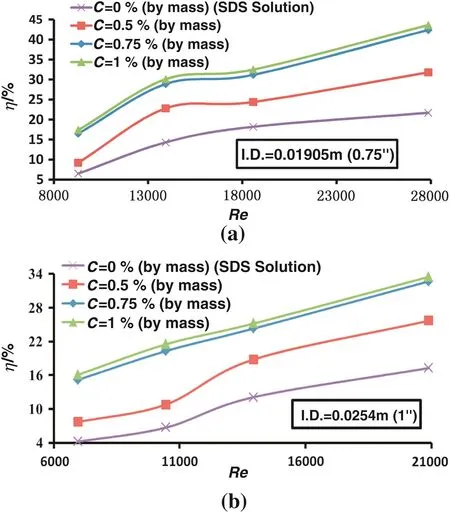
Fig.9.Comparison of SDS solution and nanofluid injection effects on drag reduction.(a)I.D.=0.01905m(0.75'').(b)I.D.=0.0254m(1'').
5.Conclusions
In this study,experimentation was done on drag reduction of two phase slug flow through different horizontal pipes.The subsequent conclusions are obtained from this experimentation:
(1)The amount of drag reduction increases as the nanofluid concentration increases,but there is a critical mass concentration(0.75%)above which no significant reduction of drag could be seen.
(2)A possible drag reduction mechanism by SiO2nanoparticles in two-phase flow is surface modification which is the result of their contact with pipe surfaces and surface tension reduction between air and water phases.
(3)The percentage of drag reduction in rough pipes was greater than that in smooth ones due to the higher turbulence in rough pipes.
(4)Because of the high turbulence in pipes with lower relative roughness,the percentage of drag reduction increases as the relative roughness enhances or the pipe diameter decreases.
(5)The effectiveness of nanofluid in two phase- flows is more than that in single-phase flow at the same Reynolds number and pipe properties.
Nomenclature
A Cross sectional area,m2
D Inside pipe diameter,m
f Manning friction factor
HgGas holdup
HlLiquid holdup
L Length,m
ΔP Pressure drop,N·m-2
QgGas flow rate,m3·s-1
QlLiquid flow rate,m3·s-1
Re Reynolds number(=ρvD/μ)
v Superficial velocity,m·s-1
vgGas velocity,m·s-1
vlLiquid velocity,m·s-1
vsSlip velocity,m·s-1
σ Surface tension,N·m-1
μsSlip viscosity,Pa·s
ρlLiquid density,kg·m-3
ρgGas density,kg·m-3
 Chinese Journal of Chemical Engineering2015年3期
- Chinese Journal of Chemical Engineering的其它文章
- Micromixing characteristics in a gas-liquid-solid stirred tank with settling particles☆
- Effect of surfactant type on interfacial area and liquid mass transfer for CO2absorption in a bubble column☆
- Effects of bubbly flow on bending moment acting on the shaft of a gas sparged vessel stirred by a Rushton turbine☆
- Enhanced heat transfer in a heat exchanger square-duct with discrete V- finned tape inserts☆
- A novel purification process for dodecanedioic acid by molecular distillation
- Purification and separation of durene by static melt crystallization☆
