Micromixing characteristics in a gas-liquid-solid stirred tank with settling particles☆
Wanbo Li,Xingye Geng,Yuyun Bao*,Zhengming Gao *
State Key Laboratory of Chemical Resource Engineering,School of Chemical Engineering,Beijing University of Chemical Technology,Beijing 100029,China
Keywords:
A B S T R A C T
1.Introduction
In a stirred reactor,the mixing process can be characterized onthree scales:macromixing,mesomixing and micromixing.Micromixing is mixing at molecular scale,which may influence the selectivity,yield and quality of the final products.Therefore,the study of micromixing gives important guidance for industrial applications.The iodide-iodate technique,developed by Fournier et al.[1]and Guichardo et al.[2,3],has been extensively used for the micromixing study in a stirred tank,especially for single-phase,like Assirelli et al.[4-6]and Nouri et al.[7].Moreover,the successive acid injection based on the iodide-iodate technique is really an advantage for the characterization of large vessels by reducing preparation time and experimental cost[2,4].Meanwhile researchers developed different micromixing models,among which the incorporation model is the most extensively used one[8-10].
The literature related to the micromixing for multi-phase systems is limited especially for the gas-liquid-solid system.Forgas-liquid systems,Lin and Lee[11]investigated the micromixing efficiency in a 1 L stirred tank sparged at 1.5,10 and 20 vvm[vvm:(air volume/culture volume)/min].They found that near the impeller tip,regardless of flooding,the agitation by bulk gas column or dispersed tiny bubbles could provide an efficient micromixed environment.In regions far from the tip,however,the occurrence of flooding could severely retard the micromixing.Brilman et al.[12]suggested that the effect of sparging on the product distribution was limited based on their research in a tank of 0.082m diameter with VSup to 0.028 m·s-1.Ho finger et al.[13]investigated the effects of gas on micromixing in a tank of 0.288 m diameter.In their semi-batch experiments with the test reagents fed near the impeller,the micromixing efficiency was not affected by sparging up to 1.5 vvm.However,a significant improvement of micromixing performance was observed by sparging gas when the reagents were fed near the top surface.
For solid-liquid systems,Barresi[14]showed that with the same stirring speed,the turbulence level was increased by the solid particles(150-212μm;ρ=2500kg·m-3)with a Rushton turbine but decreased with a pitched blade turbine.By PIV measurements,Montante et al.[15]suggested that moderate dampening of liquid turbulent fluctuations was found with particles of 115 μm diameter,while turbulence enhancement was observed with the 774 μm particles.Ho finger et al.[13]suggested that with 500 μm glass beads at mass concentrations up to 2.5%,the micromixing was unaffected near the impeller and near the surface.At 11.63%(by mass)when cloud formation was observed,the micromixing became significantly worse at both positions.
In general,the mechanisms by which the presence of bubbles and solid particles affect the turbulence level in the liquid phase are still unclear.Therefore,the successive acid injection of the iodide-iodate method was used to investigate the micromixing in multi-phase stirred tank.Firstly,the validity of the successive acid injection was tested.Then,the effects of gas flow rates Qg,solid concentrations Cvand feed positions on the micromixing performance were systematically investigated.Finally,the micromixing time tmand local specific energy dissipation rates εTaccording to the incorporation model were discussed.
2.Experimental Setup
All the experiments were carried out in a dished-bottom cylindrical tank with internal diameter T=0.30 m and a filled aspect ratio H/T=1.8,as sketched in Fig.1.The total liquid volume was 0.035 m3.As a standard con figuration,four 0.03 m wide baffles were symmetrically mounted on the wall.A half elliptical blade disk turbine[HEDT,Fig.2(a)]was located at 0.4 T above the tank bottom,and two downpumping wide-blade hydrofoils[WHD,Fig.2(b)]were mounted above it.The spacing between impellers was 0.48 T.The diameter D of all three impellers equaled to 0.33 T.The power number Npof this impeller combination is4.1in single liquid phase.A ring sparger of diameter0.8D with 27 symmetrical 0.002 m diameter downward-directed holes was located 0.33 T above the tank bottom.Two feed positions were chosen,as shown in Fig.1.Both positions were located the same height as the bottom turbine;feed position 1(P1)was 10 mm away from the impeller tip while feed position 2(P2)was 30 mm away from the tank wall.
As the oxygen from air or water could oxidize the iodide to iodine,nitrogen and deionized water were used as gas and liquid phases respectively.The solid particles were 100 μm mean diameter glass beads of density 2500 kg·m-3.The gas flow rate Qgranged from 1.4 to 4.2 vvm,while the volumetric solid concentrations Cvranged from 3%to 9%.The mean specific energy dissipation rate Pmwas based on W·kg-1of total mass in the tank including liquid and solid particles.The relation ship between stirring speed and the torque was determined firstly for matching Pm with various gassing ow rates and particle concentrations,and Pmranged from 1.2 to 2.8 W·kg-1.
3.Test Reaction
The iodide-iodate method was used in this work,as described by the following scheme:


The neutralization reaction(1)is considered instantaneous with H3BO3as the desired product.The oxidation reaction(2)is fast but relatively slower than reaction(1)with iodine as the undesired product.The iodine forms further triiodide with iodide according to the quasiinstantaneous equilibrium:

where KBis the equilibrium constant of reaction(3).KBis a function of temperature T’[16]:

During the experiments,a quantity of sulfuric acid was added into the mixture of KI,KIO3and H2BO3-at a specific feed position.When the micromixing conditions were perfect,H+was instantaneously dispersed and consumed by the first instantaneous reaction.However,when micromixing is not perfect,the local aggregation with high H+concentration would allow the slower reaction(2)more chance to take place.
The I3-concentration can be accurately measured by spectrophotometry at 353 nm[1].According to the Beer-Lambert Law,the optical density D0is proportional to the concentration of I3-through the molar extinction coefficient ε of I3-at 353 nm:

where L is the optical path length equal to 1 cm,and the molar extinction coefficient ε of I3-at 353 nm equals to 2535 m2· mol-1.

Fig.1.Experimental setup and feed positions.

Fig.2.Impellers.
Mass balance on iodine atoms yields the following equation:

where the subscript“0”refers to the initial concentration before feeding acid.Then,the iodine concentration can be obtained by combining Eqs.(4)and(7).
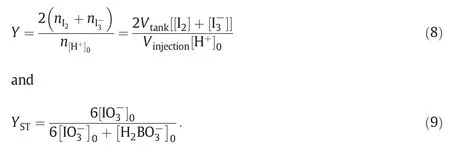
The results are expressed as the segregation index XSwhich is equal to the actual yield of the undesired product Y divided by the maximum yield YST:

XSvalues from 0 to 1,XS=0(no undesired product)means perfect micromixing,while the other extreme XS=1 means total segregation.
Another parameter used is the micromixedness ratio,α:

It has been suggested that α can be considered as the ratio of the volume of the tank perfectly micromixed to the volume totally segregated.
Gichardon and Falk[2]further developed the successive acid injection(one measurement for each injection)which is similar to the original iodide-iodate method but using repeated acid injections to characterize micromixing.The first XSis determined by the first acid injection.Then the second injection of acid is added to the bulk.The optical density of the liquid is measured after the total consumption of acid;the second segregation index is calculated by considering the a mount of iodine just formed during the second injection.Let i be the index for the ith injection.The value of XS,ifor each injection is defined as


The total volume of the bulk increases because of the successive additions of acid injections.For the ith injection,Vtank,iis given by

where[I2]iis the solution of the second-order equation

The initial concentration of reactants before each injection must be updated:

The reactant concentrations are chosen based on the work of Guichardon and Falk[2]:[H3BO3]0=0.1818 mol·L-1,[NaOH]0=0.0909 mol·L-1,[KI]0=0.01167 mol·L-1,[KIO3]0=0.00233 mol·L-1,[H2SO4]0=0.5 mol·L-1.
In the original iodide-iodate method,15 ml acid was injected with an injection time of 300 s.In the successive acid injection method,5 injections were used with a90s time interval between two injections,and the duration for each injection was the same as the original method(15 ml acid;300 s).
4.Results and Discussion
4.1.Solid suspensions in sparged systems
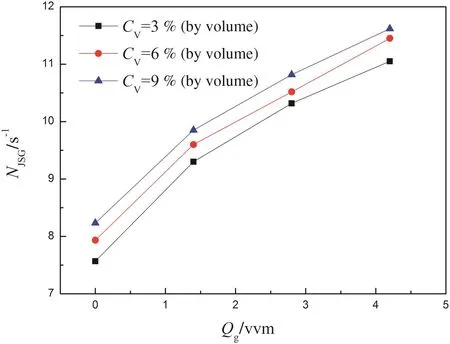
The critical just-suspension impeller speed was determined visually by observing the base of the center of the tank bottom where the solid particles often settled.Following the Zwietering criterion for the justsuspended condition for settling particle,the critical speed NJS,could be judged consistently within an accuracy of 5%in experiments.The critical agitation speed in a three-phase system is identified as NJSG.Fig.3 represents the relationship between gas flow rate Qgand NJSGunder different solid concentrations.NJSGincreases with both increased gas flow rate and solid concentration.The agitator speeds were set above the just-suspension speed during all the subsequent measurements.

Fig.3.Influence of Qgon NJSGat different solid concentrations.
4.2.Test of successive injection
The successive acid injection was tested by two different ways at feed position P2 to make sure it is effective for the micromixing study.The comparisons between normal injection and successive injections are shown in Fig.4.The segregation indexes are nearly the same within 5% deviations between the two different ways.The other testis presented in Fig.5,also showing good accuracy of the method.

Fig.4.Comparisons of XSbetween normal injection and successive injections.
Some more details should be followed to guarantee the accuracy of the method.First,the glass particles were washed three times with deionized water to get rid of impurities,after that the solid particles could settle quickly in 10 s and had no interference to the measurement of I3-by spectrophotometry.Second,it took long time between the first injection and the last injection,which led to the oxidation of iodide by light.It was necessary to cover the tank by a shade cloth,for keeping the tank in dark.Third,a feed pipe with diameter of 0.6 mm was used to avoid the back-mixing in the feed pipe[17,18].Fourth,the acid feed rate was investigated to avoid the influence of macromixing performance in the results,and it was set at 3 ml·min-1.At last,Ho finger et al.[13]suggested that the solid particles were small enough to get into the feed pipe,and it would become more serious with higher concentration of solid particles.Therefore,the exact volume of acid having being fed should be checked against the total volume of acid solution after each experiment.However,the blocking in feed pipe never happened in our experiments.

Fig.5.Comparisons of XSfor successive injections method.
4.3.Micromixing performance at P1
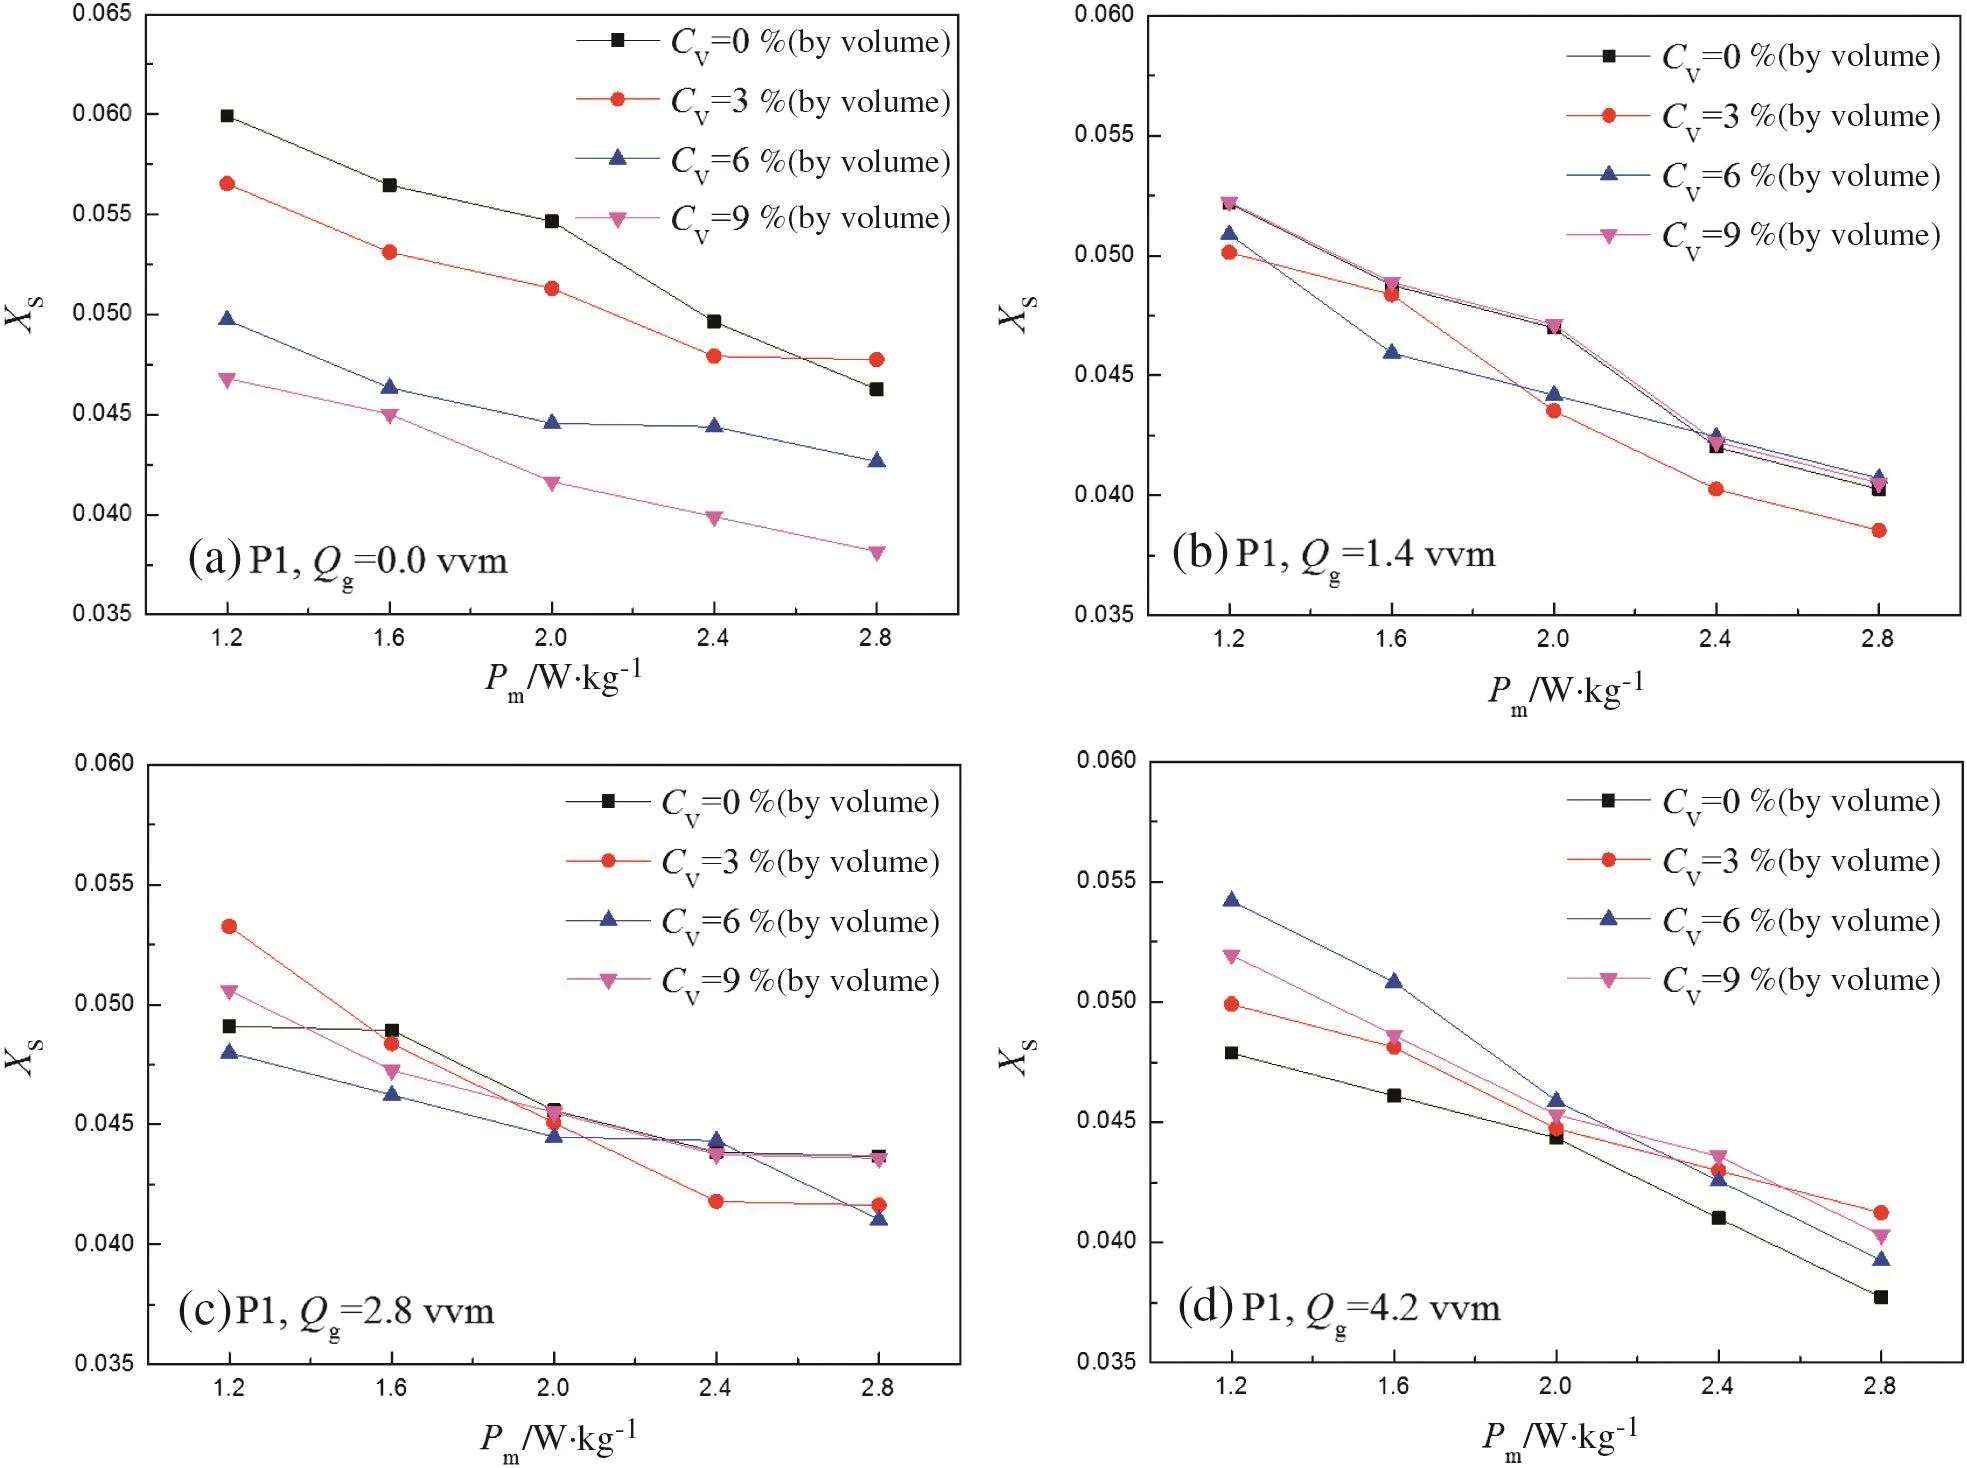
Fig.6 shows the effects of solid concentrations on the micromixing performance at P1.As for the power consumption,XSdecreases unsurprisingly with the increase of Pmranged from 1.2 to 2.8 W·kg-1.The increased power input can improve the micromixing efficiently.
The results in Fig.6(a)reveal that in a solid-liquid system,the improvements of micromixing performance are observed in the presence of solid particles.Moreover,the higher the solid concentration,the better the micromixing performance.Because P1 is close to the impeller tip,the solid particles at P1 has high kinetic energy.Therefore,particles with high kinetic energy and high density can intensify the turbulence in the liquid and lead to a decrease of XS.This intensification could be strengthened by the presence of more particles.However,with the introduction of gas,the effects of solid particles on the micromixing become complicated,as shown from Fig.6(b)-(d)corresponding to the gas flow rate of 1.4,2.8 and 4.2 vvm,respectively.Still,the conclusion can be obtained that the higher the gas flow rate,the more evident that particles suppress the micromixing at P1,which can be clearly found in Fig.6(d).
This complicated effect can be explained by the interaction between bubbles and solid particles.When gas is introduced,the collisions between bubbles and particles lead to the deformation of the bubbles,where the kinetic energy of particles turns into the potential energy of gas-liquid film.Then,the potential energy of the gas-liquid film dissipates due to the damping vibration of the interface,which contributes little to the turbulence level in bulk phase.Moreover,according to the law of conservation of momentum,the velocity of the particle decreases because of its smaller mass(about 1.04×10⁻⁸kg)compared with that of a bubble(about 1.4×10⁻⁷kg,diameter of 3 mm).Then,the particle with lower velocity is forced to be suspended by the liquid around,which decreases the turbulence level in the liquid phase.The decrease of the turbulence level in the liquid makes micromixing worse.A Damping Film Dissipation(DFD)model is proposed to describe the energy dissipating mechanism,as illustrated in Fig.7.The probability of the collisions between bubbles and particles becomes much higher with more gas introduced and higher solid concentration.Therefore,the micromixing in gas-liquid-solid system becomes generally worse with the increase of either the gas flow rate or the solid concentration.

Fig.6.Influence of the solid concentrations on segregation index,XSat a specific gas flow rate and at P1.

Fig.7.Damping Film Dissipation(DFD)model.
Fig.8 shows the effects of gas flow rates on the micromixing performance when the tank was fed at P1.At a specific power consumption Pmand solid concentration Cv,the relative deviation R between the XSvalues at gas flow rate of 0 vvm and 4.2 vvm can be calculated using Eq.(21).Then,the average deviations R at a specific solid concentration can be obtained by Eq.(22).Table 1 shows the average R values at different solid concentrations.The R values decrease with increasing solid concentrations.Moreover,R becomes negative at Cvhigher than 6%(by volume),which means that micromixing is suppressed by the introduced gas.


Fig.8.Influences of gas flow rates on segregation index XSat a specific solid concentration and at P1.

Table 1 The average deviation between XSat Qgof 0 vvm and 4.2 vvm at a specific solid concentration and at P1

The introduced gas burst from the holes of the sparger brings additional energy to the liquid around.In a gas-liquid system as shown in Fig.8(a),the extra potential energy from the bubbles makes great improvement on the intensities of the turbulence in the liquid,leading to a lower XS.However,when solid particles are introduced,according to the DFD model,the vibration with damping of the gas-liquid film dissipates plenty of the energy.Then,the solid particle with lower velocity decreases the turbulence level in the liquid around for the suspended particle.
It can be concluded that sparing gas can improve micromixing when Cvis lower than 3%(by volume)when feeding at P1.However,as solid concentration increased higher than 6%(by volume),the turbulence level in the liquid phase is decreased seriously by the sparged gas.Moreover,the difference between different gas flow rates can be neglected.
4.4.Micromixing performance at P2
Fig.9 shows the effects of solid concentration on the micromixing performance at P2.Unlike that at P1,at a specific gas flow rate,XSat low solid volume concentration corresponding to 3%is nearly the same as that without solid particles.However,the micromixing performances are suppressed by the presence of solid particles at volume concentrations higher than 6%.As P2 is farther from the impeller tip than P1,particles here have lower velocity.The particles dissipate plenty of energy from the liquid around them,leading to the decrease of the turbulence level in the liquid phase.The higher the solid concentration,the lower the turbulence level in the liquid phase.
Different effects of solid particles on micromixing performance are obtained by different researchers[13-15].It can be included that the effects of particles on micromixing depend on the particle size,particle concentration,characteristics of flow,etc.What this work clearly shows is that the micromixing can be improved by solid particles with high kinetic energy,for example feeding near the impeller tip and without gas.
At a specific power consumption Pmand gas flow rate Qg,the relative deviation R between the XSat solid volume concentration of 0%and 9%can be calculated using Eq.(23).Then,the average deviations R at a specific gas flow rate could be obtained by Eq.(24).Table 2 shows the average R values.Without gas,the segregation index at Cvof 9%(by volume)was 6.5%bigger than that without particles.Moreover,the R value is the biggest with a gas flow rate Qgof1.4vvm and then decrease with the increasing Qg.According to the DFD model,the turbulence level in the liquid decreases when both gas and solid particles are introduced.However,higher potential energy from higher gas flow rate can make up for the dissipated energy at P2,leading to the decrease of R.

Fig.9.Influences of solid concentrations on segregation index XSat a specific gas flow rate and at P2.

Table 2 The average deviations between XSatCvof9%(by volume)and 0% at a specific gas flow rates and at P2

Fig.10 shows the effects of gas flow rates on the micromixing performance at P2.In the low range of Pmcorresponding to 1.2-1.6 W·kg-1,the improvement of micromixing performance caused by sparging gas is observed which increases with the gas flow rate.The extra potential energy from the bubbles improves the micromixing efficiently.As Pmis increased higher than 2.0 W·kg-1,there is no obvious systematic difference among different gas flow rates,which reveals that the mean specific energy dissipation rate Pmhas dominant effects on the micromixing performance at this condition.
Table 3 shows the largest deviation R in the segregation index at Pmof 1.2 W·kg-1,as defined in Eq.(25).The R value decreases with increasing solid concentration,which means the improvement in micromixing performance contributed to the high gas flow rate is suppressed with the increasing solid concentrations.

4.5.Application of incorporation model of micromixing
Since the reactant concentrations will influence the value of segregation XS,the micromixing efficiency should be compared based on the micromixing time tmwhen the reactant concentrations are different.The incorporation model of micromixing[8]is used to calculate the micromixing time here.The incorporation model assumes that when acid is fed into the tank,the acid aggregates grow by progressively incorporating the surrounding media(iodate,iodide and borate ions)where reactions(1)and(2)take place.The volume of the aggregate V2grows according to


Fig.10.Influences of gas flow rates on the segregation index XSat a specific solid concentration and at P2.

Table 3 The largest deviation R at Pmof 1.2 W·kg-1at different solid concentrations and at P2
In the reaction volume,the concentration of the j species is given by

where the subscript 10 refers to the surrounding fluid.
Assirelli et al.[9]suggested that for the numerical solution of the incorporation model,the Bulirsch-Stoer method for stiff equations was proposed as a better way to obtain high-accuracy solutions than the Runge-Kutta method of the fourth order.They further found that though different acid concentrations gave different values of α de fined by Eq.(10)at the same feed positions and agitation conditions,the micromixing time estimated from the incorporation model of exponential growth was almost constant.However,the micromixing time estimated from the liner growth model was different with different acid concentration.The micromixing time tmis a fluid dynamic parameter which should be determined by the agitation condition but independent of the acid concentration.As a result,the incorporation model of exponential growth is appropriate for estimating the micromixing time.A polynomial regression with R2=1 was obtained for exponential incorporation and acid concentration of[H+]=1.0 mol·L-1[9]:

where tmis the micromixing time,and α is the micromixedness ratio.
Since similar experimental method and thesame acid concentration(H+=1 mol·L-1)were used in our experiment as those in the work of Assirelli et al.[9],the Xswithout aeration or solid particles are dealt using Eqs.(10)and(30),and the results are shown in Fig.11.The micromixing time varied from 1.8ms to 2.6ms at P1while from 3.8ms to 6.7 ms at P2.In Fournier's[8]and Assirelli's[9]works,the micromixing time varied from 2 ms to 20 ms and from 3 to 60 ms respectively.

Fig.11.Micromixing time as a function of Pmin single liquid phase.
According to the turbulence theory of Kolmogorov,the microscale Kolmogorov time tKis proportional to(v/ε)0.5.It has been suggested that the micromixing time tmevaluated from the micromixing study is the same as the microscale Kolmogorov time tK[19].Based on the studies of micromixing model,Baldyga and Bourne[19]suggested the following relationship between tmand εT:

where ν is the fluid kinematic viscosity;εTis the local specific energy dissipation rate.Eq.(31)is widely used to estimate the local specific energy dissipation rate,εT,in a stirred tank[2,4,9].Eq.(31)was also used to estimate the local specific energy dissipation rate εTin our experiment.
De fine Φ as the dimensionless local specific energy dissipation rate,and Φ is equal to the ratio of the local specific energy dissipation rate εTto the mean specific energy dissipation rate Pm,as

The value of Φ can be calculated via Eq.(32)on the basic of tm,and the results are shown in Table 4.At P1 feeding position,the value of Φ does not show any systematic trend.However,at P2,the value of Φ increases with the increasing Pm.While feeding near the impeller,Assirelli et al.[9]and Sharp et al.[20]suggested that the Φ fell with the increasing speed.The difference can be attributed by the different impellers used in the experiments.A Rushton impeller was used in their experiments,while a half elliptical blade disk turbine and two down-pimping wide-blade hydrofoils were used in our work.The increasing Φ at P2 reveals that the higher the Pmlevel is,the more of the shaft energy is dissipated near the bottom impeller while using HEDT+2WHD.

Table 4 Values of εTand Φ;at Cv=0%(by volume)and Qg=0 vvm
5.Conclusions
The effects of gas and solid particles on the micromixing performance have been investigated in a stirred tank by using the iodide-iodate reaction scheme.It has been verified that the successive injections for the iodide-iodate reaction scheme is efficient for the investigation of micromixing in a three-phase stirred tank.The conclusions are as follows.
(1)The input power has considerable effects on the micromixing performance.All experiments show that the segregation index decreases obviously with increasing Pmup to 2.8 W·kg-1.
(2)In a solid-liquid system,the solid particles near the impeller tip can improve the micromixing because of their high kinetic energy.However,the presence of particles near the tank wall suppresses the micromixing.
(3)In a gas-liquid system,because of the potential energy introduced by the sparged gas,the improvement of micromixing is observed and becomes more evident at higher gas flow rates.
(4)In a gas-solid-liquid system,the increase of both the solid concentration and the gas flow rate reduces the turbulence level in the liquid,leading to the deterioration of the micromixing performance in the three-phase stirred tank.
(5)Based on the incorporation model,the micromixing time in this work varied from 1.9×10⁻³to 2.6×10⁻³s at P1 while from 3.8×10⁻³to 6.7×10⁻³s at P2.
Nomenclature
Cvvolumetric solid concentrations
D impeller diameter,m
D0optical density
H liquid height,m
KBequilibrium constant,mol-1
L optical path length,m
M concentration unit,mol·m-3
N stirring speed,s-1
NJSGcritical agitation speed for particles,s-1
Nppower number
Pmmean specific energy dissipation rate,W·kg-1
Qggas flow rate,vvm
T tank diameter,m
T’ temperature,K
tkKolmogorov time microscale,s
tmmicromixing time,s
V liquid volume in vessel,m3
VSsuperficial gas velocity,m·s-1
XSsegregation index
Y actual yield of undesired product
YSTmaximum yield of undesired product
α micromixedness ratio
ε molar extinction coefficient,m2·mol-1
εTlocal specific energy dissipation rate,W·kg-1
Φ dimensionless local specific energy dissipation rate
 Chinese Journal of Chemical Engineering2015年3期
- Chinese Journal of Chemical Engineering的其它文章
- An experimental study of drag reduction by nanofluids in slug two-phase flow of air and water through horizontal pipes☆
- Effect of surfactant type on interfacial area and liquid mass transfer for CO2absorption in a bubble column☆
- Effects of bubbly flow on bending moment acting on the shaft of a gas sparged vessel stirred by a Rushton turbine☆
- Enhanced heat transfer in a heat exchanger square-duct with discrete V- finned tape inserts☆
- A novel purification process for dodecanedioic acid by molecular distillation
- Purification and separation of durene by static melt crystallization☆
