
Pressure-volume-temperature and excess molar volume prediction of amorphous and crystallizable polymer blends by equation of state
2015-11-13 02:32FakhriYousefi
Fa khri Yousefi
1,*,Hajir Karimi2,*,Maryam Gomar1
1Department of Chemistry,Yasouj University,Yasouj 75914-353,Iran
2Department of Chemical Engineering,Yasouj University,Yasouj 75914-353,Iran
Keywords:
A B S T R A C T
1.Introduction
The quantitative description of dense polymer melts and blends is a problem of industrial and theoretical interest.As the processing of a large number of polymeric materials is frequently carried out in the molten state,it is important to estimate the pressure-volume-temperature properties and phase behavior of these materials accurately under conditions unavailable experimentally.This is essential in equipment design and process simulation.Existing empirical equations have been developed to predict the volumetric properties,such as the Tait equation[1].In recent years,different theoretical equation of state(EOS)based on extensive pressure-volume-temperature(pVT)data of pure polymers[2-9],and against vapor-liquid equilibria and liquid-liquid equilibria of blend systems[10-12]has been developed.For example,Sato et al.[4]present a new group-contribution modified cell model EOS(GCMCM EOS)to predict pVT properties of polymer melts.Furthermore,if one specific volume datum at atmospheric pressure is used,the average prediction error of pVT by GCMCM EOS can be reduced to 0.27%for the homopolymers and 0.34%for the copolymers and blend polymers.Also,Papari et al.[5]employed Ihm-Song-Mason EOS(ISMEOS)for compressed pure polymeric fluids using two scaling constants both at the glass transition point.The average absolute deviation(AAD)between the calculated and the experimental densities for 421 data point of five polymers was around 0.6%.Besides,Hosseini et al.[7]demonstrated the modeling of the pVT properties of 14 melting polymers using simplified Yukawa hard-sphere-chain EOS plus first-order perturbation theory with overall AAD of the calculated specific volumes about 0.89%.Then,Yousefi and Karimi[8,9]successfully employed ISM and TM EOS using two scaling constants both at the melting point for high and low density pure polymer liquids over a wide range of temperatures and pressures.
This research focuses on the calculations of volumetric properties of some crystalline polymer blends such as poly(ethylene glycol)methyl ether(PEGME-350)+poly(ethylene glycol)PEG-200,PEGME-350+PEG-600,poly(propylene glycol)(PPG)+poly(ethylene glycol)(PEG)and amorphous polymer blends contain poly(2,6-dimethyl-1,4-phenylene oxide)(PPO)+poly styrene(PS)and PS+poly(vinylmethylether)(PVME)at compressed states in the temperature range 298.15 K to 634.6 K and pressures to 200.0 MPa using modified Ihm-Song-Mason(ISM)equations of state[13].Finally,the efficiency of this approach is compared with experimental data.
2.Theoretical Equation of State
2.1.ISM equation of state
Statistical mechanics provides us with the following equation,assuming a pair-wise additive central intermolecular potential[14],

where p is the pressure, is the density,g(r)is the pair distribution function andis the derivative of the intermolecular potential,u(r),with respect to distance,r.Applying the Weeks-Chandler-Anderson division for the potential energy function[15],Ihm et al.[13]derived the following equation:

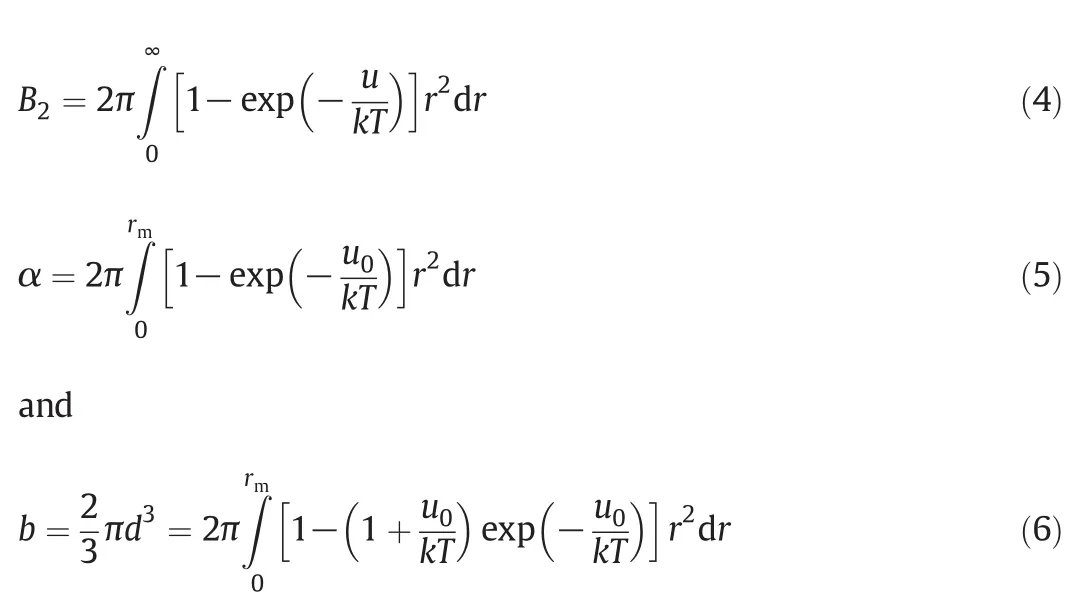
where B2is the second Virial coefficient,αis the repulsive contribution to the second Virial coefficient,G(bρ)is the average pair distribution function at contact for equivalent hard spheres,and b is the analog of the van der Waals covolume and can be calculated from α by the following equation:

All of the temperature-dependent parameters,B2,α,and b,can be written in terms of the intermolecular pair potential in reference[16].
where d is the effective hard-sphere diameter and u0is the repulsive branch of u de fined as[15]
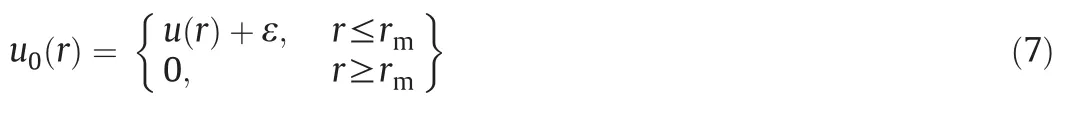
where ε is the potential well-depth and rmis the position of minimum in u.
Ihm et al.[13]used the Carnaham-Starling equation for G(bρ)[17]and performed a correction in Eq.(2)for the attractive forces to obtain
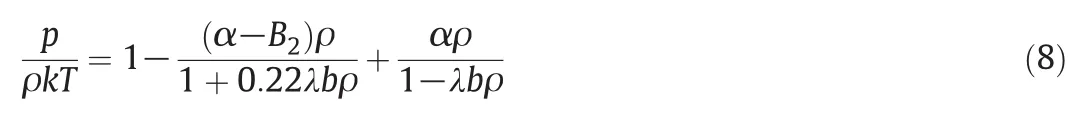
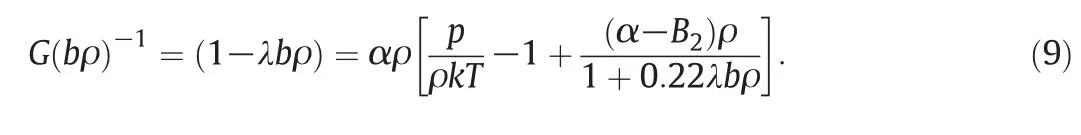
where λ is an adjustable parameter.From Eqs.(2)and(8),G(bρ)can be written as
Also,the equation of state for mixtures is presented as follows[18]:
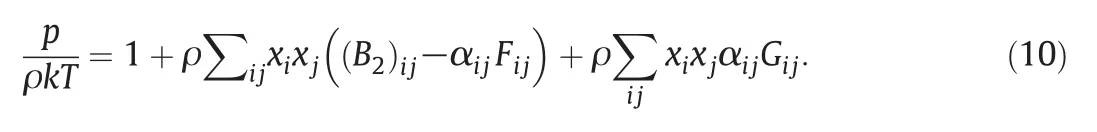
The summations run over all components of mixture.The interaction quantities(Bijand αij)are well defined in terms of the ij intermolecular potentials,and are obtained in the same way as the corresponding quantities for single substances,either from the potential itself or from experimental data on the second Virial coefficient that Gijand Fijare de- ned in literature[18].
3.Parameters Estimation for Equation of State
3.1.Estimation by melting point for crystalline polymers
ISM equation of state requires the usage of the second Virial coefficient,B2,along with the parameters α and b.For polymeric melts,neither the intermolecular potential nor the experimental values of B2are available.In this case,there are several correlation schemes usually based on the corresponding-state principle that leads to the calculation of the second Virial coefficient[19-24].
In this research,the corresponding states correlation that was previously used for pure polymer melts[8,9]was extended in order to make ISM EOS applicable to polymer blends.The resulting correlation for the second Virial coefficient reads as follows:
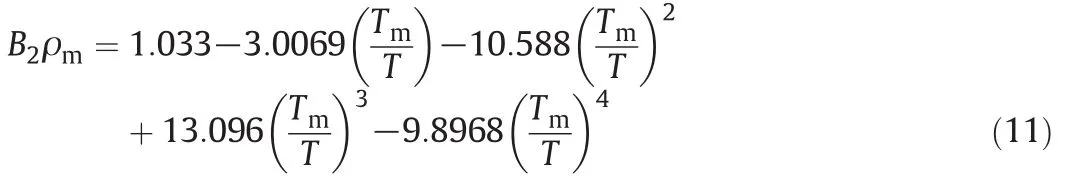
where ρmand Tmare the density and temperature both at the melting point.
It should be mentioned that melting is a transition that occurs in crystalline polymers.Melting happens when the polymer chains fall out of their crystal structures,and become a disordered liquid.In this paper,α and b were correlated by using the following pair of equations:
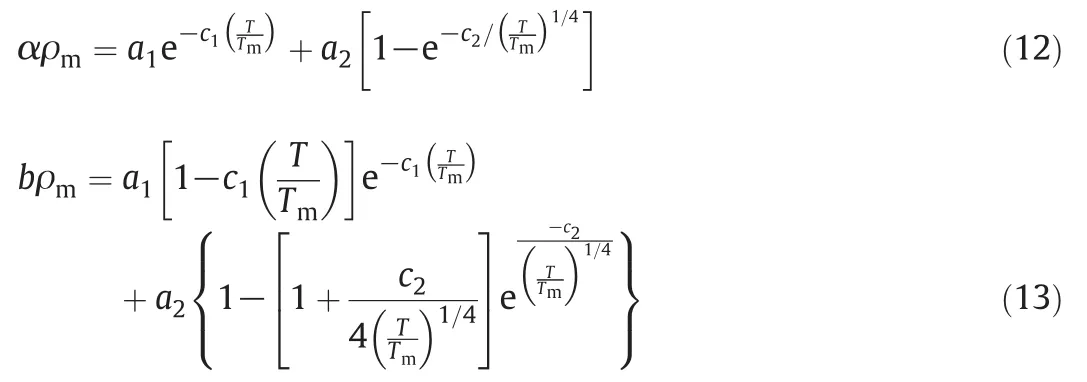
where
a1=-0.0650,c1=0.6536
a2=2.8542, c2=1.2856.
The present method for calculation of the second Virial coefficient and the other two temperature-dependent parameters can be extended to mixtures using simple arithmetic mean of melting point temperature and geometric mean of liquid density at the melting point,i.e.,
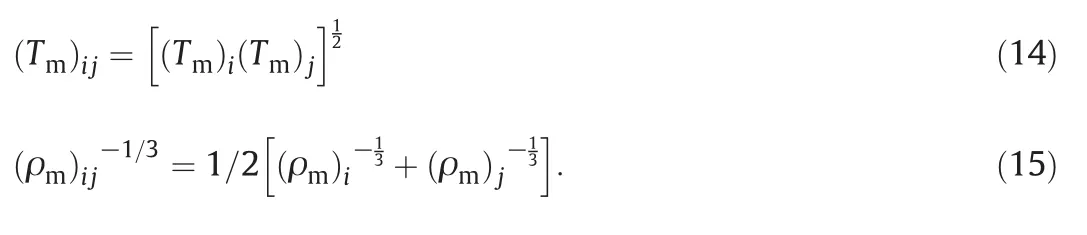
The adjustable parameter of λ can be obtained from pVT data at a high density.This method for determining λ makes the whole procedure self-correcting.
3.2.Estimation by glass point for amorphous polymers
It should be mentioned that the glass transition temperature(Tg)which describes the temperature at which amorphous polymers under go a second-order phase transition,i.e.,a polymer goes from a hard and glass-like state to a rubber-like state is an important property of polymers.It can be obtained by differential scanning calorimetry(DSC)method.
In this respect,the following correlation equation for B2using new scaling parameters,such as the surface tension γgand the molar density ρgboth at the glass transition point has been developed.The resulting correlation for the second Virial coefficient reads as follows[5]:

where ρgis the density at glassing point,Tgis the glassing temperature,NAis the Avogadro number and γgis the surface tension at glassing point.The other two functions,α and b,were correlated by using the following pair of equations:
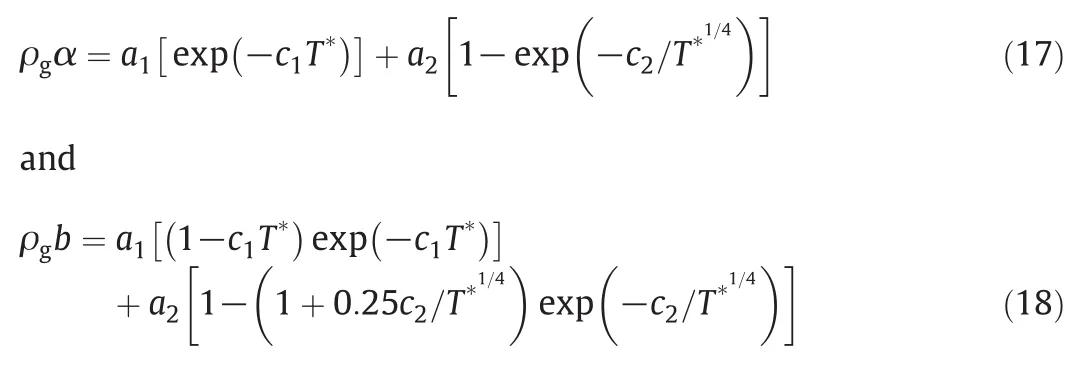
where
a1=-0.01054,c1=0.7613
a2=2.9387, c2=1.3227.
The present method for calculation of the second Virial coefficient and the other two temperature-dependent parameters can be extended to mixtures using simple arithmetic mean of melting point temperature and geometric mean of liquid density at the melting point,i.e.,

4.Results and Discussion
The pVT properties of polymeric melts should be known accurately for the system design.In this study,ISMEOS with two different second Virial correlation(that was previously constructed for pure polymers using statistically-mechanical perturbation theory[5,9])has been extended to crystalline polymer blends such as PPG+PEG-200,PEGME-350+PEG-200 and PEGME-350+PEG-600,and amorphous polymer blends containing PPO+PS and PS+PVME over the whole range of available temperature,pressure and mole fraction.
Experimental densities for PEGME+PEG-200 and PEGME+PEG-600 were obtained from Lee et al.[25].Also the experimental densities of PPO+Ps and PS+PVME,and PEG-200+(PPG)were extracted from Refs[26]and[1],respectively.
In this research,in order to develop a statistical mechanically-based equation of state for polymer blends,some modifications are performed on the ISMEOS.At first,the second Virial coefficient was developed using the density and temperature at melting point for crystalline polymers because melting point was important point in crystalline polymers.Also,the second Virial coefficient was developed for amorphous polymer blends using the density and temperature at glass transition.Glass transition temperature is an important property in plastics applications because it provides information about how the polymer behaves under ambient conditions.Therefore,Eq.(16)is suitable for a morphous polymers.
These modifications reduce the number of input parameters of the ISM equation of state.In other words,by knowing minimum input information,the ISMEOS can be assembled for polymer blends.
In addition,it is found that the adjustable parameter λ is dependent on temperature and pressure.Using pVT data of pure polymers,the parameter λ is correlated by the following simple correlation:

The coefficients are found in Table1 and the physical properties of all pure polymers are taken from Refs.[27-30]and are listed in Table 2.

Table 1 Coefficients in Eq.(23)
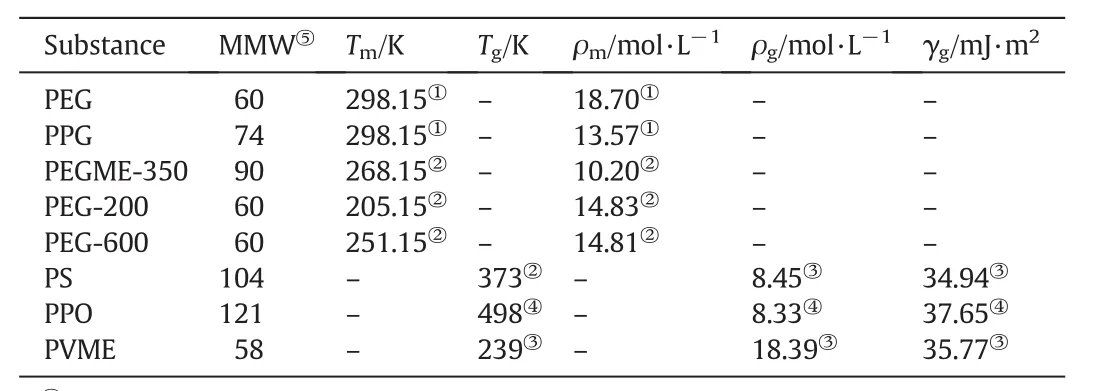
Table 2 Parameters for the polymer liquids
It should be noted that the ISM equation of state for PEG+PPG blend using the above scaling parameters was calculated by Sabzi et al.[27]with the absolute average deviation of density about 1.2%.
In the present study,with estimated adjustable parameter(λ)and the new second Virial coefficient,the absolute average deviation of PEG+PPG blend is reduced to 0.88%(Table 3).
The PEGME-350(1)+PEG-200(2)densities based on ISMEOS are calculated and results are shown in Table 4.As it can be seen,the ISMEOS is in good agreement with experimental data[1,25,26]and the absolute average deviation of ISMEOS is 0.84%.
The calculation of molar volume of PEGME-350(1)+PEG-200(2)using the ISM EOS is performed.The outcome of the computed results has been gathered in Table 5.It is evident from this table that the agreement between the calculated densities and the literature values[25]is quite satisfactory and about 0.78%.
The applicability of ISM EOS for the estimation of the pVT properties of three crystalline polymer blends is examined.The result is presented in Table 6.Furthermore,this table includes the number of data point(NP),the pressure and temperature ranges of all studied polymer blends.As can be seen from this table,744 data points are examined for studied polymer blends over a wide range of pressure and temperature(0-200 MPa and 298.15-338.15 K).
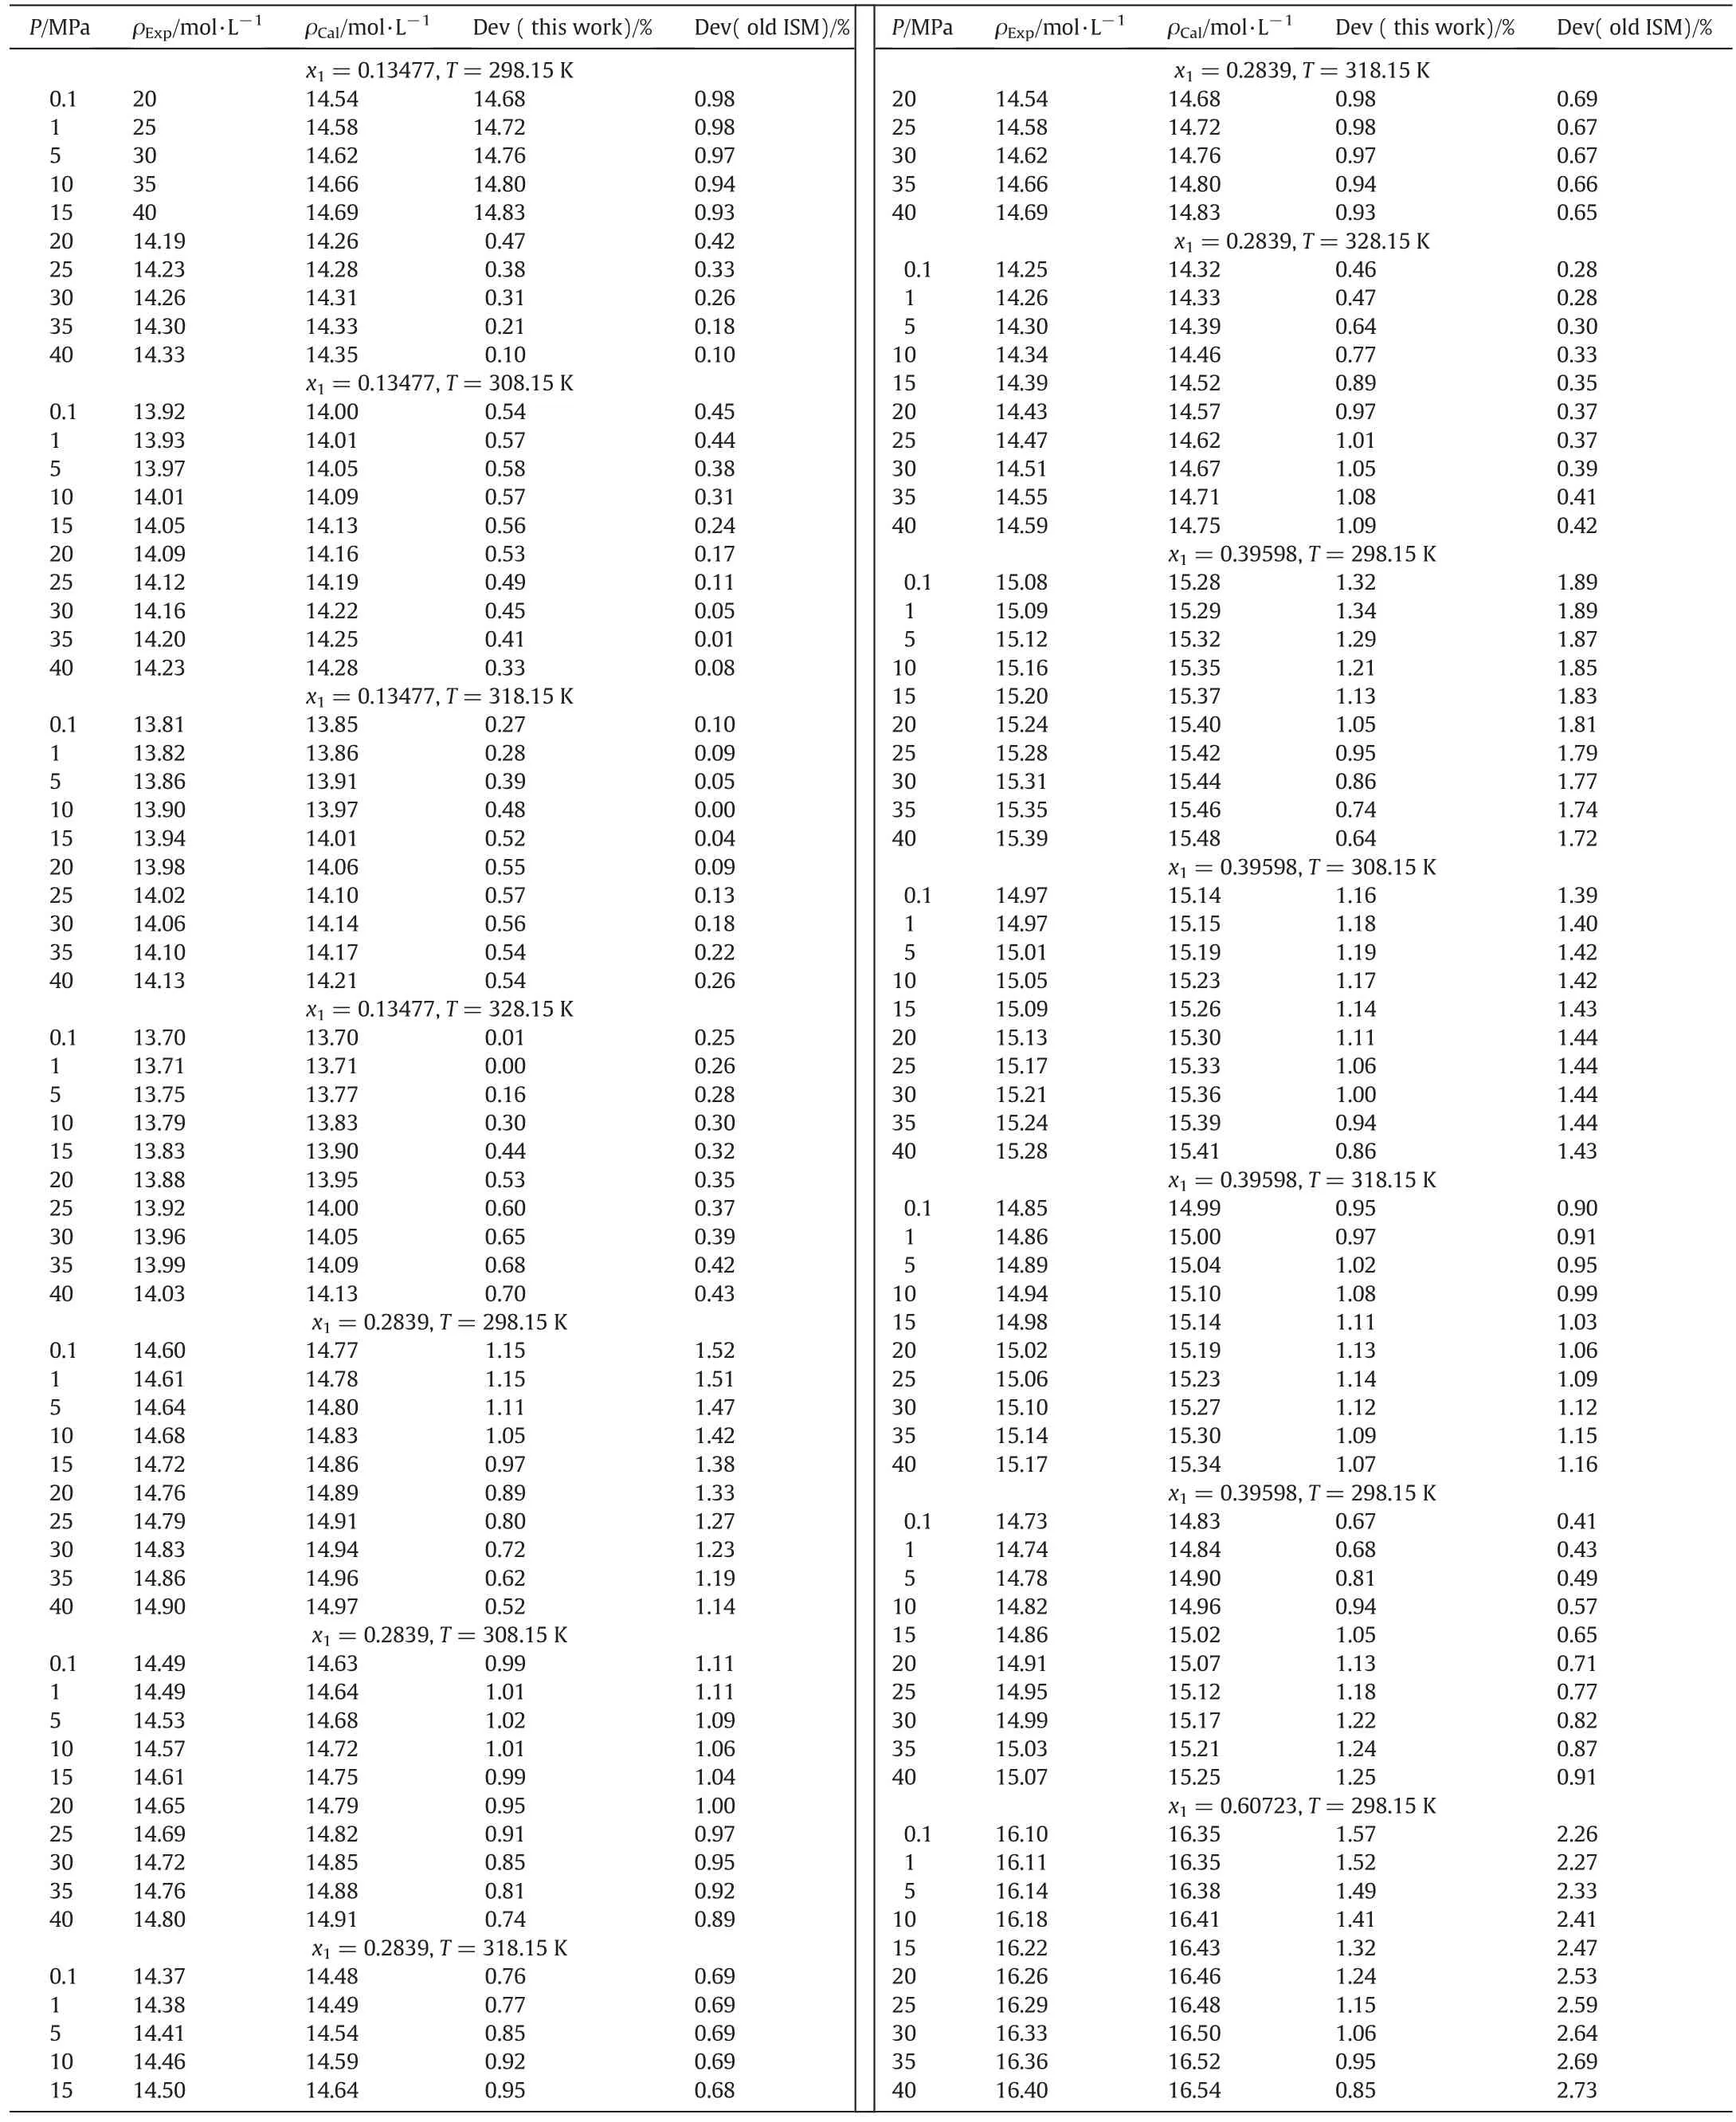
Table 3 Calculated density and percent deviation from experimental data[27]for PEG-200+PPG
Table 3(continued)
Figs.1-5 display the deviation plot of the calculated densities vs.temperatures for PPO+PS amorphous polymer blends using modified ISM EOS from the literature data[26]at mole fractions 0.9,0.7,0.5,0.3 and 0.1,respectively.These figures clearly show that values of AAD for this system at above mentioned mole fractions are about 0.5%.Also,the average absolute deviations of PPO+PS polymer blends at other mole fractions of PPO(0.8,0.6,0.4 and 0.2)are 0.65%,0.44%,0.49%and 0.51%,respectively.
Because of the ISM EOS was extended to PPO+PS and PS+PVME using glass transition data of pure polymers therefore,glass temperature of pure polymer directly affects the ISM EOS for polymer blends.Figs.1-5 show that the calculated deviations do not change with temperature uniformly and there exists a peak at some temperatures.This behavior probability is attributed to the fact that the peak is observed at glass temperature of pure polymer with major component.For example in Fig.1,there is a peak neat to the glass temperature of PPO that has the highest mol fraction.
In addition,the densities of PS+PVME amorphous polymer blends at temperatures between 300-470 K,pressure up to 200 MPa and various mole fractions of PS(0.9-0.1)are calculated.Figs.5-10 show thedeviation plot of the calculated densities vs.temperatures using modified ISMEOS from the experimental values[26]for PS+PVME polymer blends at mole fractions 0.9,0.7,0.5,0.3 and 0.1,respectively.The average absolute deviations of other mole fractions of PS(0.8,0.6,0.4 and 0.2)are 0.75%,1.45%,2.49%and 2.02%,respectively.Figs.6-10 show
that the calculated deviation of PS+PVME at some pressure decreases with the increase of temperature,while for others it increases with the increase of temperature.The observed max or min at these figures is near to the glass temperature of polymer component that has the highest abundance in the blends.

Table 4 Calculated density and percent deviation from experimental data[25]for PEGME-350(1)+PEG-200(2)
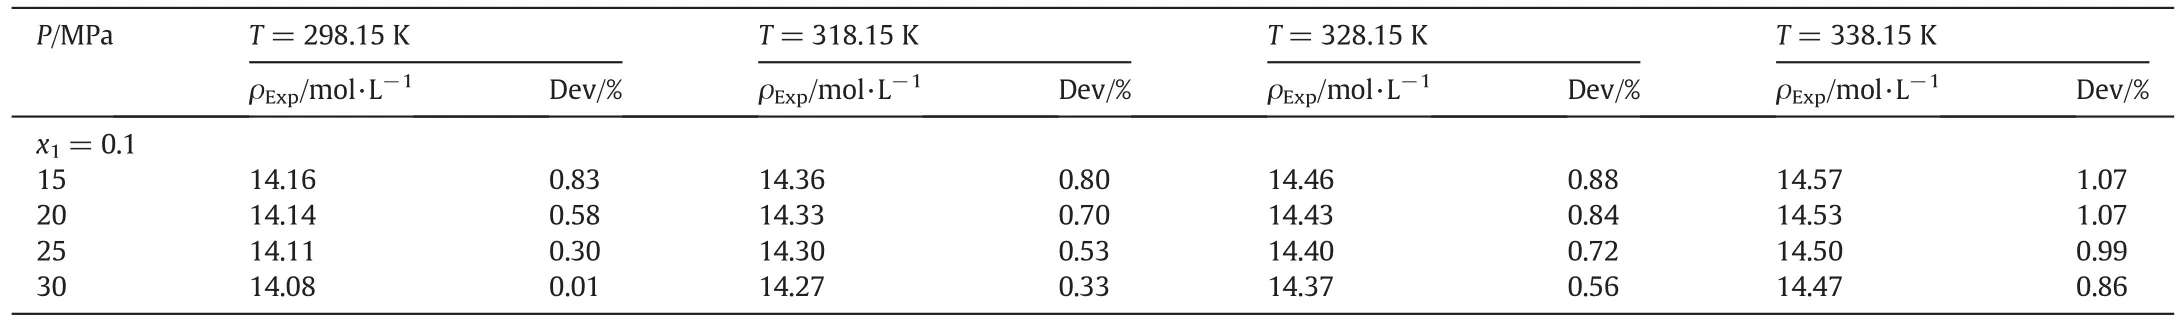
Table 4(continued)

Table 5 Calculated density and percent deviation from experimental data[25]for PEGME-350(1)+PEG-600(2)
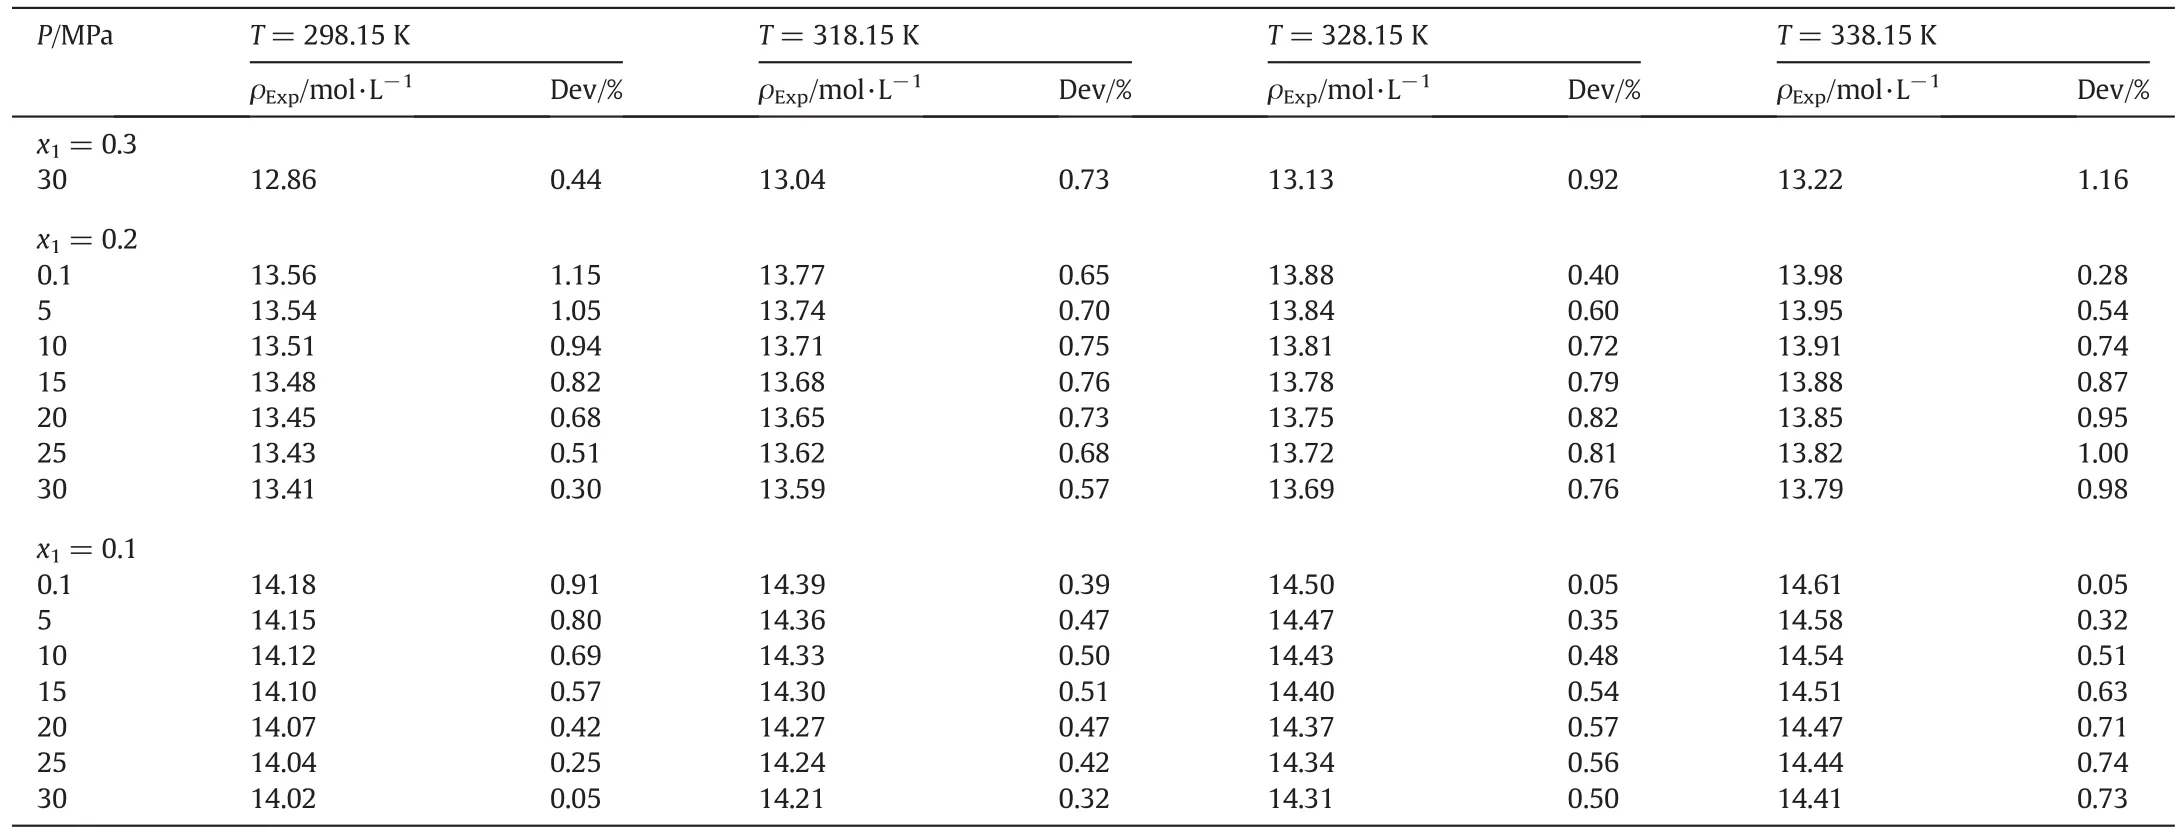
Table 5(continued)

Table 6 Results of density predictions for considered polymer blends
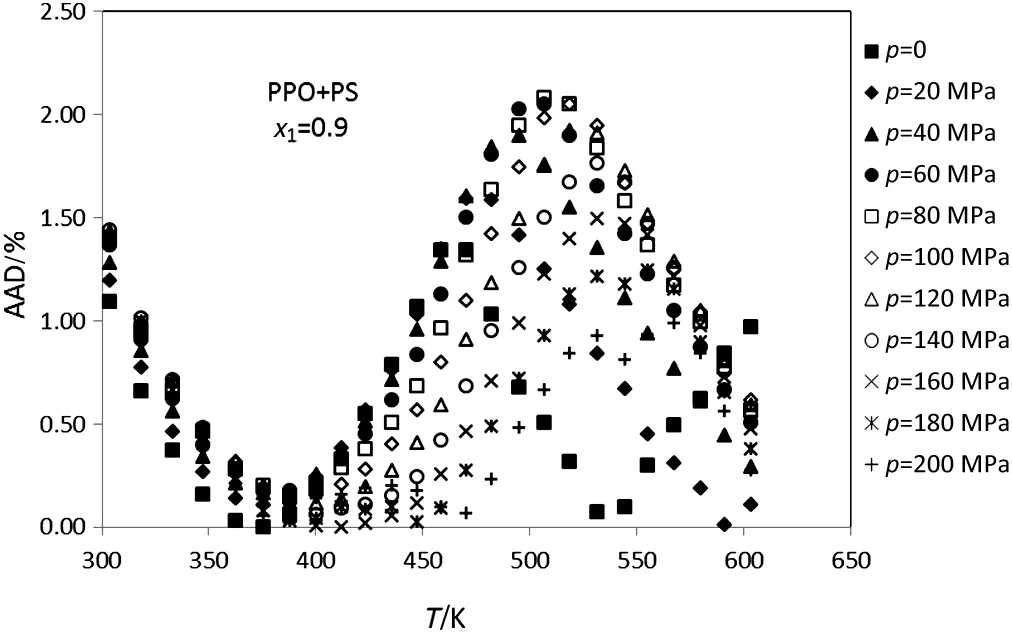
Fig.1.Plot of deviation of the calculated densities versus temperature for the PPO+PS(x1=0.9)using modified ISMEOS from experimental data[26].

Fig.2.Plot of deviation of the calculated densities versus temperature for the PPO+PS(x1=0.7)using modified ISMEOS from experimental data[26].

Fig.3.Plot of deviation of the calculated densities versus temperature for the PPO+PS(x1=0.5)using modified ISMEOS from experimental data[26].

Fig.4.Plot of deviation of the calculated densities versus temperature for the PPO+PS(x1=0.3)using modified ISMEOS from experimental data[26].
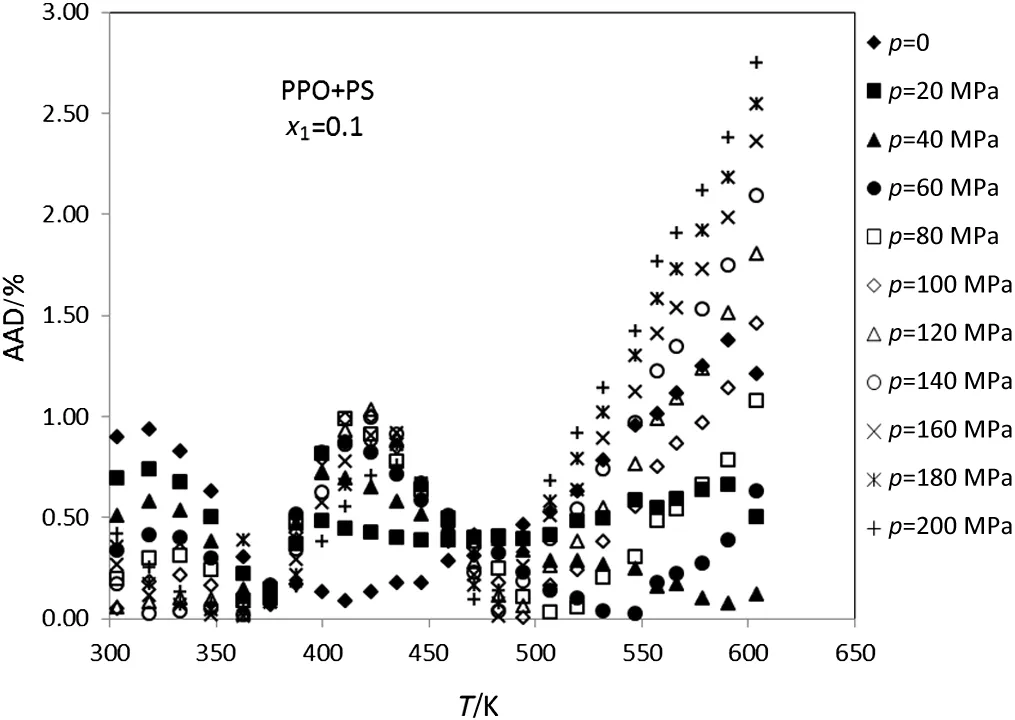
Fig.5.Plot of deviation of the calculated densities versus temperature for the PPO+PS(x1=0.1)using modified ISMEOS from experimental data[26].
The excess volume,VE,is one of the other thermodynamic properties investigated in this study.The excess volume is related to the molecular interactions in a mixture.By definition,the excess volume of a binary system is calculated via the following equation.

Fig.6.Plot of deviation of the calculated densities versus temperature for the PS+PVME(x1=0.9)using modified ISMEOS from experimental data[26].
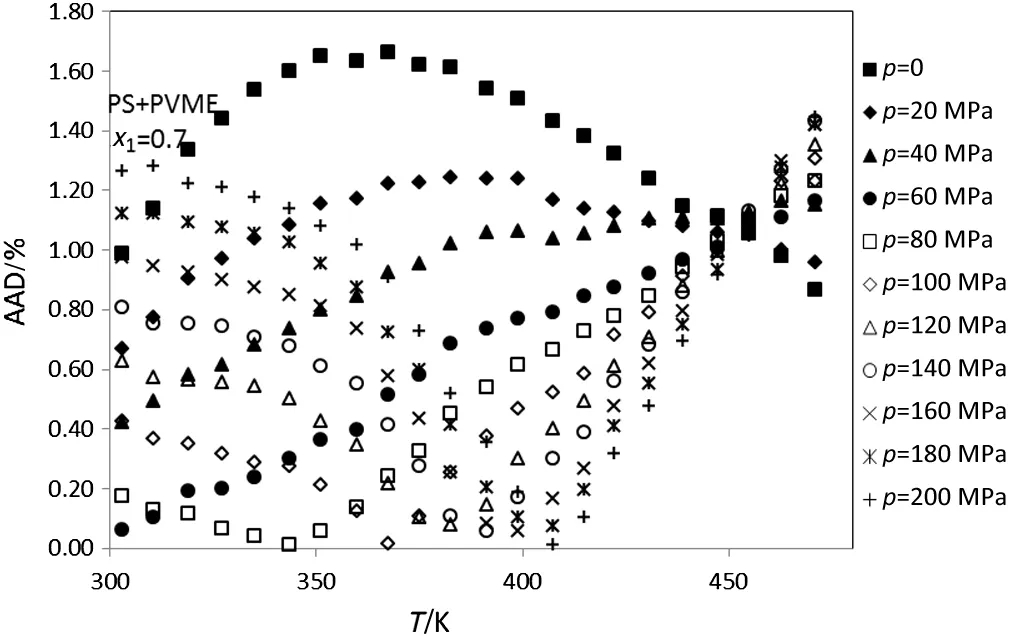
Fig.7.Plot of deviation of the calculated densities versus temperature for the PS+PVME(x1=0.7)using modified ISMEOS from experimental data[26].
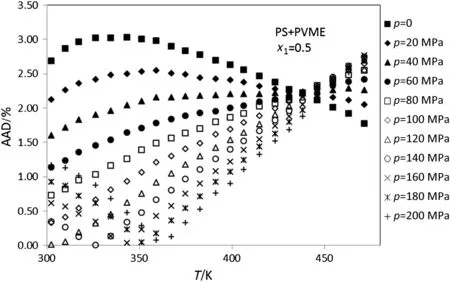
Fig.8.Plot of deviation of the calculated densities versus temperature for the PS+PVME(x1=0.5)using modified ISMEOS from experimental data[26].

Fig.9.Plot of deviation of the calculated densities versus temperature for the PS+PVME(x1=0.3)using modified ISMEOS from experimental data[26].

where Vmis the molar volume for component i of mixture.xi,Viand Mistand for the mole fraction,molar volume,and molecular weight,respectively.
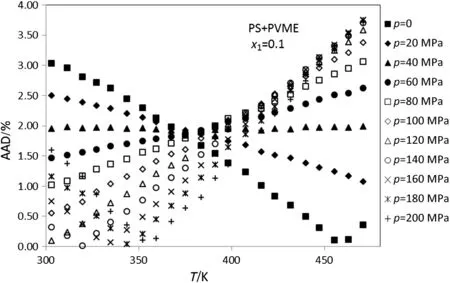
Fig.10.Plot of deviation of the calculated densities versus temperature for the PS+PVME(x1=0.2)using modified ISMEOS from experimental data[26].
Fig.11 shows the variation of excess molar volume vs.composition for PPG+PEG at 1×10⁵Pa with different temperatures.

Fig.11.The variation of calculated excess molar volume with composition for PPG+PEG at 1 bar at different temperatures.
The ISMEOS for the approximation of the volumetric properties of two amorphous polymer blends is examined.The outcome is presented in Table 7.Besides,this table includes the number of data point(NP),the pressure and temperature ranges of all studied polymer blends.As canbe seen from this table,4653 data points were tested for studied polymer blends over a wide range of pressure and temperature(0-200 MPa and 302.65-605.05 K).

Table 7 Results of density predictions for considered polymer blends
5.Conclusions
In this respect,the Ihm-Song-Mason equations of state(ISM)based on temperature and density at melting point(Tmand ρm)as scaling constants,were developed for crystalline polymers such as PPG+PEG-200,PEGME-350+PEG-200 and PEGME-350+PEG-600.Also,for amorphous polymer blends containing PPO+PS and PS+PVME,the density and surface tension at glass transition(ρgand γg)were used for estimation of the second Virial coefficient.
As can be seen from this work,744 data points were examined for the studied crystalline polymer blends over a wide range of pressure and temperature(0-200 MPa and 298.15-338.15 K)and the obtained mean of the deviations was found to be around 0.84%.Furthermore,the absolute average deviation of amorphous polymer blends for 4653 data points over a wide range of pressure and temperature(0-200 MPa and 302.65-605.05 K)was about 1.04%.
 Chinese Journal of Chemical Engineering2015年3期
- Chinese Journal of Chemical Engineering的其它文章
- Micromixing characteristics in a gas-liquid-solid stirred tank with settling particles☆
- An experimental study of drag reduction by nanofluids in slug two-phase flow of air and water through horizontal pipes☆
- Effect of surfactant type on interfacial area and liquid mass transfer for CO2absorption in a bubble column☆
- Effects of bubbly flow on bending moment acting on the shaft of a gas sparged vessel stirred by a Rushton turbine☆
- Enhanced heat transfer in a heat exchanger square-duct with discrete V- finned tape inserts☆
- A novel purification process for dodecanedioic acid by molecular distillation