Tests and analysis of mechanical behaviours of rock bolt components for China’s coal mine roadways
Hongpu Kang,Jinghe Yang,Xianzhi Meng
aCoal Mining and Designing Branch,China Coal Research Institute,Beijing 100013,China
bState Key Laboratory of Coal Mining and Clean Utilization,China Coal Research Institute,Beijing 100013,China
1.Introduction
Rock bolting is the major reinforcement pattern in underground coal mines in China and other major coal mine countries(Peng and Tang,1984;Hou et al.,1999;Mark et al.,2001).The strength of bolt material has increased significantly in thepast 30 years,from low to high and very high strength(Kang and Wang,2007).In the early period of rock bolting in China’s coal mines,the bolts were made of round steel with yield and tensile strengths of 235 MPa and 380 MPa,respectively.These low strength bolts were applicable for roadways under simple geological conditions.Conventional rebar used for civil engineering had once been used in underground coal mines,which has higher yield strength of 335 MPa,but the rebar profile was inadequate for high-stressed anchoring.Right-screwing ribb
ed steel bolts had also been used in some underground coal mines,which allowed direct installation of nut on the bolt,but the reinforcement effect was low.In addition,high pretension cannot be applied during installation.To overcome these drawbacks,a series of bolt rebars with high strength have been designed and produced subsequently.Compared with the conventional bolt rebar,this new type has the following characteristics:
(1)The shape of the rebar was designed with respect to leftscrewing transverse ribs without longitudinal rib on the surface,which is favourable for stirring resin capsules,and can significantly improve the anchoring quality.
(2)The steel material was specially designed and processed to achieve high to super-high strength.The yield and tensile strengths of the rebar can reach 600 MPa and 800 MPa,respectively,which are about 70%higher than those of the conventional rebar with yield strength of 335 MPa.(3)The rebar has a large elongation rate of more than 20%at
failure,which is greater than that of the rebar with the same strength used in other engineering projects,say about 15%.The newly developed high strength rock bolts have been widely used in many coal mining districts in China,and large deformation and/or failure of roadways have been effectively controlled(Kang et al.,2009,2011).However,as the mining depth increases,the geological conditions are becoming more complex,and some challenging issues arise for roadway reinforcement using the high strength rock bolts subsequently.One of the major issues is that some bolts were fractured,as shown in
Fig.1.Fractured bolts will lose their capacity to support surrounding rock mass,as a result cause roof collapse and rib spalling.The bolt accessories such as plates can also suffer serious deformation as shown in Fig.2,further contributing to decrease in bolting effects.
Comprehensive studies have been conducted concerning the bolt fracture and severe deformation(Gamboa and Atrens,2003;Villalba and Atrens,2009;Li,2010;Kang et al.,2013),which can be roughly classified into four categories:
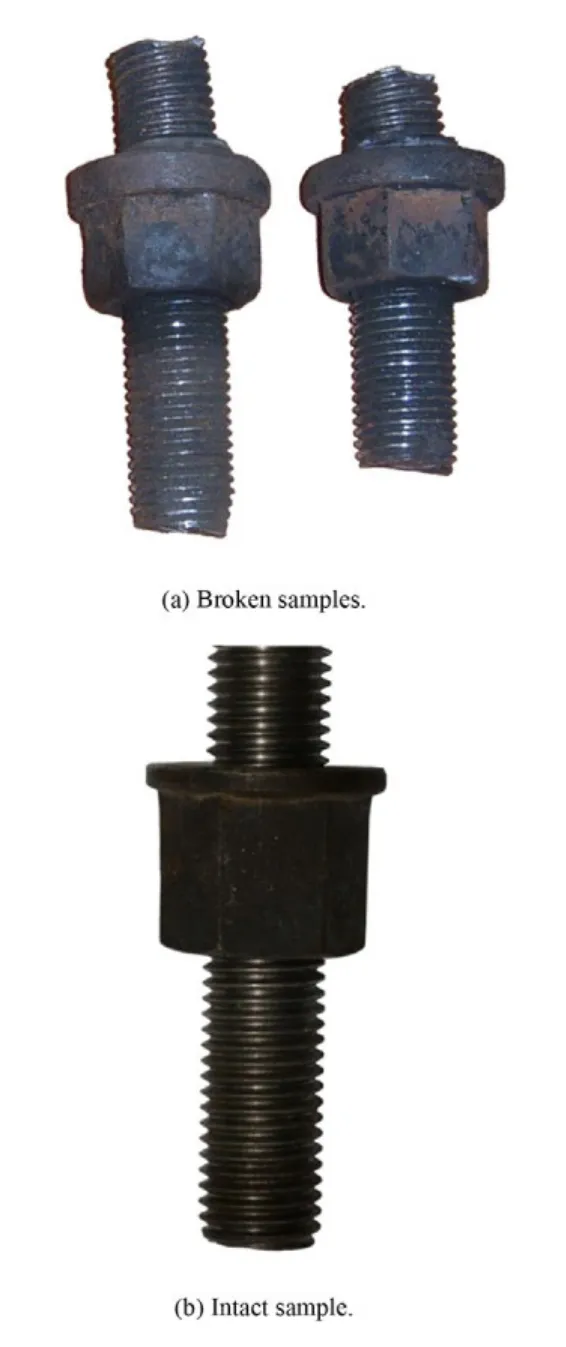
Fig.1.Samples of bolt threads.
(1)Bolt rebar material.The chemical components,mechanical behaviour and microstructure of bolt rebar material are the intrinsic factors for bolt fracturing.A rebar with high strength associated with low elongation and impact ductility is more likely to fail under complex stress states.
(2)Bolt threads processing technology.Fracturing tends to occur at the thread potion of a high strength bolt due to the uneven cross-section and stress concentration induced accordingly.The thread profile and processing technology are of great importance for the mechanical behaviours of bolt bar,which should guarantee the bearing capacity of thread close or even identical to that of the rebar.
(3)Compatibility between bolt components.Bolt components include steel bar,plate,nut,and washer,which should be compatible on geometry,strength and stiffness,so that the bolt works well when installed at an inclined angle with respect to the rock surface.Otherwise,the thread can be stuck by the domed washer,leading to bolt fracturing or components severely deformed.The plate is an important component for the rock bolting system.In this regard,arched plate and domed washer have been developed to match the high strength rock bolt. The strength and deform ability of the plate are related to its thickness,material,shape,and processing technology(Kang and Wu,2012).In addition,the domed washer is used in accordance with the plate to adjust the interaction between the bar,nut and plate.
(4)Bolt stress state.Examinations on failed bolts suggested that bolt failure was rarely caused by tension alone,but by the combination of tensile and shear loads.Fracture of tenoccurs at the thread end or at the rebar close to the plate that suffers from complex stress states of tensile,twisting,bending and shearing loads.
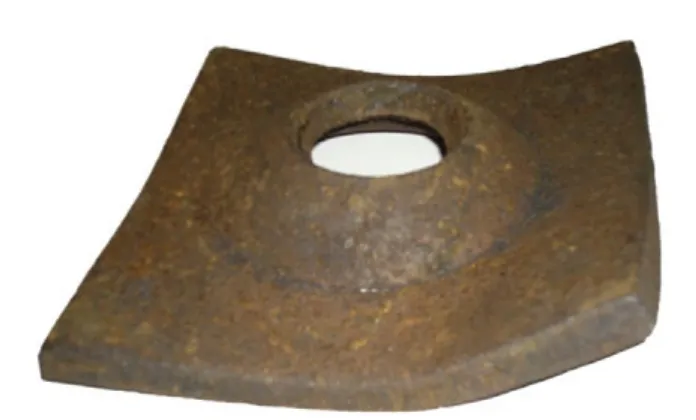
Fig.2.A sample of severely deformed plate.
Unfortunately,since the development and introduction of the high strength bolt considering left-screwing transverse ribs without longitudinal rib on the surface,only simple mechanical behaviour tests of the bolt like rebar tension tests have been conducted.Fracture and failure mechanisms of the high strength bolts have not been thoroughly investigated.In this study,a series of tests on the deformation and fracture characteristics of the newly developed high strength bolts were conducted.Steel materials,steel manufacturing and rolling technology have been improved using the test data calibration.The mechanical performances of the high strength bolt have been significantly improved to meet the requirement for supporting coal mine roadways under complex geological conditions.In this regard,the laboratory tests and analyses on deformation and fracture features of the newly developed high strength bolt rebar,threads and related components were presented,including rebar and thread tensioning,investigation of thread profile and fracture surface,compression of plate and domed washer.The bolts were sampled from coal mines and tested on an electro-hydraulic servo-controlled testing machine.Numerical simulation was performed to study the stress distribution in the plate and domed washer and their compatibility.Finally,a case study was presented to evaluate the reinforcement effects of the newly developed high strength bolts.It should be noted that the anchorage tests between bolt and resin,and that between resin and surrounding rocks are beyond the scope of this paper.
2.Laboratory test conditions
2.1.Test equipment
An electro-hydraulic servo-controlled testing machine JAW-1500 was used for applying extension and compression loads on the rock bolt components,as shown in Fig.3.
2.2.Test samples
The test samples include rebar,thread,plate,domed washer and anti-friction washer.A total of 96 rock bolt components of 20 types were tested,as listed in Table 1.Five types of rebars were from four steel companies with one providing two types of different strengths.Five types of threads were corresponding to five types of rebars.Seven types of plates were from six rock bolt manufacturers with one involved in two types,and three types of anti-friction washers were tested.
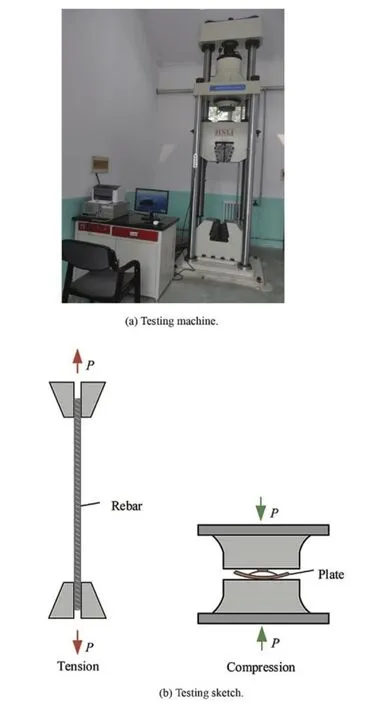
Fig.3.JAW-1500 electro-hydraulic servo-controlled testing machine and diagrammatic sketch.
3.Extension tests on rebars
3.1.Test approach
Extension tests were performed on rebars to evaluate their mechanical performances.Five types of rebars sampled from four steel companies were tested.Each type of rebar consists of 3-5 rock bolts obtained from three coal support material companies.These bolts were 2.4 m in length and
22 mm in diameter,and had three levels of yield strength of 335 MPa,500 MPa and 600 MPa,respectively.Each bolt was cut into a 700-mm long sample when prepared for tests.The samples were named as B335,B500-1,B500-2,B500-3 and B600,in which the numbers 335,500 and 600 indicated the yield strength level.Extension load was applied to the two ends of sample through a fixture on the machine.The length of the boltend fixed by the fixture was 100 mm at each end,leaving a 500 mm long section under pure extension.During the test,the extension load was gradually increased until the sample was broken.Gauge spots with spacing of 55 mm were attached on the extension section to measure extension,and an extensometer gauge with length of 110 mm was used to measure elastic strain of the rebar.
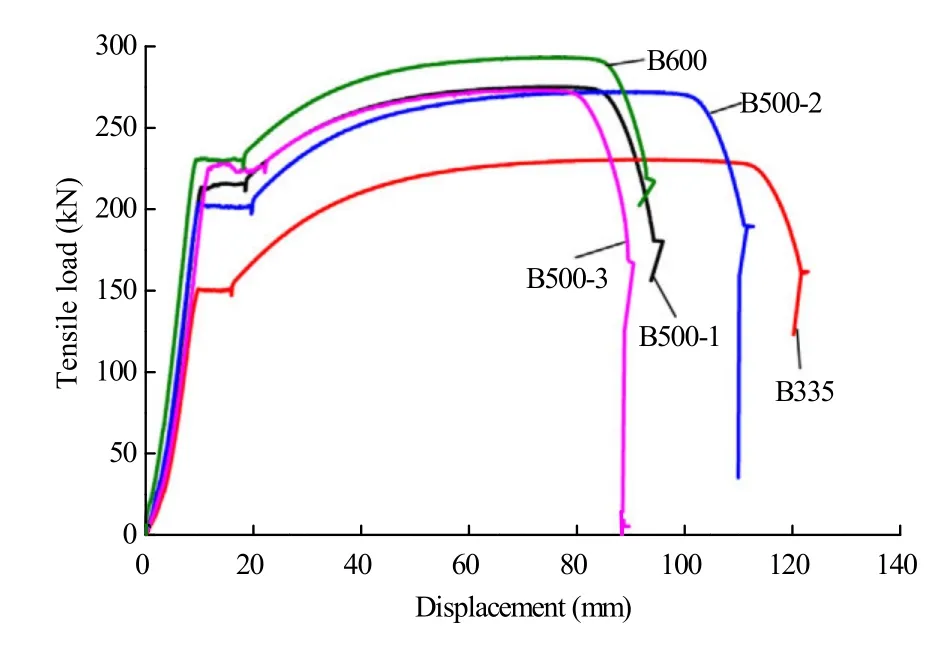
Fig.4.Tensile load versus displacement of 5 rebar samples subjected to extension.
3.2.Test results
Fig.4 shows the curves of tensile load versus displacement of 5 rebar samples subjected to extension.The displacement was composed of not only that of the rebar,but also the sliding displacement between the rebar end and the fixture on the machine,and the displacement of tensioned parts on the machine.
Fig.5 shows the curves of tensile stress versus elastic strain of 5 rebar samples recorded from the extensometer gauge.Figs.6-8 show the fracture surface of the sample B500-1.The test results listed in Table 2 are in terms of extension load and strength,where
Pmaxis the maximum load;σsuis the upper yield strength,i.e.the maximum stress prior to the first dropping during yielding;σslis the lower yield strength,i.e.the minimum stress when the rebars yielded except for the initial instantaneous effect;σbis the tensile strength;and σs/σbis the yield to tensile strength ratio.
(1)The five types of rebars exhibit similar tensile stressd is placement patterns.At the early stage of extension,the curves were basically non-linear,which was mainly attributed to the sliding between the rebar and the fixture.Beyond this stage,the tensile stress increased linearly with displacement until it reached the elastic limit.There was a slight differencein the calculated elastic modulus of the five rebars according to

Table 1Test content of rock bolt components.
Fig.5,ranging from 193 GPa to 212 GPa.Beyond the elastic limit,the rebar underwent a non-linear deformation,and yielded when the tensile stress reached the upper yield strength.The displacement increased evidently with only a slight variation in load at this stage,followed by a strengthening stage characterised by a significant displacement change with the load.After the peak load,the load dropped dramatically till the rebar was broken.
(2)The tensile strength of the B500 rebar was 17.2%-24.3%greater than that of the B335 rebar,and the load at failure of the B500 rebar with a diameter of 22 mm was over 260 kN.The tensile strength of the B600 rebar was 28.7%greater than that of the B335 rebar,reaching 300 kN.The specially designed steel material and improved steel manufacturing and rolling processes can significantly improve the strength of the rebar.
(3)The lower bounds of yield strengths of the B500 and B600 rebars were 33.6%-50.5%,and 58.3%greater than that of the B335 rebar,respectively.The differences between the upper and lower bounds of yield strength of the 5 types of rebars were 10-17 MPa,which were much lower than the yield strength.
(4)The elongation rate and the cross-sectional shrinkage of the B335 rebar at failure were 29.5%and 64.3%,respectively,the maximum values among the 5 types of rebars.The elongation rate and the cross-sectional shrinkage of the B500 rebar were 22.7%-25.8%and 61.8%-63.0%,respectively.For the B600 rebar,the two values were 23.7%and 60.3%,respectively.The differences observed in the test results of the B500 rebar are attributed to the fact that the three B500 rebar samples were obtained from three different manufacturers associated with varied quality-controlling technologies.All the rebars exhibited large elongation and the difference in cross-sectional shrinkage was slight.The deformability of the rebar depended on the yield to tensile strength ratio,i.e.the lower the ratio,the higher the deformability.
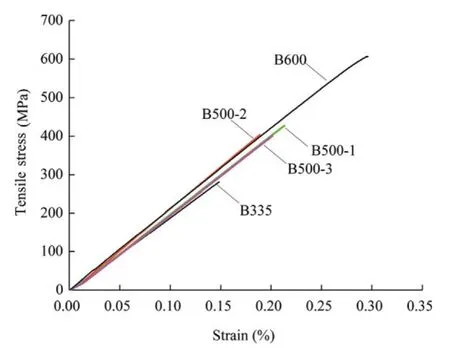
Fig.5.Tensile stress versus strain of 5 rebar samples subjected to extension.
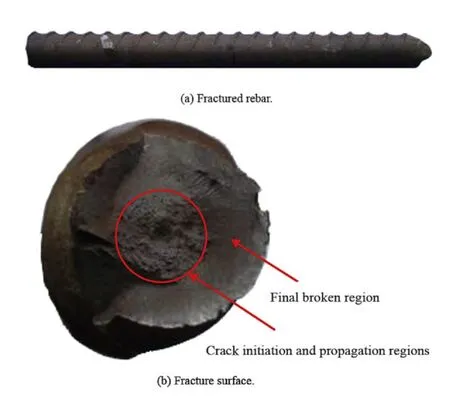
Fig.6.Macromorphology of a fractured rebar sample.
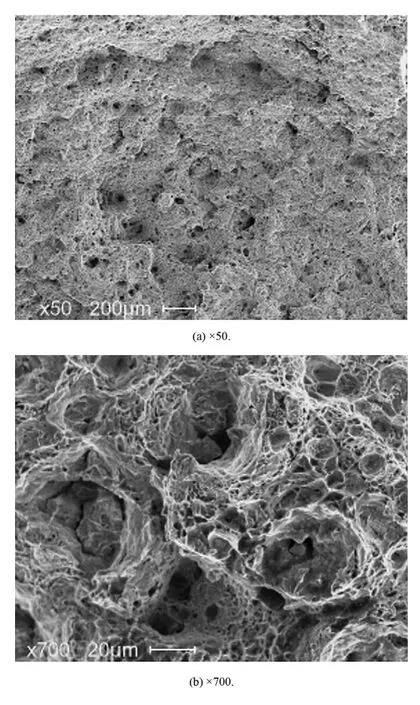
Fig.7.Microstructure of crack initiation and propagation regions on a fractured rebar sample.
(5)The edge around the rebar fracture showed apparent necking with dark grey rough surface.The central section of the fracture surface was relatively neat,which was the crack initiation and propagation regions perpendicular to the extension(Fig.6b).The final broken region was not smooth,with small sections at an angle of about 45°with respect to the extension direction.These small sections were the final fracture surface formed by forward and reverse shear stresses.The crack initiation and propagation regions in the middle of the fracture surface presented the features of equiaxed dimple ductile rupture under observation of scanning electron microscope(Fig.7),and the final crack around the edge of the fracture displayed shearing dimple(Fig.8).The rebar was initially fractured from the central section under tensile stress,and then the maximum tensile stress around the fracture tips changed to shear stress.Finally,the rest section of rebar presented oblique shear breakage in two directions under the forward and reverse shear stresses.
In addition to the mechanical properties of the bolt rebar described above,the bolt rebar should be tough enough to resist brittle fracture at the lowest operating temperature as expected or under the action of impact loads.The impact absorbing energy,a parameter to characterize the impact toughness of bolt material,was also measured.Comparing all the mechanical properties of the B600 rebar obtained in this study to those of the high strength bolt rebar in other countries(as shown in Table 3,whereδmis the elongation rate at the maximum load,δbis the elongation rate at failure,and Akis the impact absorbing energy),it can be noted that the yield and tensile strengths of the B600 rebar were equivalent to those used in UK and Australia.But the elongation rate and the impact absorbing energy were much higher than those used in UK,USA and Australia,indicating that the B600 rebar can endure more deformability and impact ductility under the same stress level applied.
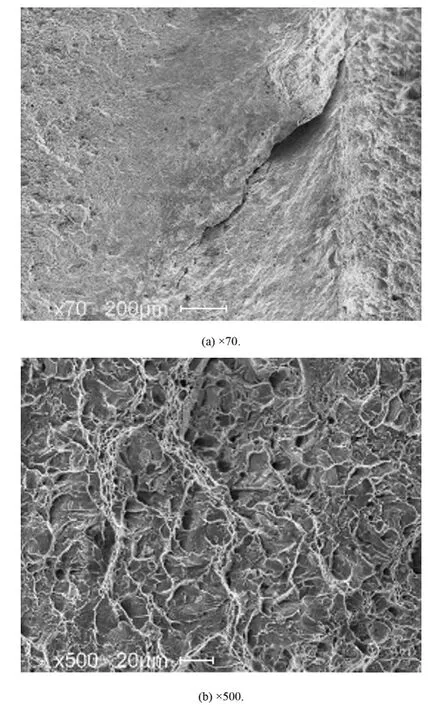
Fig.8.Microstructure of final broken region on a fractured rebar sample.

Table 2Load and strength of rebar under extension.
4.Extension test on threads
4.1.Thread profile
The structural profile of the threads was evaluated prior to tests.
Fig.9 shows the profile of the B500-1 sample where the rough surface,cracks,and flows can be observed.
A high resolution picture of the thread teeth is shown in Fig.10.The thread surface was unevenly distributed and the height of the adjacent two teeth was unequal.Cracks and flows were distributed on the surface of the thread teeth,indicating that the thread had not been appropriately processed.Rough and inaccurate thread processing can result in a low strength of bolts.Meanwhile,high pretension cannot be applied on the thread.Therefore,high-quality processing machines with advanced processing technology are desirable to improve the quality of bolt thread.

Table 3Comparison of mechanical properties of high strength bolt rebar.
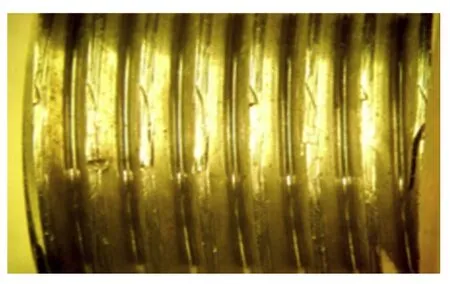
Fig.9.Low magnification photo of thread.
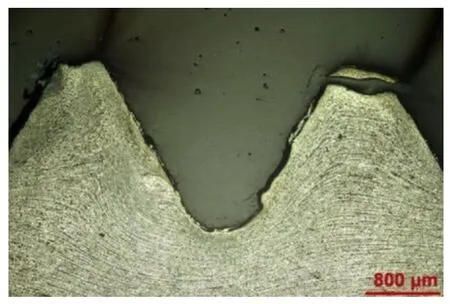
Fig.10.High magnification photo of thread teeth.
4.2.Extension tests
4.2.1.Test approach
Two types of thread samples,i.e.a pure-thread sample and a half-thread sample,were cut from the rock bolts as mentioned in previous sections as shown in Fig.11.All the threads had a specification of M24 and a thread spacing of 3 mm.A specific device was developed to anchor the thread to the loading machine.Purethread samples were 120-150 mm long.The length of the thread anchored to the device was 30-40 mm at each end,leaving a 70-mm long section subjected to extension.The length of halfthread samples was 280 mm,with the thread end anchored to the device and the other end directly fixed to the loading machine,leaving a 170-mm long section subjected to extension.
A total of 20 samples of 5 types(Table 1)were tested with similar testing approach to the rebar as discussed previously.
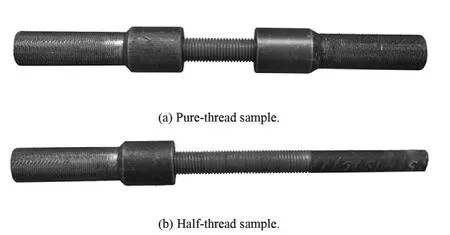
Fig.11.Two types of thread samples.
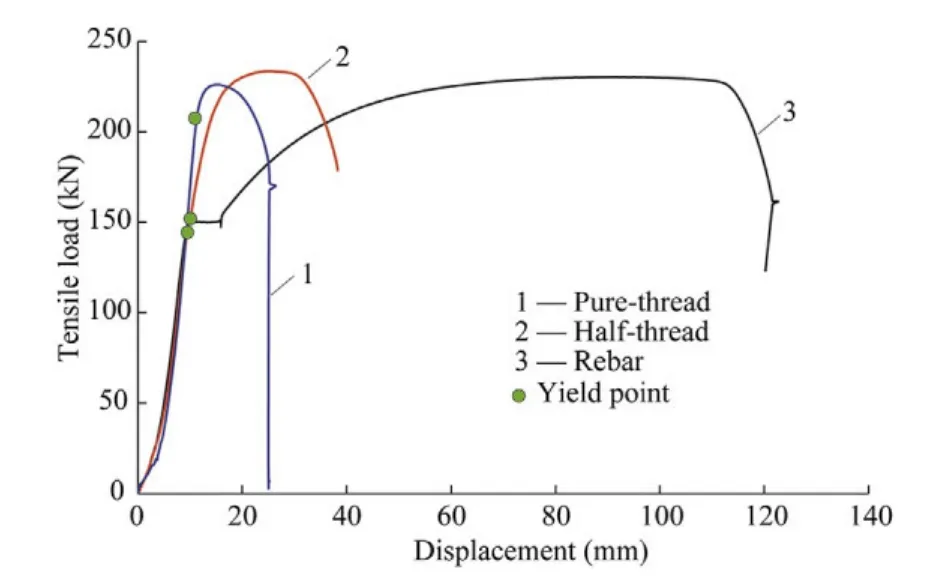
Fig.12.Tensile load-displacement curves of B335 threads subjected to extension.
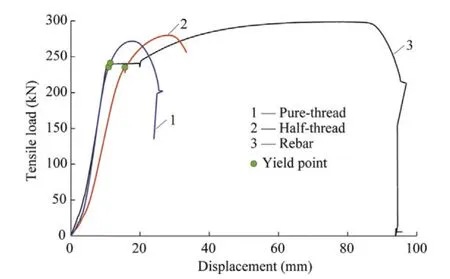
Fig.13.Tensile load-displacement curves of B600 threads subjected to extension.
4.2.2.Test results
The tensile load-displacement curves obtained from the B335 and B600 threads are plotted in Figs.12 and 13,respectively.As for the rebar,the displacements included the thread displacement,the sliding displacement between the thread and the anchor device,the displacement between the anchor device and the fixture on the machine,and the displacement of tensioned parts on the machine.
Fig.14 shows the fracture surface of the thread samples.The test results are summarised in Table 4 in terms of the maximum load and strength.
(1)Both the pure-thread and the half-thread samples exhibited
distinct tensile load-displacement features compared to the rebar.The thread can significantly affect the strength and deformability of the bolts.The yield points of the half-thread samples were almost identical to that of the rebar.Both the upper and lower bounds of yield points were observed even if at the yield stage small displacement was observed.During the hardening stage,the increase in load with displacement was greater than that of the rebar.All the pure-thread samples exhibited a single yield point but with higher yield strength than the rebar and higher load increase beyond this yield point.Minor difference of the maximum load between the two types of thread samples can be expected.
(2)For the half-thread samples,all the B500 and B600 samples failed at the thread section while all the B335 samples were broken at the rebar section.The maximum loads of the B335,B500-1,B500-2,B500-3 and B600 were 102.7%,102.7%,98.6%,98.4%and 94.2%of the maximum load of the rebar,respectively.The strength of half-thread sample tended to decrease with the increasing strength of steel material.
(3)For the pure-thread samples,the maximum loads of the B335,B500-1,B500-2,B500-3 and B600 were 98.5%,99.8%,99.1%,104.1%and 91.4%of the value of the corresponding rebar,respectively.The first three samples had similar tensile strength compared to the rebar and the fourth had higher tensile strength than the rebar.The B600 sample,however,had considerably lower tensile strength than the rebar.This can be possibly accounted for by the factor that the flaws generated in rolling process result in lower thread strength,i.e.the higher the bolt strength,the more difficult the rolling process.
(4)The thread section exhibited higher yield strength with smaller cross-section than the rebar,indicating that the tensile and yield strengths of the thread were increased after processing.For the pure-thread samples of the B335,the tensile and yield strengths were increased by 11.1%and 57.0%,respectively.The two values for the B500-2 sample were 11.3%and 38.4%,while 3.2%and 14.3%for the B600,respectively.The strength increasing rate tended to decrease with respect to steel material strength.The yield to tensile strength ratio for pure-thread samples was higher than that of the rebar as the increasing rate of tensile strength was less than that of yield strength.
(5)For the pure-thread samples,the elongation rates at failure of the B335,B500-1,B500-2,B500-3 and B600 samples were 20.5%,13.5%,17.9%,18.9%and 22%,respectively,which were 69.5%,57.0%,69.4%,83.3%and 92.8%of the value of the corresponding rebar,respectively.The elongation rate of the thread tended to increase with material strength.The elongation rate at the maximum load of the pure-thread samples was larger than that of the half-thread samples.In a global sense,however,it was also less than that of the rebar.In other words,the deformability capability of the thread is weaker than the rebar.
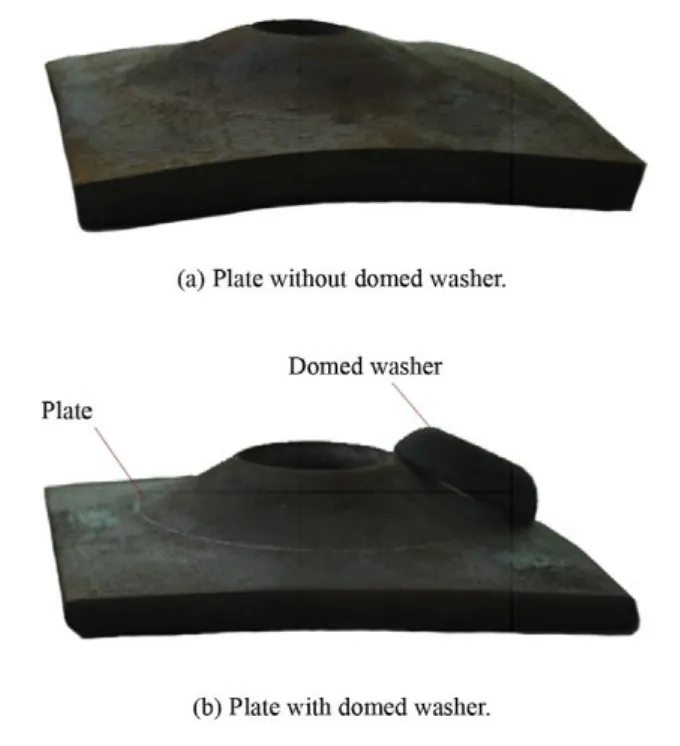
Fig.15.Two types of plates for tests.
5.Plate and washer tests
5.1.Test samples and approach
5.1.1.Plate and domed washer
Compression tests were performed on two types of plates to evaluate their bearing capacities,i.e.the plate with and without domed washer as shown in Fig.15.The domed washer has a major impact on the stress conditions of rock bolt when the bolt is not installed perpendicularly to the plate.
Fig.16 shows the details of the plate and domed washer,where hp,hwand h are the heights of plate and domed washer and their combination height,respectively;t and l are the thickness and width of plate,respectively;r is the radius of the transitional arc connecting bearing arch and bottom surface;dp1and dp2are the diameters of lower bearing arch and hole in plate,respectively;dw1is the maximum external diameter of domed washer;and dw2is the diameter of the hole in it.
A total of 7 types of plates with different geometries were sampled from 6 rock bolt manufacturers for the tests.Table 5 gives the geometric parameters of these plates.The steel type of the plate P-4 was Q195 and all the others were Q235.
The plates(with or without domed washer)were placed between the platen of the servo-controlled machine and the press head(Fig.17).Cares were given to the deformation and failure of the plates.
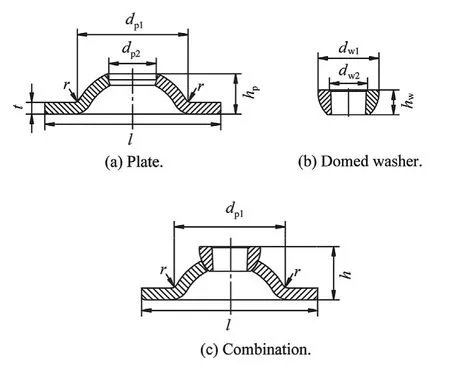
Fig.16.Schematic diagrams of plate and domed washer.
5.1.2.Anti-friction washer
A plastic washer was placed between the nut and domed washer to reduce the friction between them and subsequently increased the coefficient of the torque-to-tension conversion.The mechanical performance of the plastic washer depends on its material,thickness and diameter.A series of torque-to-tension conversion tests were performed to evaluate the performance of the plastic washer,and 4 types of threads(M18,M20,M22 and M24)were used.Each type of thread had 3 samples tested under 3 different conditions,i.e.no plastic washer,1010 polyamide washer,and high density polyethylene washer.These tests were carried out on a specifically designed machine for testing torque-to-tension conversion(Fan,2007;Li,2012).
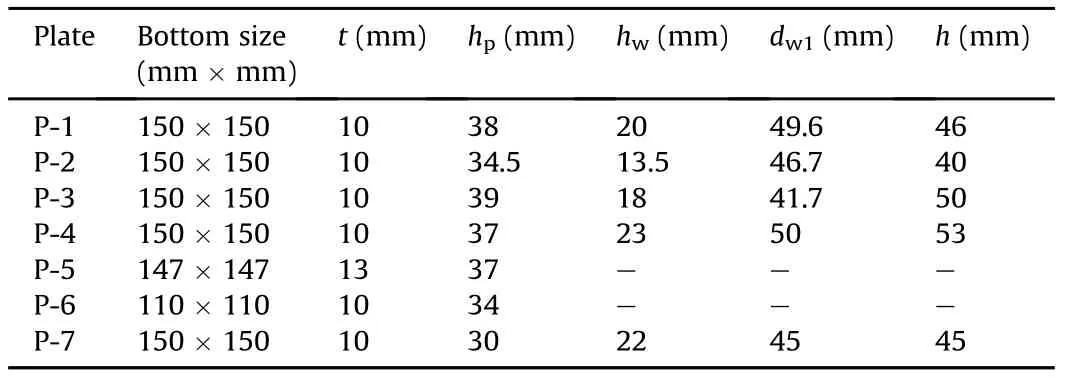
Table 5Geometric parameters of plates.
5.2.Test results
5.2.1.Plate and domed washer
Fig.18 shows the load-displacement curves of the 7 testing plates subjected to compression.A plate is considered to fail when the compressive deformation of the plate reaches 30%of its original height(The Professional Standards Compilation Group of People’s Republic of China,2011).The deformation and failure of the plates under compression can be classified into five stages as shown in Fig.19:(1)stage I,the bottom surface is flat at compression;(2)stage II,the bottom surface starts to warp;(3)stage III,the interior annulus line(A,A′in Fig.19)on the base of the arch starts to contact the bottom platen;(4)stage IV,the maximum load is reached;and(5)stage V,the arch is flat at compression or the domed washer is pushed to contact the bottom platen.The load and deformation of the plates at different deformation stages are given in Tables 6 and 7,respectively,where Pfis the failure load of plates.Figs.20 and 21 present the failure patterns of plates without and with domed washer,respectively.
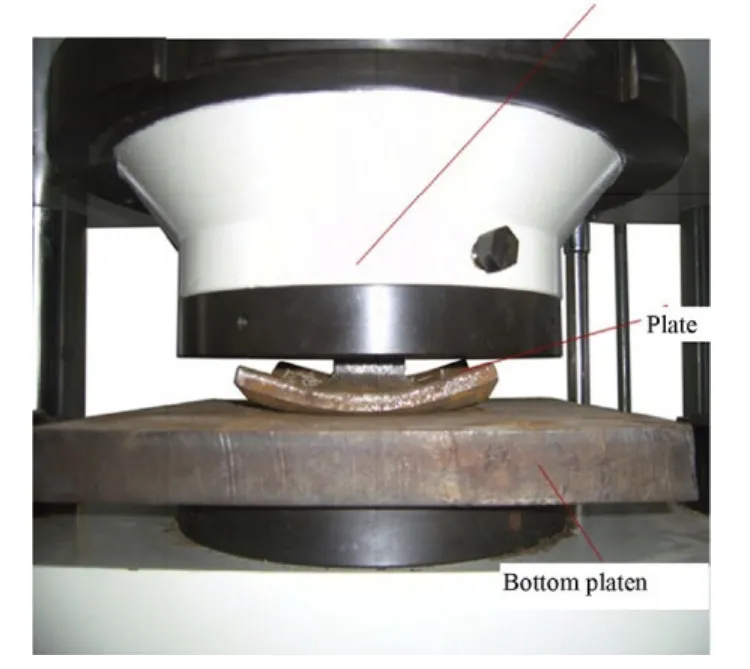
Fig.17.Plate load-bearing tests.
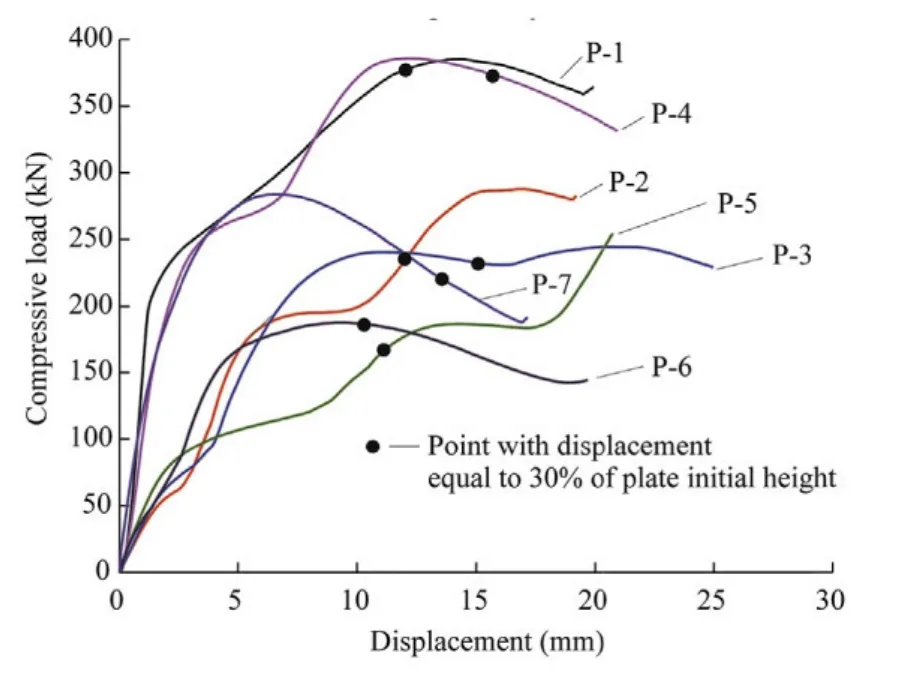
Fig.18.Load-displacement curves of plates under compression.
(1)Different types of plates exhibited different characteristics of deformations and failure modes.Typical deformation and failure process of arch-shaped plate can be divided into 5 stages.Stage I was from the beginning of loading to the state that the bottom surface became completely flat under compression.During this stage,the gap between the platen and the bottom surface of the plate was gradually reduced under compression till the two parts were completely attached.With continuous loading,the compression load increased rapidly until the periphery of the bottom surface of the plate started to warp upward.Then the increasing rate of compression load tended to decrease,and this stage was regarded as stage II.Stage III was from the end of stage II to the point that the interior annulus line on the base of the arch started to contact the bottom platen.At this stage,the periphery of the bottom surface of the plate continued to warp upward.The compressive deformation of the plate increased dramatically with slight increase in load.The majority of the loads were subjected to the bearing arch of the plate.Stage IV was from the end of stage III to the point that the compression load reached its peak value.At this stage,the load increased to the peak value rapidly.Stage V was from the end of stage IV to the state that the plate was flat under compression.At this stage,the bearing arch moved downward,and then extended outward and turned over.The load gradually decreased until the arch turned to be flat or the domed washer reached the bottom platen.The loads at failure of plates were usually between stages III and IV(3 of total 7 plates in Table 7),IV and V(3 of total 7 plates),and only one plate(P-3)failed between stages II and III.
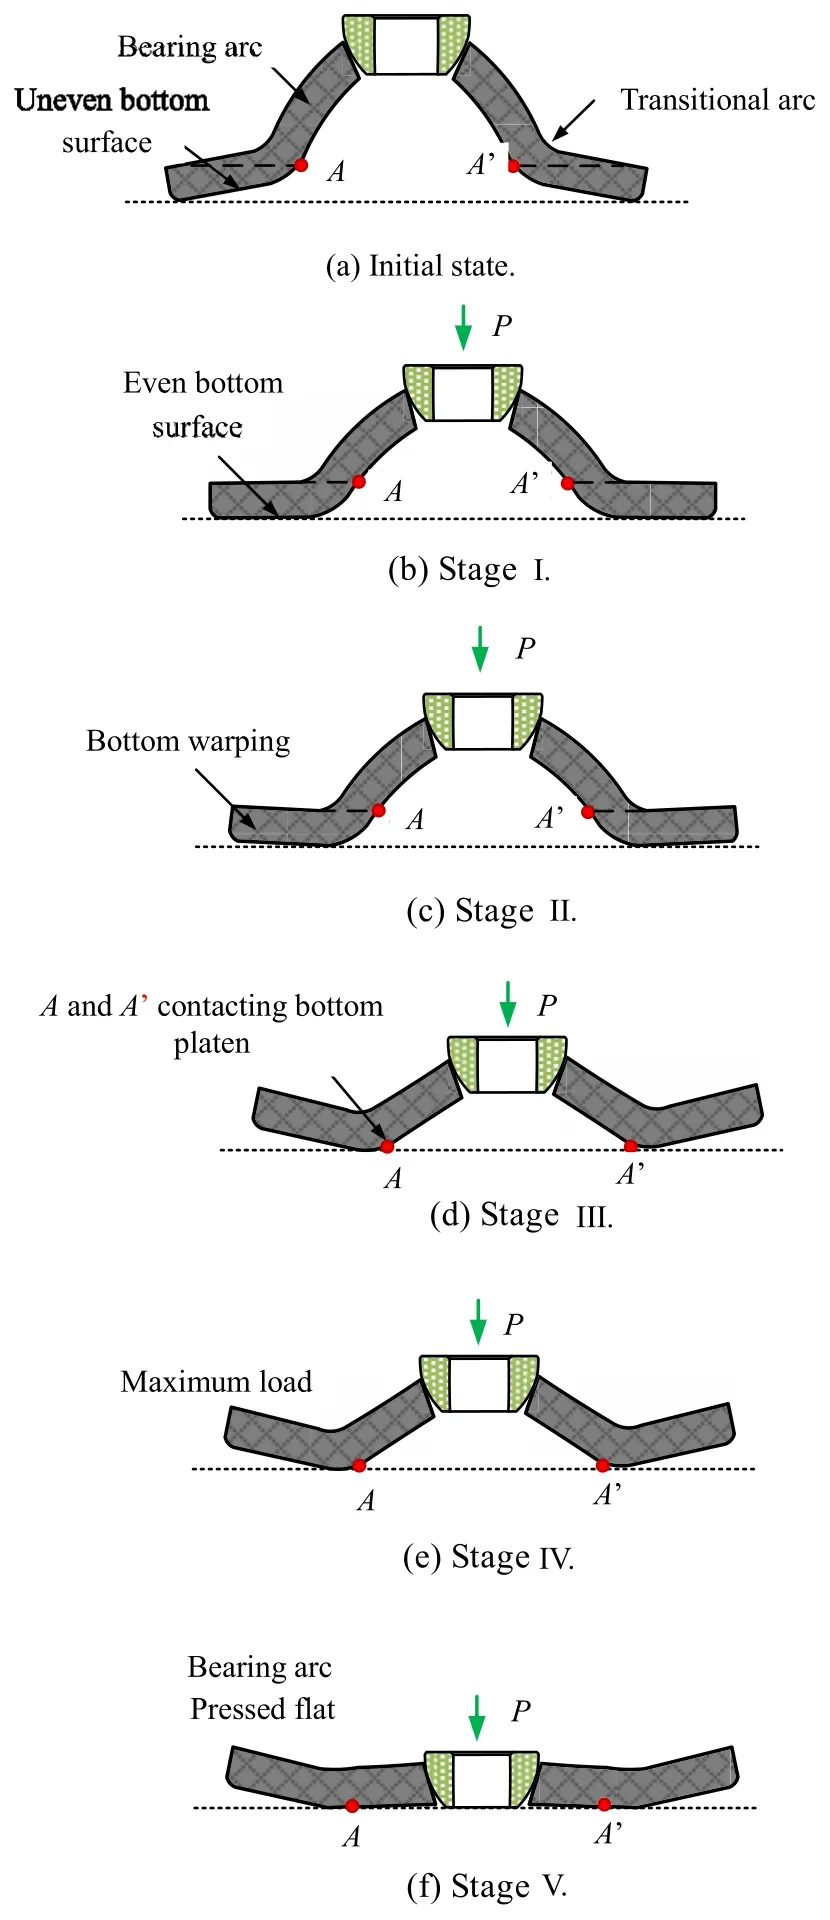
Fig.19.Schematic diagram showing deformation stages of plates under compression.

Table 6Loads of plates at different deformation stages(unit:kN).
(2)The bearing capacity,deformation process,key points during deformation,and deformation magnitude of the plates were different due to the differences in plate shape,size,material and the presence of domed washer.The deformation process of the 7 tested plates can be classified into 3 types:the first type included plates P-1,P-2,P-3 and P-4.The second type involved plate P-5 that was similar to the first type(stages I-V).The only difference was that the load on the plate increased to a high value after stage V,which may account for the fairly large plate thickness and small arch height,and the plate was finally pressed to be flat to contact the bottom platen.The third type covered plates P-6 and P-7.Deformation increased with loading until the arch was overturned.For this type,stage III was not evident,leading to a direct transition between stages II and IV,which might be related to the relatively small height of plates.
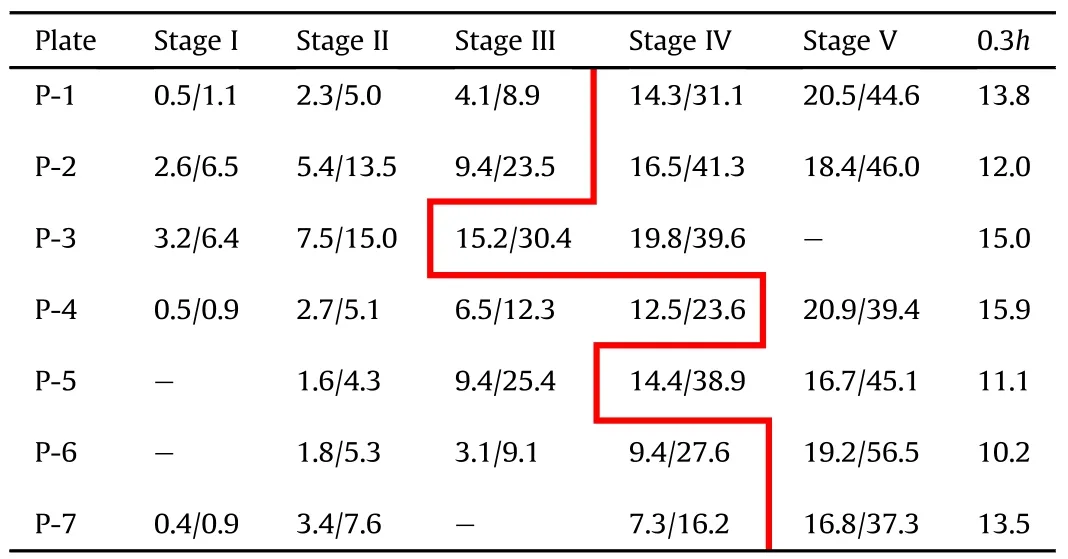
Table 7Displacement(mm)and compression rate(%)of plates at different deformation stages.The red line indicates the stage at which the compressive deformation of the plate reached 30%of its original height,h(mm).
(3)The tested plates exhibited different load-bearing capacities.The plates P-5 and P-6 showed the lowest load-bearing capacity,which mainly attributed to the uneven bottom surface(Fig.19a),leading to an unclear transition between the bearing arch and the bottom surface.The load-bearing capacity of the plates P-2,P-3 and P-7 was intermediate among the tested plates.The relative low load-bearing capacity was observed due to the large transitional arc between the bearing arch and the bottom surface.The load-bearing capacity of the plates P-1 and P-4 was the highest with the maximum load of 389.3 kN and the load at failure was more than 370 kN.These two types of plates had even bottom surface and small transitional arc between the bottom surface and the bearing arch.It can be concluded that higher bearing arch,smaller transitional arch between the bottom surface and the bearing arch,and even bottom surfaces contribute to higher load-bearing capacity.The influences of plate thickness and material were minor.It is recommended that the height of plate should be larger than 34 mm for arched plate with a size of 150 mm×150 mm×10 mm.It should be noted that although the maximum load of the plate P-7 with a height of 30 mm was higher than those of the P-2 and P-3 plates with the height of 34.5 mm and 39 mm,respectively,the load at failure of the plate P-7 was less than those of the P-2 and P-3 plates as the load on the plate P-7 dropped rapidly beyond the failure point.
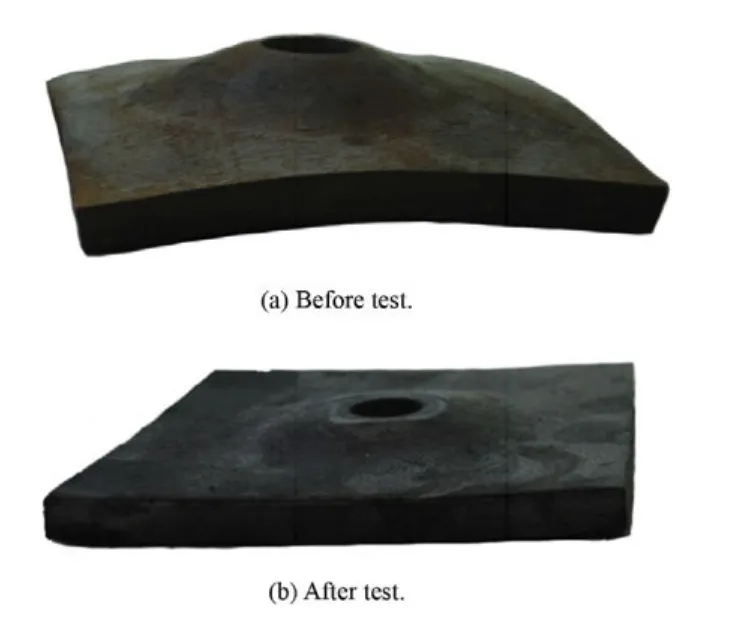
Fig.20.Failure pattern of the plate without domed washer.
(4)The tested plates exhibited different deformability behaviours.The compression rate(the ratio of plate compression displacement to its initial height)of the plates P-2 and P-3 was much larger than that of the other plates at stages I and II.There were three plates exhibiting high deformability with the compression rate more than 23%at stage III,where the compression rate of the plates P-1 and P-4 was less than 13%.At stage IV,three plates had compression rate more than 30%at failure.The final compression rate of all the plates was 37%-57%,suggesting that an appropriate plate should exhibit high load-bearing capacity and a certain degree of compression rate.The plates P-1 and P-4 were considered to have reasonable structure and excellent mechanical performance.In a common sense,an inadequate design of plate will result in low load-bearing capacity and high deformation rate.
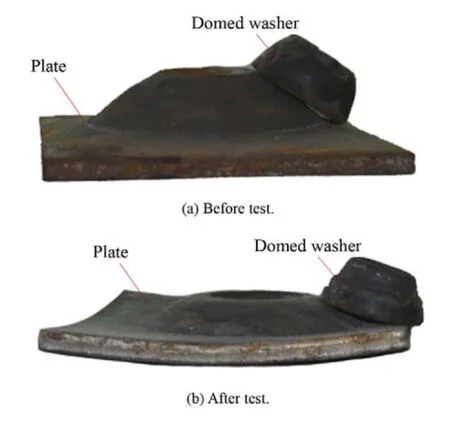
Fig.21.Failure pattern of the plate with domed washer.
(5)The plates with domed washer had an initial gap between the plate and the domed washer prior to loading.The gap disappeared when the load was applied.The load at failure of the 5 plates with domed washer was 220-378 kN.The plates P-2,P-3 and P-7 with load at failure of 220-237 kN were comparable to the bearing capacity of BHRB500 rock bolt with 22-mm diameter(250 kN),while the plates P-1 and P-4 with load at failure of 372-378 kN were comparable to BHRB600 bolt with 25-mm diameter(380 kN).The rotatable movement between the plate nest and the domed washer was critically important for the performance of the plate.Two of the 5 plates exhibited small deformation in the domed washer and no evident compression was observed on it,indicating a favourable performance of the domed washer.The other 3 plates exhibited large deformation and evident compression on the domed washer(Fig.21b),suggesting an unfavourable performance.
5.2.2.Anti-friction washer
Fig.22 illustrates the curves of pretension against the torque applied on nut with different anti-friction washers.From the curves we found:
(1)The pretension increased linearly with the torque,regardless of the types of the anti-friction washers.
(2)Under the same value of torque,the bolt without anti-friction washer suffered the lowest pretension.The installation of antifriction washer appeared to increase the efficiency of the torque-to-pretension transition.
(3)In contrast to the condition without anti-friction washer,the 1010 polyamide washer can increase the pretension by 32.9%-49.6%,while 4.7%-28.9%for the high density polyethylene.It is advisable that the 1010 polyamide washer was better than the high density polyethylene washer.
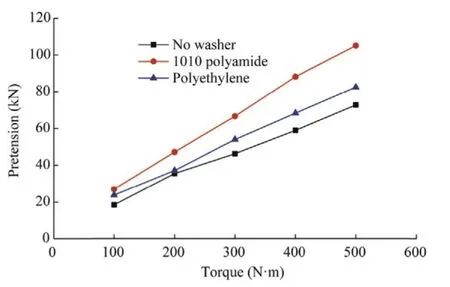
Fig.22.Relationship between torque and pretension during bolt installation.
6.Numerical simulation of plate and domed washer
Numerical analysis was conducted using software package ANSYSto investigate the stress state and the compatibility between plate and domed washer.
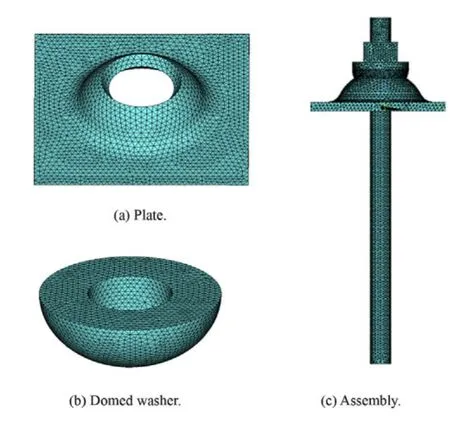
Fig.23.Numerical models of rock bolt components.
6.1.Numerical model
The simulated plate was arch-shaped with a size of 150 mm×150 mm×10 mm.The simulated domed washer was hemispheric with external and internal radii of 25 mm and 15 mm,respectively.The simulated bolt was 200 mm in length and 22 mm in diameter,anchored with an M24 flange nut.The plate,domed washer,bolt and nut were discretized into 32,319,30,547 and43,064 tetrahedral Solid-95 elements.Fig.23 shows the numerical models.
The plate,domed washer,rebar and nut were considered to be non-linear materials following the bi-linear isotropic hardening BISO criterion.The Young’s modulus and Poisson’s ratio were 200 GPa and 0.26 for all the parts,respectively.The yield strength and the shear modulus after yield of the plate and domed washer were 235 MPa and 10 GPa,respectively.The yield strength of the domed washer was prescribed to be 285 MPa and 335 MPa separately for a parametric study.The yield strengths of the rebar and nut were 600 MPa and 500 MPa,respectively,and their shear modulus was 10 GPa.
The contact surfaces between the domed washer and the plate nest,and that between the domed washer and the nut were symmetrical,can slide but not be separated.The contact surface between the domed washer and the plate nest was simulated as follows:the plate was the target face represented by the Targe170 elements,the domed washer was the contact surface represented by the Contac174 elements,and the friction coefficient between the plate and domed washer was 0.3.The contact face between the nut and the domed washer was simulated as follows:the nut was the target surface represented by the Targe170 elements,the domed washer was the contact surface given by the Contac174 elements,and the friction coefficient between the nut and domed washer was 0.15.
The bottom surface of the plate was fixed in all directions and a pull-out load was applied to the bottom end of the bolt with magnitude gradually increasing from 0 kN to 300 kN.
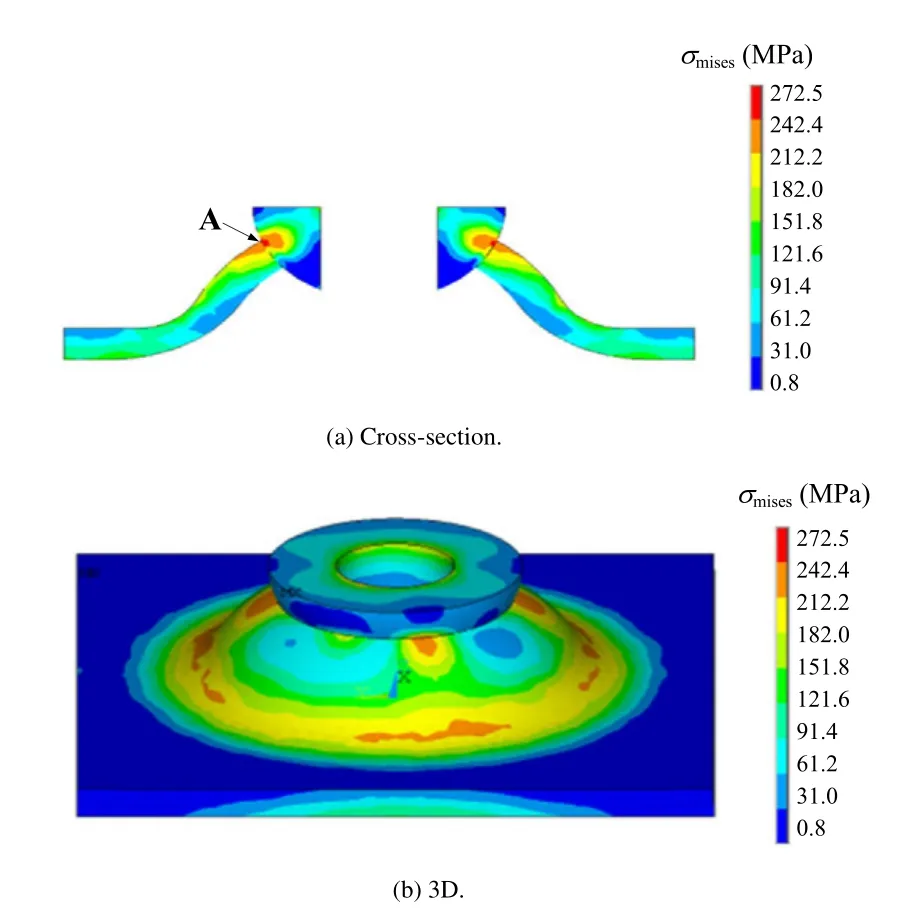
Fig.24.Simulated stress distribution in plate and domed washer.
6.2.Numerical results
Fig.24 shows the distribution of the von Mises stressesσmisesin the plate and domed washer when the pull-out load was 200 kN and the yield strength of the domed washer was 235 MPa.From
Fig.24 we can see that:
(1)Stress concentration occurred along the periphery of the contact surface between the domed washer and the plate.The maximum stress occurred at the upper contact surface between the domed washer and the plate nest.
(2)The simulated maximum magnitude of stress concentration in the domed washer was greater than its yield strength.The stress decreased with the distance away from the maximum stress concentration in both the tangential and radial directions.The stress in the radial direction followed a ring-like pattern and increased at the upper periphery of the internal hole of the domed washer.
(3)The concentrated stress at the upper boundary of the contact surface between the domed washer and the plate nest was greater than the yield stress of the plate.Furthermore,large stress concentration occurred on the transitional arc between the bearing arch and the bottom surface of the plate.In some areas,the induced stress was greater than the yield strength.The external surface of the bearing arch yielded higher stress than that at the internal surface,and the bottom surface of plate yielded higher stress than the top surface.
The stress distribution along the periphery of the contact surface between the domed washer and the plate had a significant influence on the compatibility and performance of the plate and the domed washer.Large plastic deformation resulted in suppression of rotation between them.Fig.25 shows the stress variations at the periphery of the contact surface between the domed washer and the plate as the pull-out load increased from 0 kN to 300 kN.The stress monitoring point(point A in
Fig.24a)was the outer intersection point of the domed washer and plate on the cross-section.
(4)As the pull-out load increased,the stress concentration along the periphery of the contact surface between the domed washer and the plate significantly increased until the pull-out load reached 50 kN.The domed washer started to yield and the stress increase rate decreased.The plate remained elastic and the maximum stress increased linearly.
(5)The strength of the domed washer had limited influence on the stress distribution in the plate nest.The maximum concentrated stress in the plate was 250 MPa for the three strength values of the domed washer,6.4%greater than the yield strength of the plate.
(6)The strength of the domed washer had a major influence on stress distribution in it.When the yield strength was 235 MPa,285 MPa and 335 MPa,the maximum concentrated stresses were 292 MPa,316 MPa,and 343 MPa,respectively,which were 24.3%,10.9%and 2.4%greater than the yield strength of the domed washers,respectively.As the strength of the domed washer increased,the ratio of the maximum concentrated stress to the yield strength decreased.When the yield strength of the domed washer was 285 MPa,the ratio of maximum concentrated stress to the yield strength of the domed washer was identical to that of the plate.It is therefore suggested that a domed washer with the yield strength of 285 MPa is equivalent to a plate with the yield strength of 235 MPa.In other words,the strength of domed washer is suggested to be 20%-30%higher than that of the plate.
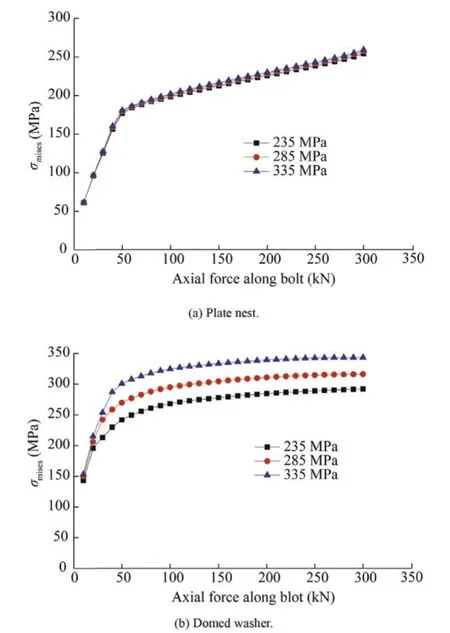
Fig.25.The maximum stress developed at the periphery of contact surfaces between the domed washer and the plate.
7.Case study
The newly developed high strength bolts have been used in several coal mining districts in China,including the Datong,Lu’an and Jincheng mining districts in Shanxi Province,the Xinwen mining district in Shandong Province,and the Yima mining district in Henan Province.A case study in a tailgate in the Tashan coal mine of the Datong mining district was presented in this context.
7.1.Geological conditions and initial support pattern of the tailgate
The coal seams Nos.3-5 in the Tashan coal mine were 14-20 m in thickness,averaging 16.8 m.The coal seam was soft and fractured with complex structures due to igneous rock intrusion.The maximum and minimum uniaxial compressive strengths(UCSs)of the coal seam were 17.9 MPa and 7.7 MPa,respectively,averaging 12.4 MPa.The immediate roof was the interbed of magmatic rock,carbon mudstone and silicified coal with the thickness of 2.6-6.4 m,averaging 4.5 m.The main roof consisted of siltstone, fine sandstone and pebbled coarse sandstone,with an average thickness of 22.9 m.The floor was kaolinitic mudstone with an average thickness of 4.9 m.In-situ stress measurements were carried out in the first mining district with hydraulic fracturing method.The maximum and minimum horizontal principal stresses were12.4 MPa and 8.2 MPa,respectively,and the vertical stress was 11.7 MPa.
The tailgate at the depth of 467 m was driven along the floor of the seam with extra thick top coal as its roof.The initial support pattern of the tailgate was of rock bolting in combination with cable bolts.The roof bolts were 2.4 m in length and 22 mm in diameter,with the yield strength of 335 MPa and the tensile strength of 490 MPa,and were partially anchored with resin capsules.The bolt plates were arch-shaped with side length of 100 mm and thickness of 8 mm.W-shaped straps and metal meshes were installed with the roof bolts for surface control.The cable bolts were 8.3 m in length and 17.8 mm in diameter with 1×7 strand structure,and they were installed with flat plates with side length of 300 mm and thickness of 10 mm.The long wall panel rib of the tailgate was supported by round steel bolts with the length of 1.8 m and the diameter of 18 mm.The other rib was supported by deformed steel bolts with the length of 2 m and the diameter of 22 mm.The row spacing and the spacing between two adjacent bolts in a same row were 0.9 m for both the roof and rib bolts.The row spacing of the cable bolts was 2.7 m and the spacing between two adjacent bolts in a same row was 1.6 m.
The tailgate was stable during the entry heading period.However,fractured bolts,severely deformed plates and torn straps were observed as the tailgate was affected by the mining-induced stress from the adjacent coal face,leading to obvious roof sag and local collapse,and severe side bulking and spalling.The reasons accounting for this scenario were considered to be the low bolt strength,poor compatibility between bolt components and low pretension during bolt installation.
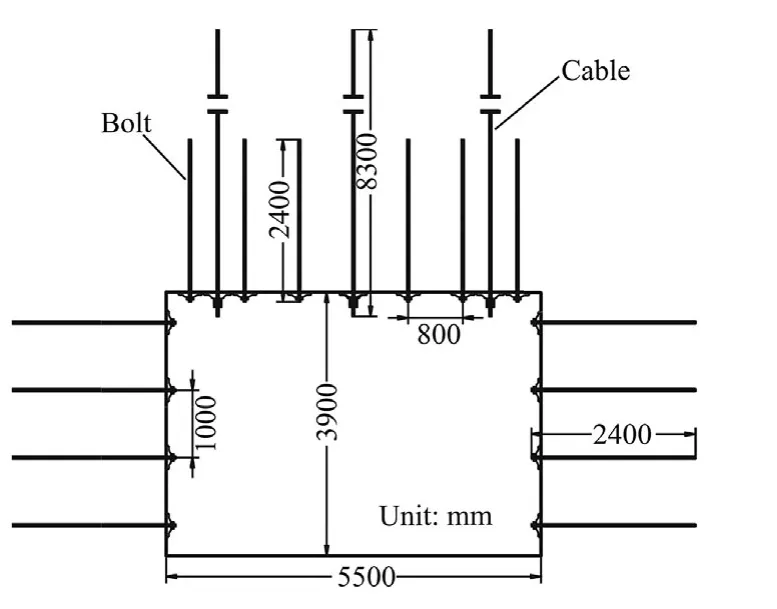
Fig.26.Layout of bolts and cables for the tailgate 5105 in the Tashan coal mine,Datong mining district.
7.2.New bolting pattern
To solve the problems related to bolt fracture and poor bolting performance,a new bolting pattern using the newly developed high strength bolts was proposed for another tailgate in the Tashan coal mine,the 5105 tailgate of the 8105 longwall panel.The tailgate was 5.5 m wide and 3.9 m high,with the depth of approximately 470 m,and was driven along the coal seam floor,leaving a top coal thickness of 10.1-16.1 m.
The roof bolts were made of the B600 rebar(see Table 2)with a diameter of 22 mm and a length of 2.4 m,and partially encapsulated with resin.High strength plates and domed washers(P-1 plate in Table 5 with the bearing capacity of 377.6 kN)were installed with the roof bolts.The 1010 polyamide washers were installed between the nut and domed washer to improve the efficiency of torque-to pretension transition.The torque applied on the nut was designed to be 400 N m,leading to a pretension on the bolt of approximately 60 kN.W-shaped straps and diamond metal meshes were installed for surface control.The row spacing of roof bolts was 0.8 m with 7 bolts per row.The cables were 8.3 m long,three cables per row with the row spacing of 1.6 m.The cables were made of the strand with 1×19 structure and had a diameter of 22 mm and a maximum tensile load of 560 kN.The cable plates were arch-shaped with domed washers,a side length of 300 mm,a thickness of 16 mm,a height of 58 mm,and a bearing capacity of greater than 830 kN.The cables were installed with the pretension of 200-250 kN.
The rib bolts were the same as the roof bolts.Large W-shaped plates with a length of 450 mm,a width of 280 mm and a thickness of 5 mm,and metal meshes were installed with rib bolts for surface settlement control.The row spacing of rib bolts was 0.8 m with 4 bolts per row in each rib.The layout of bolts and cables is shown in Fig.26.
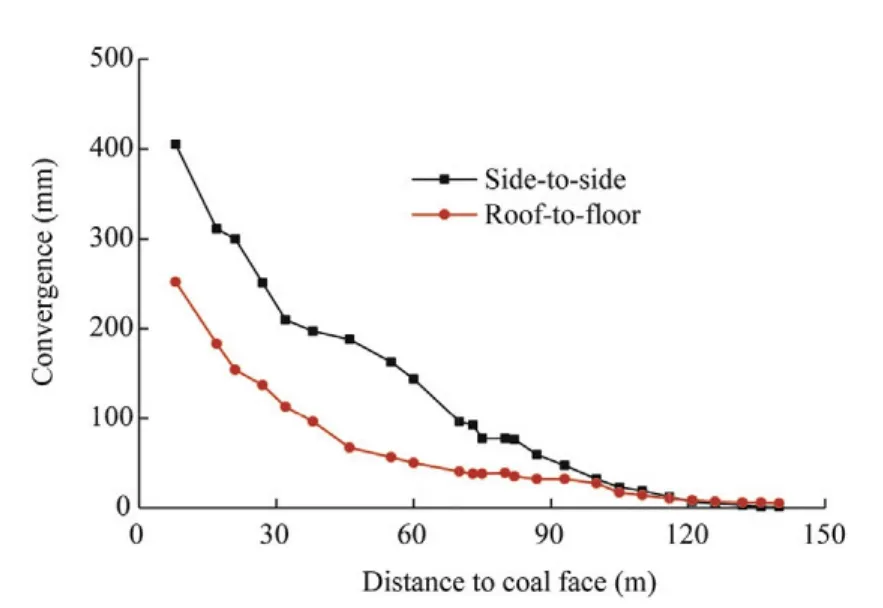
Fig.27.Tailgate convergence curves during coal face advancing.
7.3.Field monitoring
The tailgate convergence,roof separation,loads of bolts and cables were monitored during tailgate heading and coal panel extraction periods.
(1)During heading period,the tailgate convergence became stable when the heading face was 65 m away from the monitoring station,and the total roof-to- floor and side-to-side convergences were 22 mm and 19 mm,respectively.The total roof separation within 7 m into the roof was 7 mm,6 mm of which occurred in the bolted zone.The deformation of rock surrounding the tailgate was minor during the heading period.
(2)Fig.27 shows how the tailgate convergence increased as the longwall face approached the monitoring station.The convergence began to slowly increase when the distance between the monitoring station and the longall face was approximately 116 m.Noticeable increase in the tailgate convergence was observed when the distance was approximately 70 m.The tailgate convergence started to increase quickly when the distance was approximately 17 m.When the distance was 8 m,the roof-to- floor and side-to-side convergences were252 mm and 405 mm,respectively,accounting for 6.5%of the original tailgate height and 7.4%of the original width,respectively.
(3)The monitored loads on the bolts began to slowly increase when the distance between the monitoring station and the coal face was approximately 110 m.Sharp changes in the loads were observed when the distance was approximately 70 m.The peak value was roughly 250 kN when the distance was around 20 m.Beyond this,the loads on some bolts decreased as the longwall face approached the monitoring station.Most of the monitored bolts were effective,only few bolts were fractured.
The monitoring data demonstrated that the newly developed high strength bolts can successfully control severe deformations of the tailgate with large cross-section and thick coal roof,and the surrounding rocks were stable during the whole service period.
8.Conclusions
The mechanical performances of rock bolt components were thoroughly investigated through laboratory experiments and numerical analyses.The newly developed high strength bolts are successful in practical application in China’s coal mines.The main conclusions are drawn as follows:
(1)The high strength rebar has yield strengths of 513-608 MPa and tensile strengths of 710-780 MPa,which are 33.6%-58.3%and 17.2%-28.7%greater than those of the conventional rebar.The increase in yield strength is higher than that in tensile strength,leading to an increase in yield to tensile strength ratio and a decrease in elongation.The yield to tensile strength ratio is a key factor representing the deformability of rebar. The less the ratio, the higher the deformability.
(2)It is noted that the thread processing of bolts is rough and inaccurate,characterized by rough thread surface,nonidentical tooth height,toe stripping,and cracks in surface.It is desirable to reduce the defects and damage induced during thread processing to obtain high-quality thread.
(3)Approximately 70%of tested threads exhibited lower loadbearing capacity than the rebar.The hardening during thread processing increases the yield and tensile strengths of the thread.The increase in yield strength is greater than that in tensile strength,indicating an increase in yield to tensile strength ratio.The elongation of tested threads is less than that of the rebar.
(4)Typical deformation process of arch-shaped plate can be classified into five stages.The shape,size,material and washer have significant influences on the deformability and loadbearing capacity.Uneven bottom surface,low bearing arch and large transitional arc between the bearing arch and the bottom surface contribute to low load-bearing capacity.Appropriate shape and size of plate are of great importance to achieve high load-bearing capacity with a certain degree of deformability. For a plate with a size of 150 mm×150 mm×10 mm,the height of the plate is suggested to be no less than 34 mm.
(5)Stress concentrations were observed on the periphery of contact surfaces between the domed washer and the plate,and the maximum stress was greater than the yield strength of the plate and domed washer.This type of stress distribution has a major effect on the compatibility and performance of the plate and domed washer.Large plastic deformation of the domed washer can resist the rotation between them.The strength of domed washer is suggested to be 20%-30%higher than that of the plate.
(6)A case study carried out in a tailgate demonstrated that the newly developed high strength bolts can successfully control the severe deformations of the tailgate with large cross section and thick coal roof during the whole duration of service time.
Conflict of interest
The authors wish to confirm that there are no known conflicts of interest associated with this publication and there has been no significant financial support for this work that could have influenced its outcome.
Acknowledgements
This study was supported by the National Key Technology Support Program of China(Grant No.2012BAK04B06)and the National Natural Science Foundation of China (Grant No.U1261211).
Fan Mingjian.Relationship research of bolt pre-stress and supporting effect of roadway.MS Thesis.Beijing:China Coal Research Institute;2007(in Chinese).Gamboa E,Atrens A.Environmental influence on the stress corrosion cracking of rock bolts.Engineering Failure Analysis 2003;10(5):521-58.
Hou Chaojiong,Guo Lisheng,Gou Panfeng.Rock bolting techniques for coal roadways.Xuzhou:China University of Mining and Technology Press;1999(in Chinese).
Kang Hongpu,Wang Jinhua.Rock bolting theory and complete technology for coal roadways.Beijing:China Coal Industry Publishing House;2007(in Chinese).
Kang Hongpu,Lin Jian,Wu Yongzheng.Development of high pretensioned and intensive supporting system and its application in coal mine roadways.In:The 6th international conference on mining science and technology.Xuzhou;2009.p.479-85.
Kang Hongpu,Wu Yongzheng,Gao Fuqiang.Deformation characteristics and reinforcement technology for entry subjected to mining-induced stresses.Journal of Rock Mechanics and Geotechnical Engineering 2011;3(3):207-19.
Kang Hongpu,Wu Jianxing.Analysis on mechanical performance and supporting function of rock bolt plates.Journal of China Coal Society 2012;37(1):8-16(in Chinese).
Kang H,Wu Y,Gao F,Lin J,Jiang P.Fracture characteristics in rock bolts in underground coal mine roadways.International Journal of Rock Mechanics&Mining Sciences 2013;62:105-12.
Li CC.Field observations of rock bolts in high stress rock masses.Rock Mechanics and Rock Engineering 2010;43(4):491-6.
Li Guobiao.Experiments on effects of thread rolling accuracy on rock bolt pretension.Journal of China Coal Society 2012;36(11):1821-5(in Chinese).
Mark C,Molinda GM,Dolinar DR.Analysis of roof bolt systems.In:Proceeding of the 20th international conference on ground control in mining.Morgantown:West Virginia University;2001.p.218-25.
Peng SS,Tang DHY.Roof bolting in underground mining:a state-of-the-art review.International Journal of Mining Engineering 1984;2(1):1-42.
The Professional Standards Compilation Group of People’s Republic of China.Resin anchor bolts-steel bars and accessories(MT 146.2-2011).Beijing:China Coal Industry Publishing House;2011.
 Journal of Rock Mechanics and Geotechnical Engineering2015年1期
- Journal of Rock Mechanics and Geotechnical Engineering的其它文章
- Numerical estimates of the maximum sustainable pore pressure in anticline formations using the tensor based concept of pore
- Review of methods for predicting in situ volume change movement of expansive soil over time
- Rock engineering design of post-tensioned anchors for dams-A review
- Dynamic rock tests using split Hopkinson(Kolsky) bar system-A review
- Stability analysis of large-scale stope using stage subsequent flling mining method in Sijiaying iron mine
- Some modifcations to the process of discontinuous deformation analysis
