
Effects of thermodynamics parameters on mass transfer of volatile pollutants at air-water interface
2015-09-27 07:23LipingChenKiyunXunBinZhouGungDeng
Water Science and Engineering 2015年3期
Li-ping Chen*,Ki-yun XunBin ZhouGung-f Deng
aCollege of Urban Construction,Nanjing University of Technology,Nanjing 210009,PR China
bJiangsu Frontier Electric Technology Co.,Ltd.,Nanjing 211102,PR China
Received 20 March 2014;accepted 16 January 2015
Available online 14 August 2015
Effects of thermodynamics parameters on mass transfer of volatile pollutants at air-water interface
Li-ping Chena,*,Kai-yun Xuana,Bin Zhoua,Guang-fa Dengb
aCollege of Urban Construction,Nanjing University of Technology,Nanjing 210009,PR China
bJiangsu Frontier Electric Technology Co.,Ltd.,Nanjing 211102,PR China
Received 20 March 2014;accepted 16 January 2015
Available online 14 August 2015
Abstract
A transient three-dimensional coupling model based on the compressible volume of fluid(VOF)method was developed to simulate the transport of volatile pollutants at the air-water interface.VOF is a numerical technique for locating and tracking the free surface of water flow. The relationships between Henry's constant,thermodynamics parameters,and the enlarged topological index were proposed for nonstandard conditions.A series of experiments and numerical simulations were performed to study the transport of benzene and carbinol.The simulation results agreed with the experimental results.Temperature had no effect on mass transfer of pollutants with low transfer free energy and high Henry's constant.The temporal and spatial distribution of pollutants with high transfer free energy and low Henry's constant was affected by temperature.The total enthalpy and total transfer free energy increased significantly with temperature,with significant fluctuations at low temperatures.The total enthalpy and total transfer free energy increased steadily without fluctuation at high temperatures.
©2015 Hohai University.Production and hosting by Elsevier B.V.This is an open access article under the CC BY-NC-ND license(http:// creativecommons.org/licenses/by-nc-nd/4.0/).
Henry's constant;Mass transfer at interface;Thermodynamics parameters;Topological index;Volatile pollutants
1.Introduction
Accurately predicting the temporal and spatial distribution of volatile pollutants in water and air after leakage can provide an important insight for health evaluation of hydrosphere ecosystems.However,mass transfer of volatile pollutants at the air-water interface is a complex process and we do not yet have a deep and accurate understanding of its mechanisms and factors(J¨ahne and Haubecker,1998;Bade,2009;Wang et al.,2011).This affects the prediction results of the temporal and spatial distribution of volatile pollutants.Thus,it is necessary to reach a better understanding of mass transfer of volatile pollutants at the air-water interface.
In computational fluid dynamics,the volume of fluid(VOF)method is a numerical technique for locating and tracking the air-water interface(Larmaei and Mahdi,2010).A transient three-dimensional coupling transport model based on the compressive VOF method was used to simulate mass transfer at the air-water interface(Chen and Jiang,2010).Henry's constant is an important parameter in a coupling transport model for volatile pollutants.It relates not only to the thermodynamics parameters,such as the transfer free energy and the standard enthalpy,but also to the molecular structure of pollutants(Cheng et al.,2004;Amelia et al.,2011;Duran et al.,2010).Quantitative structure-activity/property relationships(QSAR/QSPR)represent an attempt to correlate activities or properties with structural descriptors of compounds. There are many methods for quantifying molecular structures,of which the topological index is the most popular since it can be obtained directly from molecular structures and rapidlycomputed for large numbers of molecules.The first reported use of a topological index in chemistry was by Wiener in his study of paraffin boiling points(Wiener,1947).Degeneracy and low discriminating power have been the two shortcomings of Wiener's index,resulting in ambiguity and uniqueness in its properties.This is one major reason that Wiener's index has not seen widespread use in the QSAR/QSPR community(Bajaj et al.,2004).The enlarged topological index of distance matrix W*has been defined to forecast Henry's constants of some alkylbenzene and alcohol compounds in standard conditions(Yang et al.,2004).At present,the relationship between Henry's constant and the molecular structure of pollutants in nonstandard conditions has not been established. Mathematical models have been developed to describe the relationships between Henry's constant,thermodynamics parameters,and W*in nonstandard conditions in this study.
Thermodynamics parameters such as the transfer free energy and the standard enthalpy have been used for volatilization study in recent years.The transfer free energy and the standard enthalpy are defined for per mole of pollutants and they are independent of time.However,mass transfer at the air-water interface in sudden water pollution relates to time. Thus,the transfer free energy and the standard enthalpy cannot be used as effective thermodynamic parameters in sudden water pollution.Total transfer free energy and total enthalpy were defined to analyze the changes of thermodynamics parameters with time at different temperatures.The total transfer free energy and total enthalpy for mass transfer at the air-water interface are discussed below.
2.Model development
2.1.Mathematical equations for transportation
The equations for compressive VOF are as follows(Chen and Jiang,2010):

where ρ and ρGare the densities of the fluid in the computational cell and air,respectively,in kg/m3;t is time,in s;the subscripts i and j are equal to 1,2,or 3,representing the three directions in the Cartesian coordinate system;u,uL,and uGare the velocities of the fluid in the computational cell,water,and air,respectively,in m/s;ηtis the turbulent dynamic viscosity,in m2/s,which can be calculated with the realizable k-ε model;f is the body force,in m/s2;p is the pressure,in Pa;and α is the water volumetric fraction of the computational cell.
The air-water coupling transport model for volatile pollutants is written as follows(Chen and Jiang,2010):

where C is the total concentration of pollutants in the computational cell,in kg/L;Hawis Henry's constant;and D and Eiare the turbulent mass diffusivities in air and water,respectively,in m2/s.
2.2.Henry's constant and thermodynamics parameters
The driving force of volatile pollutants'transportation is the difference in chemical potential related to activity coefficients. Mass transfer at the air-water interface is at instantaneous equilibrium.The equilibrium constant is called Henry's constant(Schwarzenbach et al.,2003):

where γaand γware the activity coefficients of volatile pollutants in air and water,respectively;Δ12G is the transfer free energy,in J/mol;R is the gas constant,which is 8.314 J/(mol·K);and T is the Kelvin temperature.
Taking the derivative of Eq.(5)with respect to temperature and using the Gibbs-Helmholtz equation(Lucia and Henley,2013)yield:

where Δ12H is the standard enthalpy,in J/mol.It is considered constant over a small temperature range.Henry's constant in nonstandard conditions is obtained from Eq.(6):

where H0is Henry's constant in standard conditions with T0=298 K.
Henry's constant relates not only to the thermodynamics parameters but also to the molecular structure of pollutants. There are many methods of quantifying the molecular structure,of which the topological index is the most popular since it can be obtained directly from molecular structures and rapidly computed for large numbers of molecules.The enlarged topological index of distance matrix W*was defined as W*=MSI,where M=(m1,m2,…,mn),S=(Skj)n×n,I=(I1,I2,…,In)T,mkis the number of bonded electrons,Ikis electronegativity,Skj=1/Rkj,and Rkjis the sum of the bond length from k to j.The linear relationships between lnH0and W*0.5of alkylbenzene,alcohol,aldehyde,and hydrocarbon are listed in Table 1(Yang et al.,2004).

Table 1Linear relationships between lnH0and W*0.5for different compounds.
Henry's constant in nonstandard conditions is written as follows:
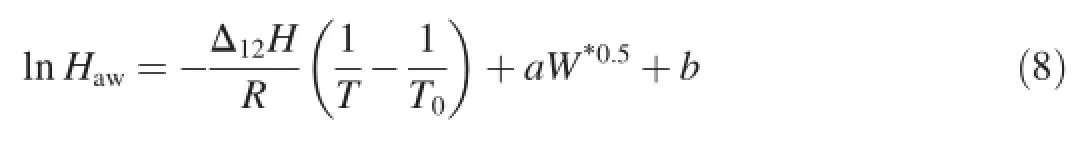
where a and b are coefficients.
Using Eq.(5)and Eq.(8)yields the equation for the transfer free energy:

2.3.Thermodynamics properties of benzene and carbinol
In orderto examinetheeffectofthermodynamics parameters on mass transfer at the air-water interface,benzene and carbinol were selected as pollutants.The enlarged topological indexes of the distance matrix W*of benzene and carbinol are 24.370 and 9.286,respectively.In standard conditions,the standard enthalpies Δ12H of benzene and carbinol are 30 kJ/mol and 45 kJ/mol,respectively(Schwarzenbach et al.,2003).Fig.1 shows the transfer free energy and Henry's constants of benzene and carbinol as functions of temperature.

Fig.1.Transfer free energy and Henry's constant as functions of temperature.
The transfer free energy Δ12G of benzene and carbinol decreases slightly with temperature.At the same temperature,the Δ12G of benzene is only 17.2%that of carbinol.The Henry's constant Hawof benzene rises significantly with temperature,while temperature has no effect on the Henry's constant of carbinol.
3.Experiments and numerical simulations
3.1.Experimental setup
A series of experiments and numerical simulations were performed in a straight flume with a rectangular shape.The experimental facility and the coordinate system are shown in Fig.2.The flume was 14.0 m long,0.4 m wide,and 0.4 m deep,and had a 3/700 bed slope(Chen et al.,2013).The water depth was 0.1 m.Flow was in the x direction,and the flume width was in the y direction.The z direction was upward and the bottom of the flume was at z=0.The origin of the coordinates was in the side wall of the flume.The average velocities of water and air were 0.2 m/s and 1.2 m/s,respectively. A pollutant solution of 50 mL with a concentration of 2 g/L was instantaneously released into the flume.The release point was at x=1.25 m,y=0.2 m,and z=0.1 m.Gas chromatography was used to measure the concentrations of benzene and carbinol in air.

Fig.2.Experimental facility.
3.2.Numerical methods
3.2.1.Computational zones and boundary conditions
ThecomputationalzonesshowninFig.3arecomposedofthe flumeandairzone.Therewasnopollutantattheinlet.Theflowat the outlet was fully developed.The widely accepted finite volume method(FVM)was applied during model formulation.The pressure-implicit with splitting of operators(PISO)procedure was used for pressure-velocity coupling in calculations(Issa,1986).The Crank-Nicholson method was used for temporal discretization.The second-order accurate smooth transition differencing scheme(STDS)was used to discretize the convection terms(Chen et al.,2013).The alternating direction implicit(ADI)and tridiagonal matrix algorithm(TDMA)methods were combined to solve the algebraic equations.The realizable k-ε model was used for turbulent flow calculation.The values of k and ε atinletsweregivenbyempiricalformulasand ε=k1.5/(0.42De),respectively,where uinis the velocity at the inlet and Deis the water depth.The flow parameters at the inlet are listed in Table 2.
3.2.2.Grid independence
The computational zone in the flume was 14 m×0.4 m×0.4 m.A computational zone in the air was 14 m×6.4 m×2.6 m.A grid system of 188 800 cells were used according to the results of grid independence study from Chen et al.(2013).

Fig.3.Computational zones.
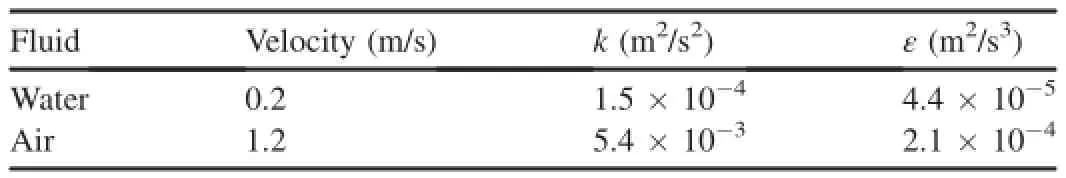
Table 2Parameters at inlet.
4.Results and discussion
4.1.Comparison of concentration
Fig.4showstheconcentrationofpollutantsalongtheflumeas functions of time at 298 K,where C0is the initial concentration of carbinol or benzene,with a value of 2 g/L.The area with higher concentration of carbinol in water is larger than that of benzene at the same time,and this phenomenon is more pronounced after 3 s.Thespace occupied by benzene in air islarger than that occupied by carbinol.The diffusion height of benzene in the air is higher than that of carbinol because benzene has a higher Haw.The C/C0contours of carbinol in air tend downstream.Itiseasyforcarbinoltobetransporteddownstreamatan airspeedof1.2m/sbecauseofthelowerdegreeofvolatilization. However,theairspeedhasalesserinfluenceonbenzenebecause there is so much benzene in the air.
Fig.5(a)shows the variation of C/C0with time at a point of x=1.75 m,y=0.20 m,and z=0.13 m,and at a temperature of 308 K.The C/C0of benzene reaches the peak and then drops quickly,whereas the C/C0of carbinol changes slowly with time.The C/C0of carbinol is lower than that of benzene at the start of release due to the higher Δ12G and lower Haw. Fig.5(a)means that volatilization of the pollutants with the higher Δ12G and lower Hawis weak near the release point. Fig.5(b)shows that the peak C/C0of benzene does not increase with temperature,although the Hawof benzene does. The peak C/C0of benzene at 318 K is lower than that at 308 K because the Δ12G of benzene decreases with temperature,and the benzene covering on the water surface restrains volatilization.However,the peak C/C0of carbinol increases slightly with temperature.
Fig.6(a)shows the variation of C/C0with time at a point of x=2.05 m,y=0.20 m,and z=0.13 m,and at a temperature of 308 K.This sampling point is far from the release site.The concentration difference between benzene and carbinol in Fig.6(a)is much lower than that in Fig.5(a).The reason is that much benzene in air has been transported with air flow. Fig.6(b)shows that the peak C/C0of carbinol at x=2.05 m,y=0.20 m,and z=0.13 m increases significantly withtemperature.The peak C/C0of carbinol is higher than that of benzene at 318 K.Fig.6(b)means that volatilization of the pollutants with the higher Δ12G and lower Hawcannot be ignored during later release period at higher temperatures.

Fig.4.Concentration distribution of pollutants along flume axis at 298 K.

Fig.5.Concentration distribution of pollutants at point of x=1.75 m,y=0.20 m,and z=0.13 m.

Fig.6.Concentration distribution of pollutants at point of x=2.05 m,y=0.20 m,and z=0.13 m.
4.2.Changes of total enthalpy and total transfer free energy at different temperatures
Mass transfer at the air-water interface relates to time in sudden leakage.However,Δ12H and Δ12G are independent of time.They cannot be used as parameters reflecting the thermodynamics variations during the process of mass transfer.
The total enthalpy Δ12HTis defined as the product of the amount of volatility and Δ12H.The total transfer free energy Δ12GTis defined as the product of the amount of volatility and Δ12G.Δ12HTand Δ12GTare thermodynamics parameters related to time.Though Δ12H is constant in the range of environmental temperature,Δ12HTchanges significantly with temperature.Fig.7 shows the variations of Δ12HTand Δ12GTwith time for carbinol at different temperatures.The change patterns of Δ12HTand Δ12GTare consistent with each other. Δ12HTand Δ12GTincrease linearly during the initial leakage at 0-3 s.Then,Δ12HTand Δ12GTincrease slowly with time at higher temperatures.Δ12HTand Δ12GTfluctuate significantly at 278 K and 288 K over 4-16 s.Pollutants absorbing Δ12G from the surroundings can be transferred from water to air.It is difficult for the pollutants to absorb energy from the surroundings at lower temperatures.Thus,the amount of volatility is low and the gaseous pollutants with lower chemical potential return to water easily,resulting in the significant fluctuations of Δ12HTand Δ12GTat lower temperatures.At higher temperatures,pollutants absorbing Δ12G have higher chemical potential.The gaseous pollutants with higher chemical potential are transported easily in air and cannotreturn to water.Thus,Δ12HTand Δ12GTincrease steadily without fluctuation at higher temperatures.

Fig.7.Variations of total enthalpy and total transfer free energy of carbinol with time.
5.Conclusions
(1)The compressive VOF method was used to develop a coupling transport model for volatile pollutants.Mathematical models were developed to describe the relationships between Henry's constant,thermodynamics parameters,and the enlarged topological index of distance matrix W*in nonstandard conditions.Henry's constant increases with W*and the transfer free energy decreases with W*.
(2)Experiments werecarried out ina flume,and benzene and carbinol were selected as pollutants.For benzene with low transfer free energy and high Henry's constant,the gaseous concentration isverylargeneartherelease siteatthestartofrelease. After a few seconds,benzene covering on the water surface restrainsvolatilizationduetothecouplingaction.Temperaturehas no effect on mass transfer at the air-water interface for benzene. For carbinol with high transfer free energy and a low Henry's constant,thegaseousconcentrationcannotrestrainvolatilization. The temporal and spatial distribution of carbinol is affected by temperature.
(3)The standard enthalpy is constant in the range of environmental temperature.The total enthalpy and total transfer free energy increase significantly with temperature. Their fluctuations are significant at low temperatures.However,they increase steadily without fluctuation at high temperatures.
References
Amelia,T.G.,Julia,M.V.,Antonio,M.R.,David,J.M.,2011.Physicochemical properties and digestibility of emulsified lipids in simulated intestinal fluids:Influence ofinterfacialcharacteristics.SoftMatter7(13),6167-6177.http://dx.doi.org/10.1039/C1SM05322A.
Bade,D.L.,2009.Gas exchange at the air-water interface.Encycl.Inland Waters 3,70-78.http://dx.doi.org/10.1016/B978-012370626-3.00213-1.
Bajaj,S.,Sambi,S.S.,Mada,A.K.,2004.Predicting anti-HIV activity of phenethylthiazolethiourea(PETT)analogs:Computational approach using Wiener's topochemical index.J.Mol.Struct.(Theochem)684(1-3),197-203.http://dx.doi.org/10.1016/j.theochem.2004.01.052.
Chen,L.P.,Jiang,J.C.,2010.Coupling diffusion simulation of volatile pollutant in the water and air.J.Civ.Archit.Environ.Eng.32(5),102-108.http://dx.doi.org/10.11835/j.issn.1674-4764.2010.05.019.
Chen,L.P.,Cheng,J.J.,Deng,G.F.,2013.Anisotropic diffusion of volatile pollutants at air-water interface.Water Sci.Eng.6(2),153-163.http:// dx.doi.org/10.3882/j.issn.1674-2370.2013.02.004.
Cheng,W.H.,Chou,M.S.,Perng,C.H.,Chu,F.S.,2004.Determining the equilibrium partitioning coefficients of volatile organic compounds at an air-water interface.Chemosphere 54(7),935-942.http://dx.doi.org/ 10.1016/j.chemosphere.2003.08.038.
Duran,T.R.,Camredon,M.,Valorso,R.,2010.Structure-activity relationships to estimate the effective Henry's law constants of organics of atmospheric interest.Atmos.Chem.Phys.10,7643-7654.http://dx.doi.org/10.5194/ acp-10-7643-2010.
Issa,R.I.,1986.Solution of the implicitly discretised fluid flow equations by operator-splitting.J.Comput.Phys.62,40-65.http://dx.doi.org/10.1016/ 0021-9991(86)90099-9.
J¨ahne,B.,Haubecker,H.,1998.Air-water gas exchange.Annu.Rev.Fluid Mech.30,443-468.http://dx.doi.org/10.1146/annurev.fluid.30.1.443.
Larmaei,M.M.,Mahdi,T.F.,2010.Simulation of shallow water waves using VOF method.J.Hydro-Environ.Res.3(4),208-214.http://dx.doi.org/ 10.1016/j.jher.2009.10.010.
Lucia,A.,Henley,H.,2013.Thermodynamic consistency of the multi-scale Gibbs-Helmholtz constrained equation of state.Chem.Eng.Res.Des. 91(9),1748-1759.http://dx.doi.org/10.1016/j.cherd.2013.03.009.
Schwarzenbach,R.P.,Gschwend,P.M.,Imboden,D.M.,2003.Environmental Organic Chemistry.John Wiley&Sons Inc.,Hoboken.
Wang,Y.T.,Hodas,N.O.,Jung,Y.,Marcus,R.A.,2011.Microscopic structure and dynamics of air/water interface by computer simulations-comparison with sum-frequency generation experiments.Phys.Chem.Chem.Phys. 13(12),5388-5393.http://dx.doi.org/10.1039/c0cp02745f.
Wiener,H.,1947.Structural determination of paraffin boiling points.J.Am. Chem.Soc.69(1),17-20.http://dx.doi.org/10.1021/ja01193a005.
Yang,F.,Wang,Z.D.,Huang,Y.P.,2004.Modification of the Wiener index 4.J.Comput.Chem.25(6),881-887.http://dx.doi.org/10.1002/ jcc.20016.
This work was supported by the National Natural Science Foundation of China(Grant No.51109106),the Natural Science Foundation of Jiangsu Province(Grant No.BK20130946),and the Qing Lan Project of Jiangsu Province.
*Corresponding author.
E-mail address:clpjoy@njtech.edu.cn(Li-ping Chen).
Peer review under responsibility of Hohai University.
http://dx.doi.org/10.1016/j.wse.2015.08.003
1674-2370/©2015 Hohai University.Production and hosting by Elsevier B.V.This is an open access article under the CC BY-NC-ND license(http:// creativecommons.org/licenses/by-nc-nd/4.0/).
 Water Science and Engineering2015年3期
- Water Science and Engineering的其它文章
- Uniqueness,scale,and resolution issues in groundwater model parameter identification
- Flash flood hazard mapping:A pilot case study in Xiapu River Basin,China
- Variable fuzzy assessment of water use efficiency and benefits in irrigation district
- Analysis of soluble chemical transfer from soil to surface runoff and incomplete mixing parameter identification
- Adsorption of Cr(VI)in wastewater using magnetic multi-wall carbon nanotubes
- Degradation of acephate using combined ultrasonic and ozonation method