
Flash flood hazard mapping:A pilot case study in Xiapu River Basin,China
2015-09-27 07:23weiZhngJinQunHongbinZhngFnWngHongWngXioynHe
Water Science and Engineering 2015年3期
D-wei Zhng*,Jin Qun,Hong-bin ZhngFn WngHong WngXio-yn He,b
aChina Institute of Water Resources and Hydropower Research,Beijing 100038,PR China
bResearch Center on Flood and Drought Disaster Reduction,Ministry of Water Resources,Beijing 100038,PR China
Received 10 October 2014;accepted 6 May 2015
Available online 13 August 2015
Flash flood hazard mapping:A pilot case study in Xiapu River Basin,China
Da-wei Zhanga,b,*,Jin Quana,Hong-bin Zhanga,b,Fan Wanga,b,Hong Wanga,b,Xiao-yan Hea,b
aChina Institute of Water Resources and Hydropower Research,Beijing 100038,PR China
bResearch Center on Flood and Drought Disaster Reduction,Ministry of Water Resources,Beijing 100038,PR China
Received 10 October 2014;accepted 6 May 2015
Available online 13 August 2015
Abstract
Flash flood hazard mapping is a supporting component of non-structural measures for flash flood prevention.Pilot case studies are necessary to develop more practicable methods for the technical support systems of flash flood hazard mapping.In this study,the headwater catchment of the Xiapu River Basin in central China was selected as a pilot study area for flash flood hazard mapping.A conceptual distributed hydrological model was developed for flood calculation based on the framework of the Xinanjiang model,which is widely used in humid and semi-humid regions in China.The developed model employs the geomorphological unit hydrograph method,which is extremely valuable when simulating the overland flow process in ungauged catchments,as compared with the original Xinanjiang model.The model was tested in the pilot study area,and the results agree with the measured data on the whole.After calibration and validation,the model is shown to be a useful tool for flash flood calculation.A practicable method for flash flood hazard mapping using the calculated peak discharge and digital elevation model data was presented,and three levels of flood hazards were classified.The resulting flash flood hazard maps indicate that the method successfully predicts the spatial distribution of flash flood hazards,and it can meet the current requirements in China.
©2015 Hohai University.Production and hosting by Elsevier B.V.This is an open access article under the CC BY-NC-ND license(http:// creativecommons.org/licenses/by-nc-nd/4.0/).
Flash flood hazard mapping;Conceptual distributed hydrological model;Xinanjiang model;Geomorphological unit hydrograph;Xiapu River Basin
1.Introduction
Flashfloodscausedbyheavyrainstormsarecharacterizedby a rapid water level rise in streams or creeks,which often have small-size catchments with relatively steep slopes.Due to their high intensity and sudden onset,flash floods usually cause serious local disasters and,thus,flash flood prevention is a significant challenge for many countries.In China,mountainous and hilly areas account for almost two thirds of the nation's land cover,and flash floods have become a major cause of natural disaster-induced casualties.Moreover,flash flood disasters are occurring in China at an increasing rate,severely restricting socioeconomic development in mountainous and hilly areas.In order to improve flash flood prevention,the Chinese government has invested a large amount of money since 2010 innon-structural measuresfor flash flood prevention(Sun et al.,2012).Flash flood hazard mapping,as a supporting component of these measures,is a fundamental tool that can be used to guide local planning,flood risk assessment,and emergency planning.Research on flash flood hazard mapping began later in China than in some developed countries.Flood hazard mappinghasbeendevelopinginChinasincethe1980s,butflash flood hazard mapping has not been performed until recently.In order to explore practical methods for flash flood hazard mapping,some pilot studies have been initiated in China.
Flash flood calculation is an essential component of flash flood hazard mapping.However,the formation of flash floods is complicated.Flash floods also often occur in ungauged catchments,posing an even greater challenge to flash flood simulations.Many scholars have conducted studies on flash floodsimulations.For example,Roux et al.(2011)developed a spatiallydistributedhydrologicalmodelonthebasisofphysical process representation;Estupina-Borrell et al.(2006)proposed thephysicallybased,space-timedistributedhydrologicalmodel MARINE(model of anticipation of runoff and inundations for extreme events);and the geomorphological instantaneous unit hydrograph(GIUH)has been derived from the geomorphological characteristics of a catchment and used in simulation of the surface runoff hydrographs for ten rainfall events in the Ajay Catchment in eastern India(Kumar et al.,2007).Growing knowledge of flash flood mechanisms shows that the morphometric variables of a catchment control its hydrological response(Angillieri,2008;Moussa,2003).Based on this understanding,the geomorphological unit hydrograph(GUH)has become one of the most popular methods for estimating hydrological processes when data are inadequate(Diakakis,2011;Du et al.,2009).This method is based on the quantitative relationship between catchment geomorphology(e.g.,the catchment area and shape,topography,and stream density)and hydrological processes(Khaleghi et al.,2014;Nourani et al.,2009).It has the advantage of requiring a limited number of parameters,and geomorphological data can be obtained from topographic maps or digital elevation models(DEMs)(Ros and Borga,1997;Yao et al.,2014).With the development of GIS technology,thecalculationofbasingeometricparametersbased on data from DEMs has become easier.Therefore,in order to develop a new hydrological model suitable for ungauged catchments,the GUH method based on DEMs was used to estimate outlet runoff hydrographs for each sub-catchment(Kong and Wang,2009).The Xinanjiang model developed by Zhao(1984)is a conceptual rainfall-runoff model and is one of the most widely used models in humid or semi-humid basins in China(Liu et al.,2009).Therefore,it is feasible to develop a more effective model based on the existing Xinanjiang model and the GUH method for simulating flash floods occurring in mountainous and hilly areas.
Extensive flash flood estimation studies have been carried out due to the importance of flash flood hazard mapping in catchment management.Dawod et al.(2011)utilized the curve number(CN)method to model flash floods for ungauged arid catchments and then integrated the results with topographic,metrological,geological,and land use datasets in order to quantify and spatially map the flood characteristics;Bajabaa et al.(2014)produced a flash flood hazard map by combining GIS techniques and physiographic features of the study area;Fernandez-Lavadoetal.(2007)derivedfloodhazardmapsfrom a comprehensive geomorphological map,and classified flood hazards into three levels(very high,high,and moderate).In China,the main purpose of flash flood hazard mapping is currently to aid in community emergency planning,and flash flood hazard mapping is still at an early stage(Li et al.,2013).
A pilot case study was performed of the headwater catchment of the Xiapu River Basin,located in central China.For flash flood simulation,a new conceptual distributed hydrological model using GUHs was developed based on the framework of the Xinanjiang model.A method for depicting the flash flood hazard map was also introduced.
2.Study area
The headwater catchment of the Xiapu River Basin,shown in Fig.1,covers an area of 112.5 km2in Xianning City,southeast Hubei Province,in central China.This catchment ranges from 29°19′25′′N to 29°25′41′′N and 114°18′35′′E to 114°28′38′′E,and can be characterized as a hilly area with an average slope of 0.58 and elevations in the range of 157.6 to 1304.4 m.
The study area is located in a subtropical monsoon climate zone with abundant rainfall(the annual rainfall is 1 630 mm)and a mild climate(the average temperature is 16.3°C).In the flood season from April to September,intense rainfall over a short duration usually causes flash floods,and the steep topography results in quick drainage.The floods,which can cause severe local damage,are characterized by large flow rates and high transport ratios of alluvial deposits.

Fig.1.Study area.
There are four land use types within the catchment:arable land,forest,mining,and residential building,of which forest accounts for the largest proportion.There are four smallhydropower stations in the catchment:Zhanghekou,Lengshuiping,Dachayuan,and Egongjing,as shown in Fig.1.The first three are diversion stations,with weirs that are only about 1 m above the river bottom.Therefore,in this study,the effects of the first three hydropower stations on flash floods were neglected.However,the Egongjing Hydropower Station has a small reservoir with a storage capacity of 984 000 m3and a drainage area of 45 km2;the regulatory function of the reservoir had to be considered.The spillway is an open-type practical weir,23.45 m high and 23.60 m wide,and the weir flow formula was used to calculate the reservoir discharge.
The main topographic data were in a DEM format with 25 m×25 m resolution.Eight typical channel cross-sections along the main stream were measured with GPS equipment for the simulation of flood propagation along the channel.Within the study area,there are three rainfall stations:Sanbao,Linshang,and Huangjin.The Dawuchang Hydrological Station is located at the catchment outlet;its discharge data were used for model validation.
3.Hydrological method for flash flood simulation
3.1.Framework of hydrological model
In this study,a new conceptual distributed hydrological model was developed based on the framework of the Xinanjiang model developed by Zhao(1984).The existing Xinanjiang model is usually operated at two time scales:daily continuous simulation and hourly simulation of flood events. This pilot case study used hourly simulations.In order to consider the spatial variations of the hydrological processes,the study catchment was divided into 10 sub-catchments.For each sub-catchment,the outflow was calculated with four major modules:the evapotranspiration module,runoff generation module,runoff separation module,and runoff routing module.The first three modules are from the existing Xinanjiang model.The actual evapotranspiration was computed from potential evapotranspiration.The soil water storage deficit was calculated in three layers,the upper,lower,and deep soil layers,based on the tension water capacity distribution curve.The runoff was generated by rainfall.The total runoff was then subdivided into three components,surface runoff,subsurface runoff,and underground runoff,based on the free water capacity distribution curve.In the runoff routing module,the surface runoff was routed toward the outlet of each sub-catchment by means of the GUH method.For the sake of simplicity,the subsurface and underground runoffs were routed using the simple linear reservoir method.Then,the outflow from each sub-catchment was routed along the channels toward the main catchment outlet using the Muskingum method.
3.2.GUH method
When using the GUH method,the most important step is to calculate the time of concentration at each point in the catchment.To obtain the travel time,the average flow velocity should be estimated.Theoretically,the surface flow is driven mainly by gravity,and there is a close relationship between the flow velocity and the average slope of the catchment.Generally,the velocity of overland flow can be estimated using the following equation(Li,2005):

where V is the velocity of overland flow,KOis the velocity coefficient,and I is the average slope of the catchment.The value of KOshould be determined by calibration with actual hydrological data.When there are insufficient hydrological data,it can be estimated based on the geomorphological features of the mountainous area.
Each point in the catchment has its own flow path toward the outlet.Based on DEM data and GIS technology,water flows into the adjacent grid cell with the maximum gradient according to the D8 algorithm,from which the flow path from each point toward the outlet can be easily determined. Fig.2(a)shows the assumed bed elevations for each grid cell,and the corresponding flow directions are shown in Fig.2(b).
The concentration time of water in each grid cell can be obtained according to the flow path and the average velocity(Fig.3(a)).Assuming that the time step of a unit hydrograph is dt,then,by counting the number of grid cells with water flowing toward the outlet of a catchment in each time step dt,the cumulative drainage area S*(t)at time t can be calculated,and the relative drainage area increment u(t)at time t,which is the ratio of the increment of the cumulative drainage area during dt to the total area of the catchment,can also be obtained as follows(Fig.3(b)):
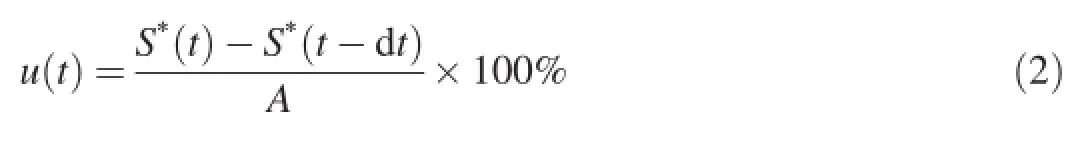
where A is the area of the catchment.According to the timearea curve method(Muzik,1996),with S(t)=S*(t)/A,the S-hydrograph can be obtained(Fig.3(c)).The unit hydrograph can be calculated(Fig.3(d))as follows:where q(t)is the flow discharge at the catchment outlet induced by a certain amount of precipitation i for a time step dt at time t,and i is defined as the unit precipitation in this study.
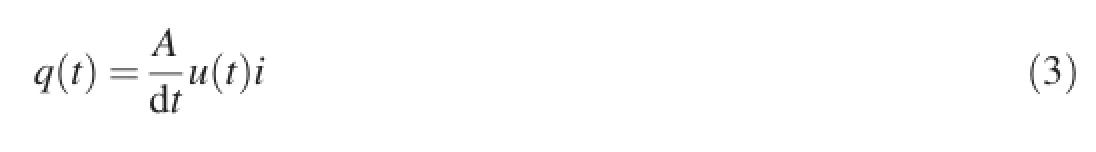

Fig.2.Flow directions defined by D8 algorithm.

Fig.3.GUH method based on DEM.
3.3.Simulation of flood propagation
In the proposed hydrological model,the Muskingum method is used to simulate the flood propagation in channels. In the Muskingum method,two parameters,the lag time K and weighting factor X,need to be calibrated using the measured flood data.However,hydrological data from a small catchment in mountainous and hilly areas can be relatively scarce.Thus,the traditional methods are not applicable for obtaining K and X.In this study,the reference flow rate and sectional geometry were used to determine the parameters K and X for each flood process.Detailed information about this method can be found in Kong and Wang(2008).
Fig.4 shows how the discharge of each sub-catchment propagates to the outlet of the whole catchment.In the proposed hydrological model,the outflow of each sub-catchment,defined as Q1c,Q2c,and Q3c,respectively,can be calculated simultaneously.Then,Q1cand Q2care added together and considered the input flood process of the channel(QI).After QIis routed to the outlet of the catchment,the corresponding output flood process Qocan be obtained.Adding Q3cand Qotogether,the total flood process of the catchment at the outlet can be obtained.
4.Calibration of hydrological model
The catchment was divided into 10 sub-catchments with areas ranging from 0.58 to 29.7 km2,as shown in Fig.5.
The GUH of each sub-catchment was calculated based on the DEM data,with a time step of one hour and a unit precipitation of 1 mm.The new conceptual distributed hydrological model was calibrated using 10 historical flash flood events from 1994 to 2010,provided by the Hydrology Bureau of Xianning City.The arithmetic mean method was used to estimate the precipitation for each sub-catchment due to the relatively small catchment area and a certain amount of rainfall stations.The calibrated parameter values are listed in Table 1 and the GUHs for 10 sub-catchments are shown in Fig.6.

Fig.4.Sketch of sub-catchment.

Fig.5.Sub-catchments of study area.
The simulated flash flood hydrographs at the Dawuchang Hydrological Station are shown in Fig.7,where Q is the flood discharge at the Dawuchang Hydrological Station,and P is the hourly precipitation in the catchment.The simulated results of different flood events are shown in Table 2.It is clear that,in general,the simulated results agree with the observed data. The absolute value of the maximum relative error of the peak discharge is 12.00%;the time discrepancies(tD)between peakdischarges of observed and simulated results are very small,except in two flash flood events(floods no.940626 and 050626);and the values of the Nash-Sutcliffe efficiency(NSE)coefficients for all the flood events are greater than 0.62,which means they are acceptable.The low values of NSE for some flood events may result from the lack of related data from four hydropower stations.Generally,the new hydrological model performs well and can be utilized in flash flood analysis.

Table 1Calibrated parameter values of hydrological model.
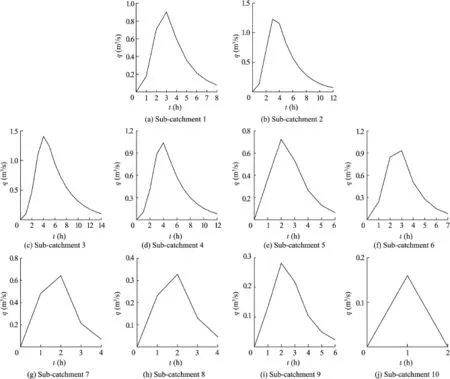
Fig.6.GUHs of each sub-catchment.

Fig.7.Observed and simulated flash flood hydrographs at Dawuchang Hydrological Station.

Table 2Simulated results of different flood events at Dawuchang Hydrological Station.
5.Flash flood hazard mapping
Flash flood hazard analysis provides an estimation of the extent and intensity of design flash flood scenarios.Disasters caused by flash floods usually occur in villages and towns situated along channels.Lengshuiping Village,located in subcatchment 7,was selected as the object of flash flood hazard mapping because of its relatively large scale.The upstream and downstream control sections were Zhanghekou and Chetou,respectively,as shown in Fig.5.The procedure for flash flood hazard mapping is as follows:
(1)Estimation ofthe design stormswith different return periods(2,5,10,20,50,and 100 years):In the study catchment,the rainfall data series could not satisfy the frequency calculation requirements and,thus,six-hour design storms with different return periods were estimated based on the data from HPDWR(2008),as shown in Table 3.
(2)Calculation of design flash flood process using the calibrated hydrological model:For the sake of simplicity,only the simulated results of the design flash floods with 2-and 100-year return periods are presented in Fig.8.The peak discharges are 143 and 318 m3/s,respectively,for 2-and 100-year return periods in the Zhanghekou section,the values are 149 and 332 m3/s,respectively,in the Chetou section.
(3)Estimation of inundated areas using the maximum water level and DEM data:After the design flood hydrographs are derived,the peak discharge can be converted into the corresponding maximum water level.Generally,two methods can be used:a method based on the relationship between the discharge and water level of the specific section,and the Manning equation.In this study,the Manning equation was used to calculate the maximum water level based on the peakdischarge,providing an estimation of the inundated areas when the DEM data were available.

Table 3Rainfall distribution of six-hour design storms with different return periods.
Lengshuiping Village was selected as an example to illustrate the process in detail(Fig.9).Initially,19 additional sections were inserted between the Zhanghekou and Chetou sections,the shapes of which were estimated by interpolation of the DEM data.Based on the distance from the Zhanghekou to Chetou sections,peak discharges at the 19 sections were calculated and the corresponding maximum water levels could also be obtained using the Manning equation. The Zhanghekou,Chetou,and the additional 19 sections formed 20 regions,and the water levels of the grid cells in each region were calculated using the upstream and downstream maximum water levels.The water level minus the bottom elevation provided the water depth of each grid cell. Once the water depths of all grid cells were calculated,the inundated areas and water depth distribution could be obtained.

Fig.8.Simulated results of flash flood processes for Zhanghekou and Chetou sections.
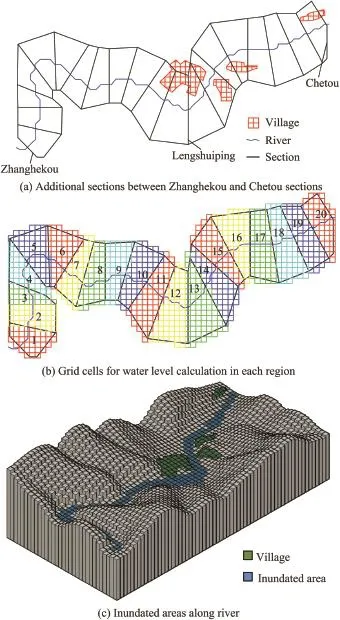
Fig.9.Sketch of inundated area calculation.
(4)Classification of flash flood hazards according to the water depth and flow velocity:In this study,the water depth, rather than the product of the water depth and flow velocity,was used for the hazard classification,even though the flow velocity is an important component of flash floods.The reason is that only the flow velocities in the sections were calculated,and the two-dimensional in-plane flow velocities could not be obtained with the simple hydraulic method used in this study. The levels of flash flood hazards were classified as moderate for a water depth lower than 0.5 m,high for a water depth from 0.5 to 3.0 m,and very high for a water depth greater than 3.0 m.
(5)Flash flood hazard mapping:The base map was prepared by integrating topographical,drainage,and administrative maps.Then,the main information obtained from flash flood simulation and analysis,e.g.,the inundated areas,water depth distribution,and flash flood hazard level,was added to the base map.Additional information,such as flash flood scenario instructions,calculation conditions,and mapping units and dates,can be then added.It is worth noting that the emergency evacuation route is also very important information,because the main purpose of flash flood hazard mapping in China is the prevention of flash flood hazards.Finally,mapspecific information,such as the legend,scale,and compass,should be added.
Fig.10 shows the flash flood hazard maps for Lengshuiping Village during design storms with 2-and 100-year return periods.Although the discharges have significant differences,there is little difference between the inundated areas in the two scenarios because of the high velocity of flash floods.Moreover,the study area is located in the upper reach of the Xiapu River Basin,where the slopes are very steep.Thus,there is no significant difference in the in-plane water surface under different discharges.
Table 4 shows a comparison of the maximum water levels Zmaxand peak discharges Qmaxof flash floods with 2-and 100-year return periods in the Zhanghekou and Chetou sections. Fig.11 shows the water level variation in the Zhanghekou and Chetou sections.The difference in the maximum water levels between the two design flash floods with 2-and 100-year return periods in the Zhanghekou section is 0.56 m,and the inplane water surface extent is only 0.96 m.This is considerably smaller than the DEM resolution of 25 m.The highest water level difference is 0.78 m in the Chetou section,and the water surface extent is 6.35 m,which is also smaller than the DEM resolution.
It is worth mentioning that the resolution of the DEM data has an influence on the hazard map.In Fig.11,inundated areasexhibit jagged outlines because the DEM resolution(25 m)is quite coarse.
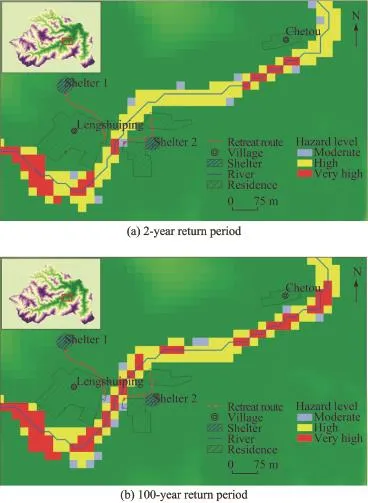
Fig.10.Flash flood hazard maps for Lengshuiping Village.

Table 4Maximum water levels and peak discharges of flash floods with 2-and 100-year return periods in Zhanghekou and Chetou sections.

Fig.11.Water level variation in Zhanghekou and Chetou sections(units:m).
6.Conclusions and suggestions
This study has developed a new conceptual distributed hydrological model for the simulation of flash floods,and the novelty of the new hydrological model is the use of GUHs to model the surface runoff.GUHs are suitable for catchments with limited observed rainfall and runoff data,because they are computed based on catchment hydraulics and geomorphological data.The model was calibrated and validated through testing of its capabilities in dealing with flash floods. The results show that the proposed hydrological model performs well in the simulation of flash floods,which means it can be a useful tool for the calculation of flash flood hydrographs.Lengshuiping Village was selected as the research site for flash flood hazard mapping.The peak discharges of design flash floods with different return periods in the Zhanghekou and Chetou sections were calculated using the design rainfall as the input data for the hydrological model.A simple method that uses GIS technology is presented to provide water depths of each grid cell using the peak discharge and DEM data. Three hazard levels were designated based on the water depth,and the resulting flash flood hazard map shows the hazard distribution.Overall,these methods of flash flood simulation and flash flood hazard mapping have been shown to be feasible.
Some aspects of flash flood hazard mapping need to be noted:(1)There are many hydropower stations in the mountainous and hilly catchments in China,especially in southern areas,which cannot be considered effectively by this hydrological model.Therefore,research on hydrological models considering the effects of hydropower stations should be performed in the future.(2)The typical resolution of DEMs in China is about 25-30 m,which is relatively coarse for flash flood hazard mapping.In order to avoid the creation of jagged inundated areas in flash flood hazard mapping,high-resolution DEM data are necessary.(3)The velocity of flash floods is usually very high.Therefore,the product of water depth and flow velocity,rather than the water depth,should be used as the indicator for hazard level classification.However,the flow velocity was not obtained for each grid cell in this study because of the adoption of a simple hydraulic method;this approach should be improved in future work.(4)Relatively simple calculation methods and coarse topographical data limit the accuracy of flash flood hazard mapping.With the development of computation technology,the hydrodynamic model can be used to model flash floods to provide more detailed information.In the meantime,with the rapid development of LiDAR and sonar measurement technology,it is becoming easier and more practical to obtain high-resolution DEM data,which can be used to develop more accurate flash flood hazard maps.
References
Angillieri,M.Y.E.,2008.Morphometric analysis of Colanguil River Basin and flash flood hazard,San Juan,Argentina.Environ.Geol.55(1),107-111. http://dx.doi.org/10.1007/s00254-007-0969-2.
Bajabaa,S.,Masoud,M.,Ai-Amri,N.,2014.Flash flood hazard mapping based on quantitative hydrology,geomorphology and GIS techniques(case study of Wadi AI Lith,Saudi Arabia).Arabian J.Geosci.7(6),2469-2481. http://dx.doi.org/10.1007/s2517-013-0941-2.
Dawod,G.M.,Mirza,M.N.,Ai-Ghamdi,K.A.,2011.Gis-based spatial mapping of flash flood hazard in Makkah City,Saudi Arabia.J.Geogr.Inf. Syst.3(3),225-231.http://dx.doi.org/10.4236/jgis.2011.33019.
Diakakis,M.,2011.A method for flood hazard mapping based on basin morphometry:Application in two catchments in Greece.Nat.Hazards 56(3),803-814.http://dx.doi.org/10.1007/s11069-010-9592-8.
Du,J.K.,Xi,H.,Hu,Y.J.,Xu,Y.P.,Xu,C.Y.,2009.Development and testing of a new storm runoff routing approach based on time variant spatially distributed travel time method.J.Hydrol.369(1-2),44-54.http:// dx.doi.org/10.1016/j.jhydrol.2009.02.033.
Estupina-Borrell,V.,Dartus,D.,Ababou,R.,2006.Flash flood modeling with the MARINE hydrological distributed model.Hydrology Earth Syst.Sci. Discuss.3(6),3397-3438.http://dx.doi.org/10.5194/hessd-3-3397-2006.
Fernandez-Lavado,C.,Furdada,G.,Marques,M.A.,2007.Geomorphological method in the elaboration of hazard maps for flash-floods in the municipality of Jucuaran(EI Salvador).Nat.Hazards Earth Syst.Sci.7(4),455-465.http://dx.doi.org/10.5194/nhess-7-455-2007.
Hubei Provincial Department of Water Resources(HPDWR),2008.Stormy Statistic Parameters Atlas of Hubei Province.HPDWR,Wuhan(in Chinese).
Khaleghi,M.R.,Ghodusi,J.,Ahmadi,H.,2014.Regional analysis using the geomorphologic instantaneous unit hydrograph(GIUH)method.Soil Water Resour.9(1),25-30.
Kong,F.Z.,Wang,X.Z.,2008.Method estimating Muskingum model parameters based on physical characteristics of a river reach.J.China Univ. Min.Technol.37,494-497(in Chinese).
Kong,F.Z.,Wang,X.Z.,2009.A semi-distributed hydrological model based on DEM.Eng.J.Wuhan Univ.42(5),596-600(in Chinese).
Kumar,R.,Chatterjee,C.,Singh,R.D.,Lohani,A.K.,Kumar,S.,2007.Runoff estimation for an ungauged catchment using geomorphologicalinstantaneous unit hydrograph(GIUH)models.Hydrol.Process.21(14),1829-1840.http://dx.doi.org/10.1002/hyp.6318.
Li,C.Z.,Wang,F.,Huang,J.C.,He,X.Y.,2013.Flash flood risk analysis at Matoupu Town.In:Proceedings of 2013 IAHR World Congress.Chengdu.
Li,G.D.,2005.Hydrology.Wu-Nan Book Company Ltd.,Taibei(in Chinese).
Liu,J.T.,Chen,X.,Zhang,J.B.,Flury,M.,2009.Coupling the Xinanjiang model to a kinematic flow model based on digital drainage networks for flood forecasting.Hydrol.Process.23(9),1337-1348.http://dx.doi.org/ 10.1002/hyp.7255.
Moussa,R.,2003.On morphometric properties of basins,scale effects and hydrological response.Hydrol.Process.17(1),33-58.http://dx.doi.org/ 10.1002/hyp.1114.
Muzik,I.,1996.Flood modelling with GIS-derived distributed unit hydrographs.Hydrol.Process.10(10),1401-1409.http:dx.doi.org/10.1002/(SICI)1099-1085(199610)10:10<1401::AID-HYP469>3.0.CO;2-3.
Nourani,V.,Singh,V.P.,Delafrouz,H.,2009.Three geomorphological rainfall-runoff models based on the linear reservoir concept.Catena 76(3),206-214.http://dx.doi.org/10.1016/j.catena.2008.11.008.
Ros,D.D.,Borga,M.,1997.Use of digital elevation model data for the derivation of the geomorphological instantaneous unit hydrograph.Hydrol. Process.11(1),13-33.http:dx.doi.org/10.1002/(SICI)1099-1085(199701)11:1<13::AID-HYP400>3.0.CO;2-M.
Roux,H.,Labat,D.,Garambois,P.A.,Maubourguet,M.M.,Chorda,J.,Dartus,D.,2011.A physically-based parsimonious hydrological model for flash floods in Mediterranean catchments.Nat.Hazards Earth Syst.Sci. 11(9),2567-2582.http://dx.doi.org/10.5194/nhess-11-2567-2011.
Sun,D.Y.,Zhang,D.W.,Cheng,X.T.,2012.Framework of national nonstructural measures for flash flood disaster prevention in China.Water 4(1),272-282.http://dx.doi.org/10.3390/w4010272.
Yao,C.,Zhang,K.,Yu,Z.B.,Li,Z.J.,Li,Q.L.,2014.Improving the flood predictioncapabilityoftheXinanjiangmodelinungaugednestedcatchmentsby coupling it with the geomorphologic instantaneous unit hydrograph.J.Hydrology 517,1035-1048.http://dx.doi.org/10.1016/j.jhydrol.2014.06.037.
Zhao,R.J.,1984.Watershed Hydrologic Simulation:Xinanjiang Model and Shanbei Model.Water Resources and Electric Power Press,Beijing(in Chinese).
This work was supported by the Key Project in the National Science and Technology Pillar Program during the Twelfth Five-Year Plan Period(Grant No.2012BAK10B04)and the Specific Research Fund of the China Institute of Water Resources and Hydropower Research(Grant No.JZ0145B032014).
*Corresponding author.
E-mail address:zhangdw@iwhr.com(Da-wei Zhang).
Peer review under responsibility of Hohai University.
http://dx.doi.org/10.1016/j.wse.2015.05.002
1674-2370/©2015 Hohai University.Production and hosting by Elsevier B.V.This is an open access article under the CC BY-NC-ND license(http:// creativecommons.org/licenses/by-nc-nd/4.0/).
 Water Science and Engineering2015年3期
- Water Science and Engineering的其它文章
- Uniqueness,scale,and resolution issues in groundwater model parameter identification
- Variable fuzzy assessment of water use efficiency and benefits in irrigation district
- Effects of thermodynamics parameters on mass transfer of volatile pollutants at air-water interface
- Analysis of soluble chemical transfer from soil to surface runoff and incomplete mixing parameter identification
- Adsorption of Cr(VI)in wastewater using magnetic multi-wall carbon nanotubes
- Degradation of acephate using combined ultrasonic and ozonation method