Spatiotemporal variations of maximum seasonal freeze depth in 1950s–2007 over the Heihe River Basin,Northwest China
QingFeng Wang ,TingJun Zhang
1.State Key Laboratory of Frozen Soil Engineering,Cold and Arid Regions Environmental and Engineering Research Institute,CAS,Lanzhou,Gansu 730000,China
2.College of Earth and Environmental Sciences,Lanzhou University,Lanzhou,Gansu 730000,China
3.National Snow and Ice Data Center,Cooperative Institute for Research in Environmental Sciences,University of Colorado at Boulder,80309,USA
1 Introduction
Frozen ground,consisting of both seasonally frozen ground and permafrost,plays an essential role in high latitude and altitude environments (Frauenfeld and Zhang,2011),as well as global thermal,water and carbon budgets (Jinet al.,2009).Soil seasonal freezing/thawing processes in cold regions play a major role in ecosystem diversity,productivity,and hydrological process through affecting the soil thermal regime and its physical properties directly (Zhanget al.,2003;Frauenfeldet al.,2004).Furthermore,this process also affects water exchange between the ground surface and the atmosphere,which ultimately impacts weather and climate systems through changes in surface energy balance.Soil temperature is linked to the climate through the ground surface,vegetation,snow cover,and perhaps most importantly,the top layer of the ground that thaws and freezes seasonally(Lachenbruch and Marshall,1986;Zhanget al.,1997;Zhang and Stamnes,1998).In permafrost regions,active layer thickness (ALT) is an indicator of climate change (Nelsonet al.,1997;Brownet al.,2000;Osterkamp,2007).Similarly,maximum seasonal frozen depth (MSFD) can also be used to study long-term changes in climate and regional environments (Zhanget al.,2001).Therefore,investigation on spatiotemporal variations of MSFD over the Heihe River Basin is of great importance for systematic understanding of regional climate and environmental change,ecological-hydrological processes,water resources assessment,construction and resource development.
The individual and combined interactions of the freezing/thawing layer in cold regions with climate changes at local,regional,and hemispheric scales are still relatively poorly understood.Most research mainly focused on the ALT changes in permafrost regions of the Arctic (Hinkelet al.,1997;Romanovsky and Osterkamp,1997;Zhanget al.,1997;Nelsonet al.,1998;Streletskiyet al.,2008) and on the Qinghai-Tibetan Plateau (QTP) (Wu and Zhang,2010;Wuet al.,2012a).However,research on MSFD changes in seasonally frozen ground regions is very limited.
The main purpose of this study is to investigate the spatiotemporal variations of MSFD over the Heihe River Basin in Northwest China over the period from the 1950s to 2007.Based on soil and air temperatures at the meteorological stations of the China Meteorological Administration (CMA),the averaged time series of MSFD for 1960–2007 over the basin is structured.In order to investigate the driving factors in spatiotemporal changes of MSFD,we also investigated impacts of changes in mean annual air temperature (MAAT),winter air temperature,mean annual ground surface temperature (MAGST),degree days of thawing for air (DDTa) and for the surface (DDTs),degree days of freezing for the surface (DDFs),as well as annual precipitation and winter precipitation on MSFD across the study area.
2 Study area
The Heihe River Basin is the second largest inland river basin in Northwest China,located in central part of Hexi Corridor and roughly between 98°00'E–101°30'E,38°00'N–42°00'N (Gao and Li,1991).The basin originates in the watershed between the Zoulangnanshan and Tuolainanshan Mts.in the Qilian mountain range.Geographically,the Heihe River Basin is divided into three parts from south to north,the upper reaches (from Yingluoxia valley upstream),the middle reaches (between Yingluoxia valley and Zhengyixia valley),and the lower reaches(from Zhengyixia valley downstream) (Cheng,2009)(Figure 1).
The upper reaches with elevation ranging from 2,000 m a.s.l.to 5,500 m a.s.l.,belong to the cold semi-arid mountain zone dominated by shrubs and trees.MAAT in this area is lower than 2 °C,and mean annual precipitation increases from about 250 mm in the low-mountain or hill zone to about 500 mm in the high-mountain zone (Chen and Qu,1992).It has been calculated that the average decreasing rate of MAAT and the increasing rate of annual precipitation with elevation from Yingluoxia valley to Yeniugou is 0.80 °C/100m and 15 mm/100m,respectively (Chenget al.,2010).The middle reaches belong to the mid-stream temperate zone controlled by cash crops like wheat and corn,with MAAT lower than 8 °C.The elevation in the middle reaches decreases from about 2,000 m a.s.l.to 1,000 m a.s.l.,and mean annual precipitation decreases from 250 mm to less than 100 mm from south to north (Liet al.,2001).Mainly occupied by bare gobi with mean elevation of about 1,000 m a.s.l.,the lower reaches pertain to the downstream warm temperate zone,with MAAT of 8–10 °C and annual precipitation of less than 50 mm (Qi and Luo,2005;Liet al.,2012).
3 Data source and method
We collected daily soil and monthly air temperatures at the meteorological stations from CMA located over the Heihe River Basin and its adjacent area.Data from 15 meteorological stations located over the Heihe River Basin and eight meteorological stations in the adjacent area (Figure 1) are collected for this study.It is noted that:(1) considering the integrity of the Heihe River Basin area coverage,i.e.,without blank area in the north of Ejinaqi-Jihede through Kriging interpolation method,the data at Hami and Yiwu meteorological stations are supplemented;(2)both soil and air temperatures were measured at 20 stations over the Heihe River Basin and its adjacent area except three stations with only air temperature data (Table 1).All measurements were conducted by well trained technicians and professionals with established and uniform guidelines by CMA.Soil temperatures are measured at depths of 0.00,0.05,0.10,0.15,0.20,0.40,0.60,0.80,1.60 and 3.20 m,respectively,except that they are only measured at 0.00 m depth at Jihede,Wutonggou and Yeniugou.
Though some of the meteorological stations have long continuous records,analyzing soil/air temperature time series of these individual stations would only result in partial conclusions as most observation records contain many missing data and some only cover short periods.In order to ensure data consistency and comparability at all stations,missing data is interpolated based on a nearby station through the regression method at the significance level of at leastp≤0.05.Then all the meteorological stations are composited to structure an averaged time series that provides an integrated view over the Heihe River Basin.
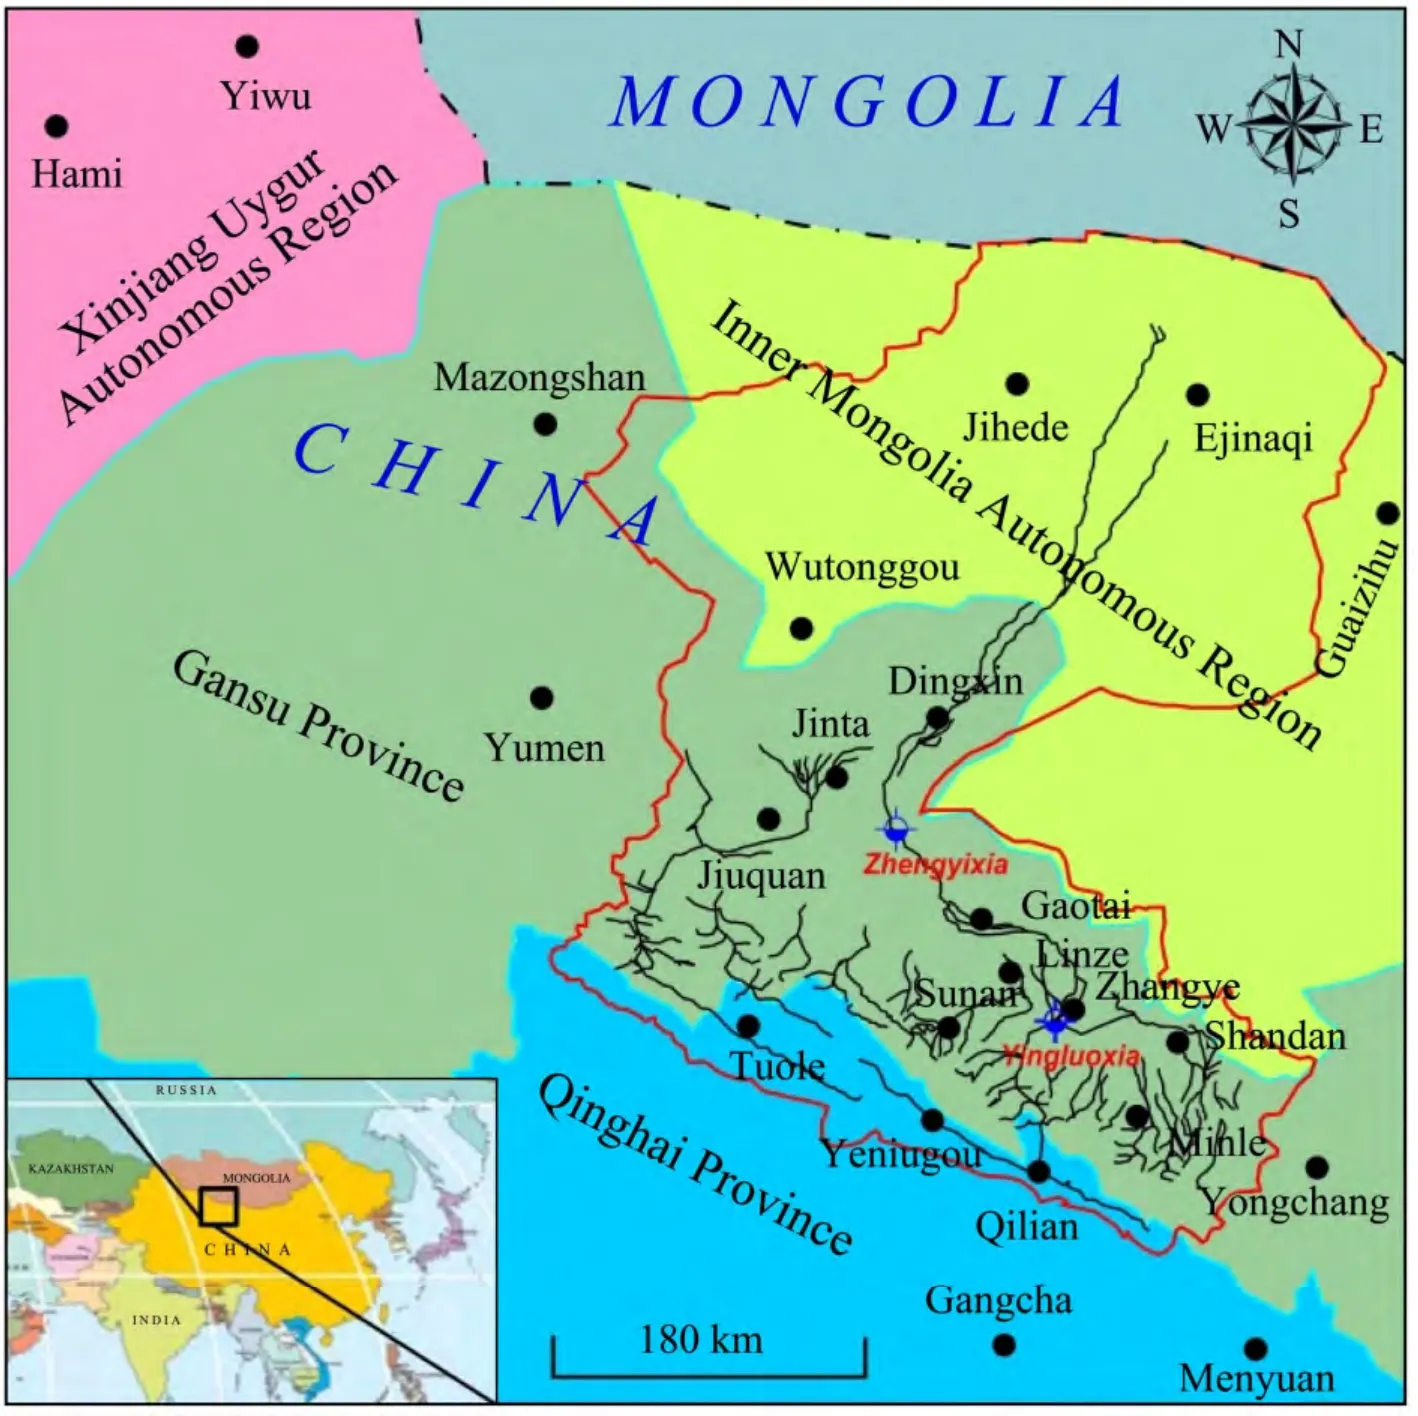
Figure 1 The meteorological stations distribution map of CMA over the Heihe River Basin and its adjacent area.The red line in bold is the boundary of the Heihe River Basin;the black line is the river system of Heihe River
We linearly interpolate the depth of the 0 °C isotherm throughout the 0.00–3.20 m temperature profile,which is considered to be the freeze/thaw depth.Frauenfeldet al.(2004) found that the available observed annual MSFD and the linearly interpolated values had an excellent correlation during 1930–1990 for 242 stations throughout Russia.However,if some data throughout the 0.00–3.20 m depth are missing,especially during the period when MSFD may occur,the MSFD of that year is excluded from its time series.Based on daily observations of soil temperatures,the daily freeze depth can be interpolated.The annual MSFG is selected from which is the maximum in all daily depths in cold season.
In this study,when performing the calculation based on daily data we compute the annualDDFs/DDTsas the sum of ground surface temperature for all days below/above 0 °C during the freezing/thawing period.Moreover,DDFsis computed over a period from Jul.1 to Jun.30 of the following calendar year,whileDDTsis calculated from Jan.1 to Dec.31 of the same calendar year (Zhanget al.,1997;Frauenfeldet al.,2007;Wuet al.,2012b).We calculatedDDFs/DDTsusing the following equations:
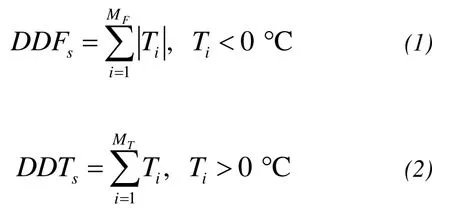
whereDDFsandDDTsare the annual degree days of freezing and thawing index for ground surface,respectively;Tirepresents the daily ground surface temperature;MFandMTcorrespond to the last day of freezing and thawing periods,respectively.
Similarly,we use monthly air temperatures to estimate the annualDDFa/DDTafor the air.Furthermore,we define the freezing period to be July to June in the following year in order to sum the freezing index in a continuous cold season and the thawing period of January–December (Frauenfeldet al.,2007;Wuet al.,2012b).DDFa/DDTais calculated using the following equations:
当试探失败时,我们可以将该决策神经元的返回值作为参数反馈到前一个神经元去。这样我们得到了一个只有两个神经元的神经网络,但显然它比纯粹经验框架下的线性运算要精确多了。此外,我们还可以从另一个方向改造原神经元,将每个输入本身改造成一个神经元,输出值并不是简单读数,而是计算后的数值。实际上,利用类似的原理,我们可以设计出相当复杂的神经网络拓扑结构。
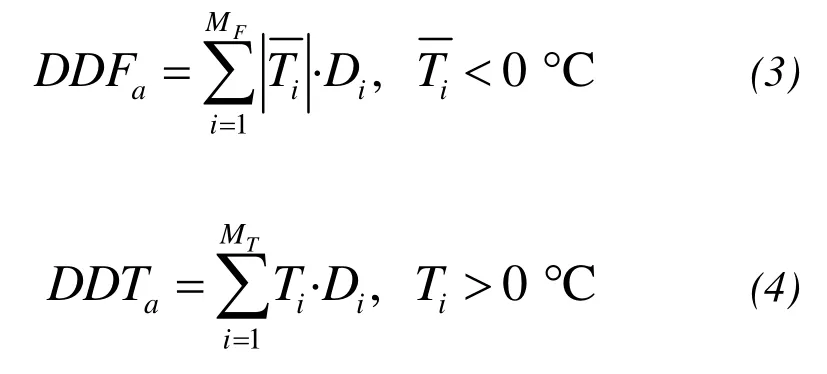
whereDDFaandDDTaare the annual degree days of freezing and thawing for the air respectively;MFandMTare months when the mean monthly temperature is above/below 0 °C during the freezing/thawing periods;Tiis the mean monthly air temperature;Diis the number of days inMForMT.Therefore,time series of annualDDFa/DDTafor each weather station were obtained.The estimation of accuracy for using monthly air or ground surface temperature observations in the calculation of the approximate annualDDFandDDTwas discussed in previous studies and it was found to be more than 95% (Zhanget al.,1996;Frauenfeldet al.,2007;Wuet al.,2011).
4 Results and discussion
4.1 Interannual variation
Among the 12 meteorological stations of CMA over the Heihe River Basin,soil temperatures at three stations were observed in a relatively comprehensive long-term at depths of 0.00,0.05,0.10,0.15,0.20,0.40,0.80,1.60 and 3.20 m,respectively,including Ejinaqi,Jiuquan and Zhangye.Accordingly,the MSFD time series at the three stations could be obtained through the interpolation method at 0.00–3.20 m depth.However,due to data missing at a deeper depth of 0.00–3.20 m in many years,the overall trends of MSFDs at other meteorological stations are difficult to estimate.

Table 1 Location of the meteorological stations of CMA and the observation records of soil temperature,air temperature and precipitation at the meteorological stations over the Heihe River Basin and its adjacent area
Here the "edaphic factor" E is introduced to estimate MSFDs at the meteorological stations.MSFD can be estimated from a variant of the Stefan solution using a freezing index in the following manner:

whereZis MSFD (m);ktis the thermal conductivity of the frozen soil (W/(m·°C));ntis the n-factor;Lis the latent heat of fusion (J/kg);ρis the soil bulk density (kg/m3);Wisthe soil water content by weight(dimensionless);andDDFais the annual freezing index (°C-day).
The formula(5)can be described as:

where

From the formula(6),E factor can be expressed as:

The E factor can be calculated through the formula(8),and then the mean of E factor and MSFD time series at each station could be calculated over the Heihe River Basin.The decreasing rates for MSFD time series at Ejinaqi,Tuole,Qilian and Shandan stations are all larger than the averaged time series (Figures 2 and 3).The reason is that the decreasing rates forDDFatime series at these four stations are all larger than at other stations over the basin.The MSFDs at nine meteorological stations of CMA are averaged into a time series for 1960–2007.Evaluating the averaged MSFD time series in the period between 1960 and 2007 over the basin exhibits a statistically significant trend of-4.0 cm/decade or a net change of-19.2 cm for the 48-year period (Figure 3).
Similar results have been noted by other studies.For example,Frauenfeldet al.(2004) reported that MSFD decreased by 34 cm over the 1956–1990 period across Russia.It was revealed that the MSFD decreased by 0.1–0.2 m since the 1980s in the source area of the Yellow River on the QTP in China (Jinet al.,2009).Evaluating MSFD at 387 stations for 1930–2000 in the Eurasian high latitudes in Russia revealed a statistically significant trend of-4.5 cm/decade and a net change of-31.9 cm (Frauenfeld and Zhang,2011).
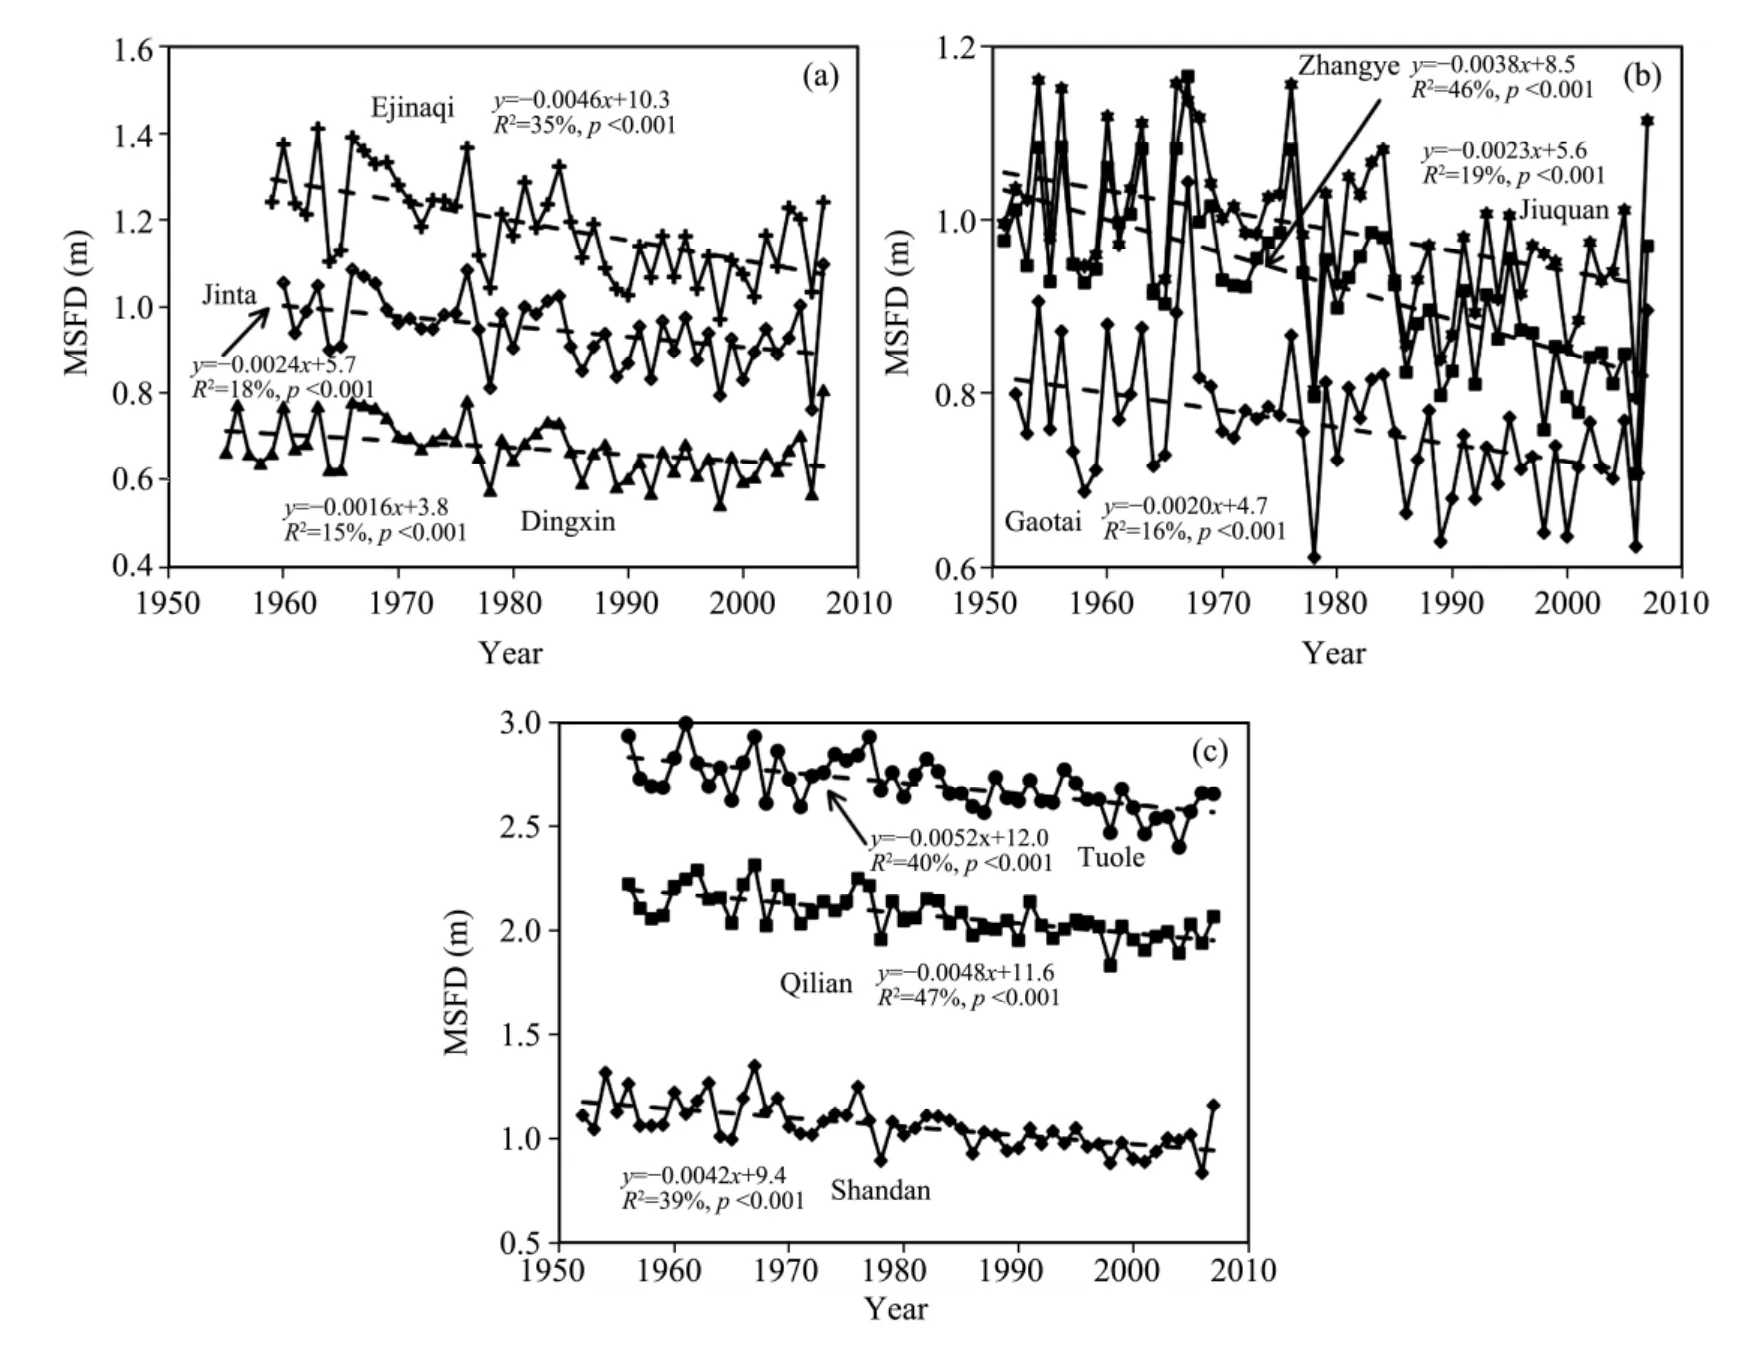
Figure 2 MSFD time series at the nine meteorological stations for the 1950s to 2007 over the Heihe River Basin.Dotted line presents the linear least squares regression line
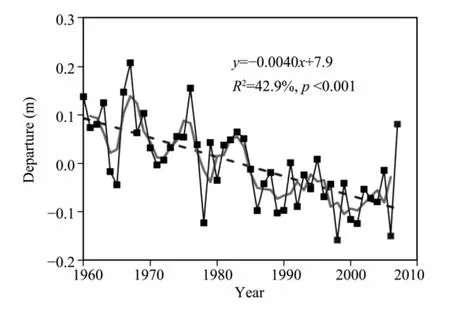
Figure 3 Averaged time series of MSFD in 1960–2007 over the Heihe River Basin.Grey line in bold presents the three-year moving line.Black dotted line presents the linear least squares regression line
4.2 Potential forcing variables
The MAAT exhibits a statistically significant increase of 0.37 °C/decade in 1960–2008,or a net change of approximately 1.8 °C over the 49-year period (Figure 4).Winter air temperature has increased at a rate of 0.50 °C/decade in 1960–2007.MAGST indicates a statistically significant increase over the 1972–2006 period of 0.58 °C/decade,or a net change of approximately 2.0 °C over the 35-year period.The correlation coefficients between MSFD and MAAT,winter air temperatures as well as MAGST areR=-0.64,-0.94,and-0.66 (p<0.01),respectively.The negative correlation illustrates that,as the MAAT,winter air temperature and MAGST increased in 1960–2008 over the basin,MSFD decreased over the same period.
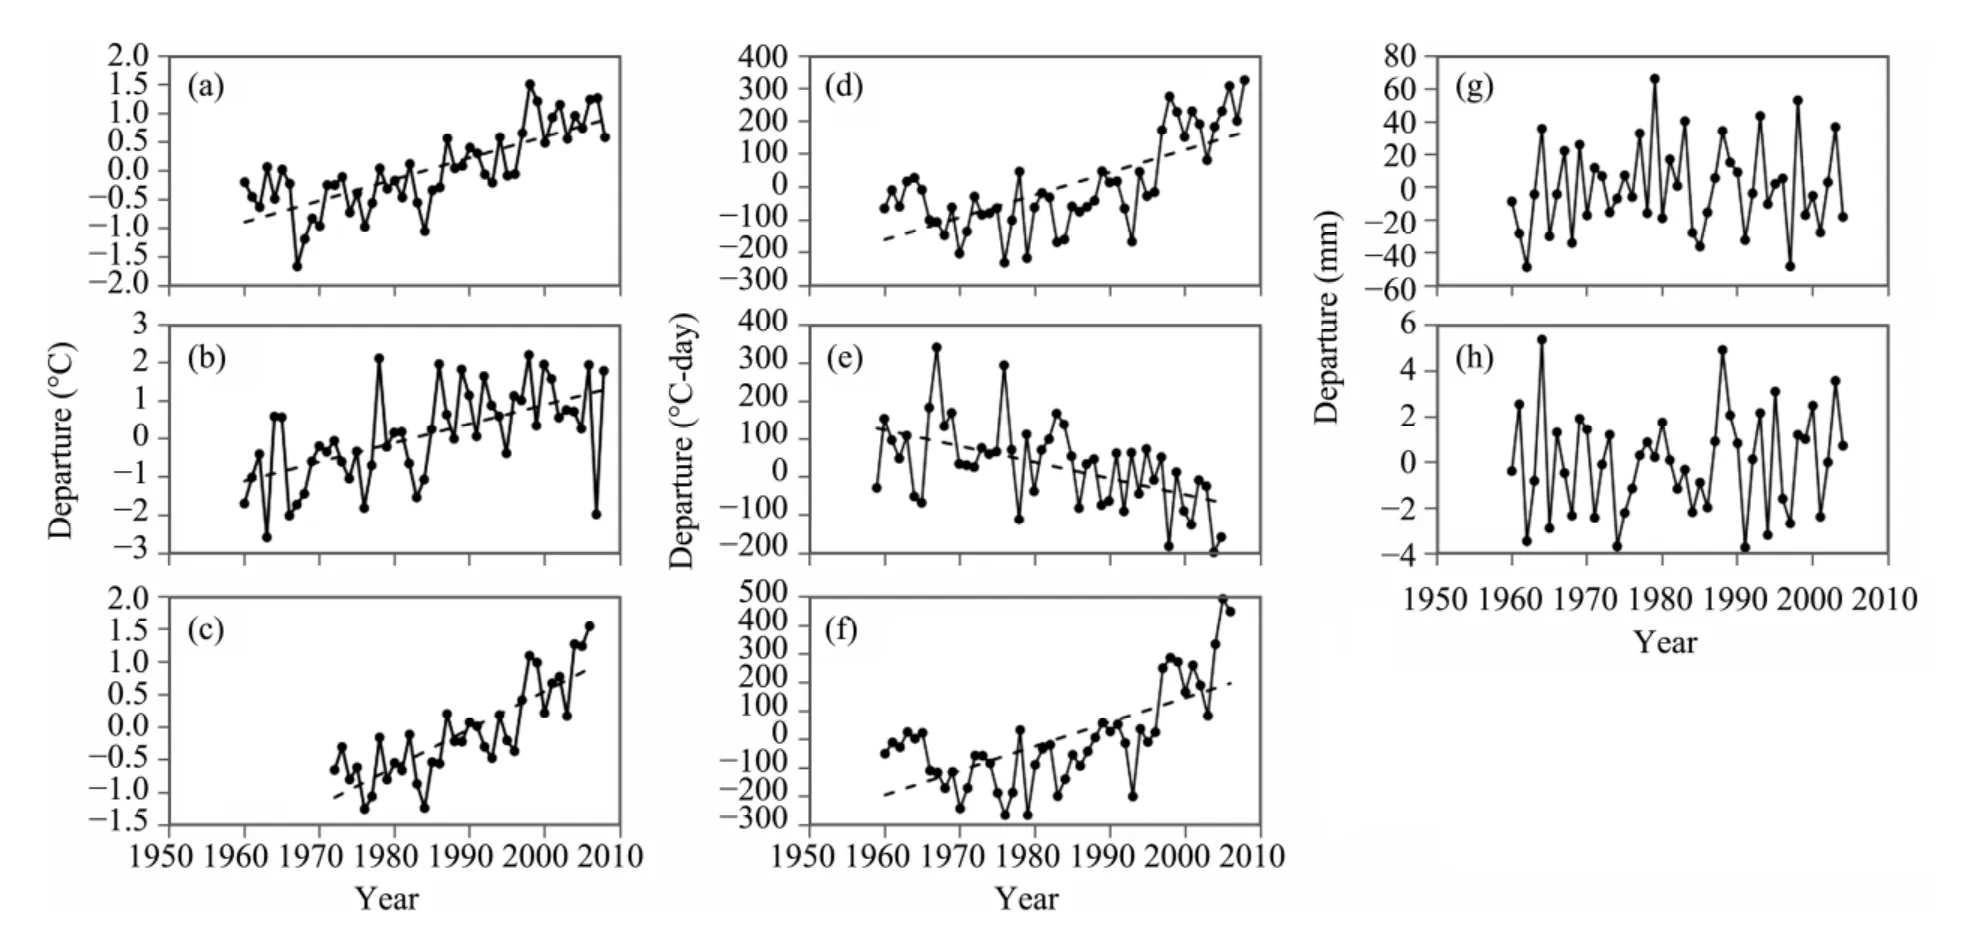
Figure 4 Time series of potential forcing variables for MSFD in 1959–2008:(a) MAAT;(b) winter air temperature;(c) MAGST;(d) DDTa;(e) DDFs;(f) DDTs;(g) annual precipitation;and (h) winter precipitation.Dotted lines in bold present the linear least squares regression lines (if significant)
As the MSFDs usually occur in the end of the cold seasons,the DDF should be a better indicator of cold season conditions than MAAT and MAGST.TheDDFshas decreased at a rate of-42.5 °C-day/decade over the 1959–2005 period,indicating that as the climate has been warming,the magnitude and duration of cold conditions have significantly decreased.DDTaandDDTshave increased at a rate of 68.1 °C-day/decade over the 1960–2008 period and 85.4 °C-day/decade over the 1960–2006 period,respectively.DDFs,DDTaandDDTsare significantly correlated with the MSFD time series whenR= 0.89,-0.58 and-0.59 (p<0.01),indicating that 79.2%,33.6% and 34.8% of the variance in MSFD can be accounted for changes inDDFs,DDTaandDDTs,respectively.
Precipitation changes over the Heihe River Basin also likely affect the soil thermal regime and hence MSFD.There is both no statistically significant trend in annual precipitation and winter precipitation for the 1960–2004 period.The correlation coefficients between annual precipitation,winter precipitation and MSFD are-0.01 and-0.15,respectively,and they are both not statistically significant.
4.3 Spatial variation
Based on the MSFD of the 20 meteorological stations over the Heihe River Basin and its adjacent area,spatial distribution maps of the MSFD during 2003–2005 were compiled through Kriging interpolation method over the basin (Figure 5).The blue zone was possibly overlain by permafrost and it covered about 10.3% of the Heihe River Basin (Zhanget al.,2012).MSFD was shallower in the east-central basin,gradually deepened in other sections of the basin,and changed greatly in the Heihe River source area.The maximum of MSFD appeared in the Tuole area,which was 2.6–2.7 m in 2003 and 2.4–2.5 m in 2004 and 2005.
However,the maximum of MSFD may be not accurate,because there are only three meteorological stations in the Heihe River source area,and there are no long term observation data in the deep seasonally frozen ground regions near the lower boundary of permafrost.It was found that the lower boundary of permafrost along the provincial highway S204 in the west branch of the Heihe River in its source area is preliminarily between 3,650 and 3,700 m a.s.l.(Zhanget al.,2012;Wanget al.,2013).Two boreholes,T5#(99°04'50"E,38°46'24"N;3,650 m a.s.l.) and T6#(99°07'.43"E,38°45'12"N;3,609 m a.s.l.),were drilled during the summer of 2011 in seasonally frozen ground regions near the lower boundary of permafrost.With elevation increasing,the date reaching MSFD became later (Figure 7).It could be estimated that the date reaching MSFD at boreholes T5# and T6# are in mid or late March.Based on ground temperature profiles of the two boreholes in early March,2013,the MSFD at boreholes T5# and T6# could be 4.9 m and 3.1 m,respectively (Figure 6).
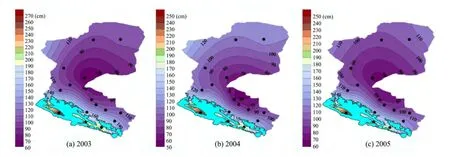
Figure 5 Spatial distribution of MSFD in 2003–2005 over the Heihe River Basin.The blue zone is the possible distribution area of permafrost (Zhang et al.,2012)
With elevation increasing,the MSFD deepened.The MSFD increased by 7.7,7.0 and 6.7 cm with elevation increasing by every 100 m in 2003,2004 and 2005,respectively (Figure 7).
The MSFD distribution pattern in 2003–2005 was consistent with that of averagedDDFain 1960–2007.AveragedDDFawas larger and changed greatly in the Heihe River source area.It was shallower in the east-central basin and gradually became larger in other sections of the basin (Figure 8).The minimum of averagedDDFaappeared in the northeast of Gaotai(550–600 °C-day),and the maximum appeared in Tuole and Yeniugou areas (2,050–2,100 °C-day).With elevation increasing,averagedDDFabecame larger at a rate of 51.6 °C-day/100m (Figure 8),and therefore,the MSFD and the date reaching MSFD are becoming deeper and later,respectively (Figure 7).
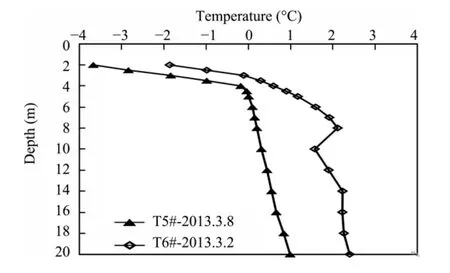
Figure 6 Ground temperature profiles of boreholes T5# and T6# in the west branch of the Heihe River in its source area
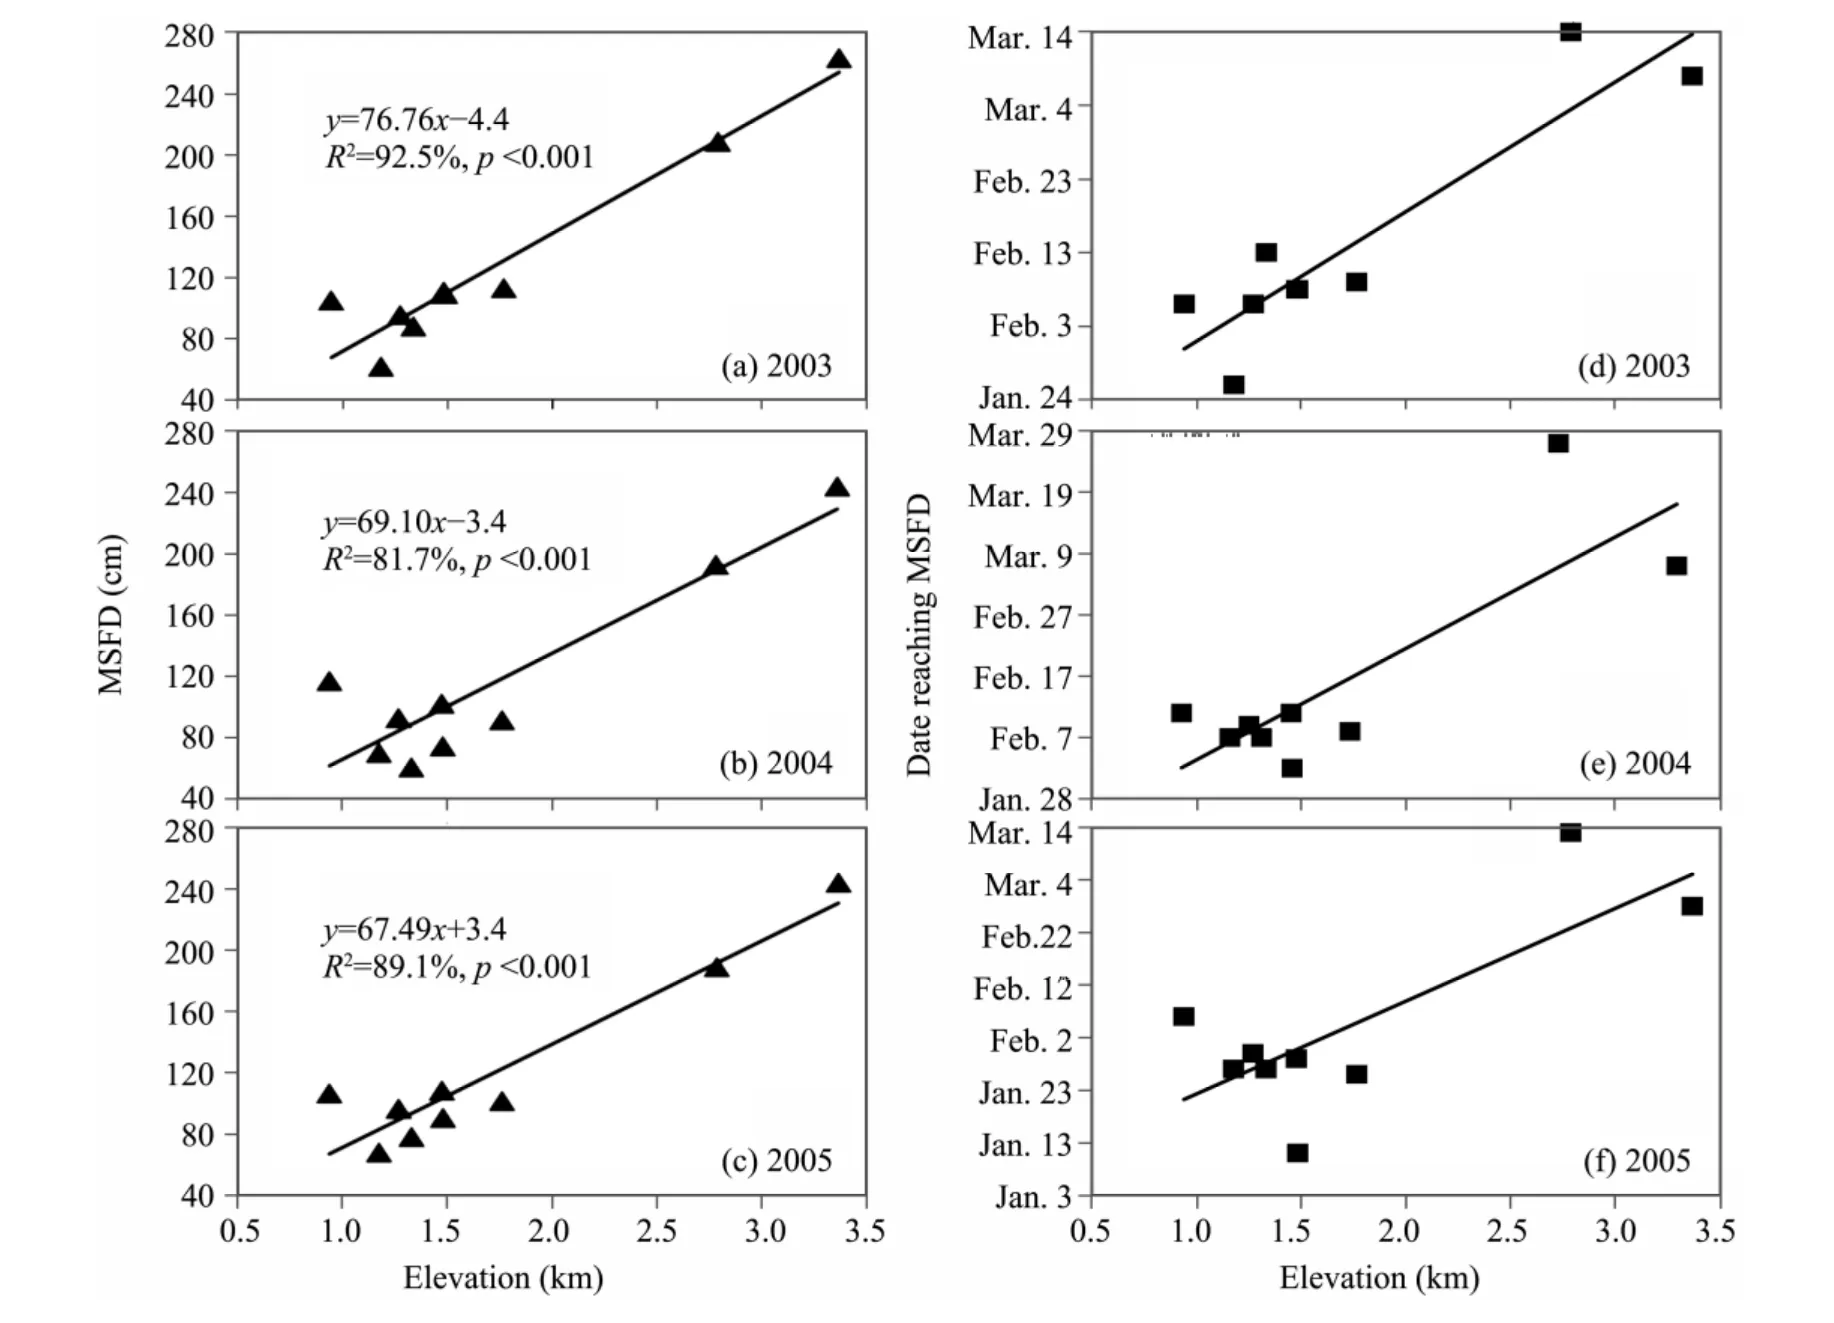
Figure 7 MSFD and the date reaching MSFD changing with elevation in 2003–2005 over the basin.Black lines in bold present the linear least squares regression lines (if significant)
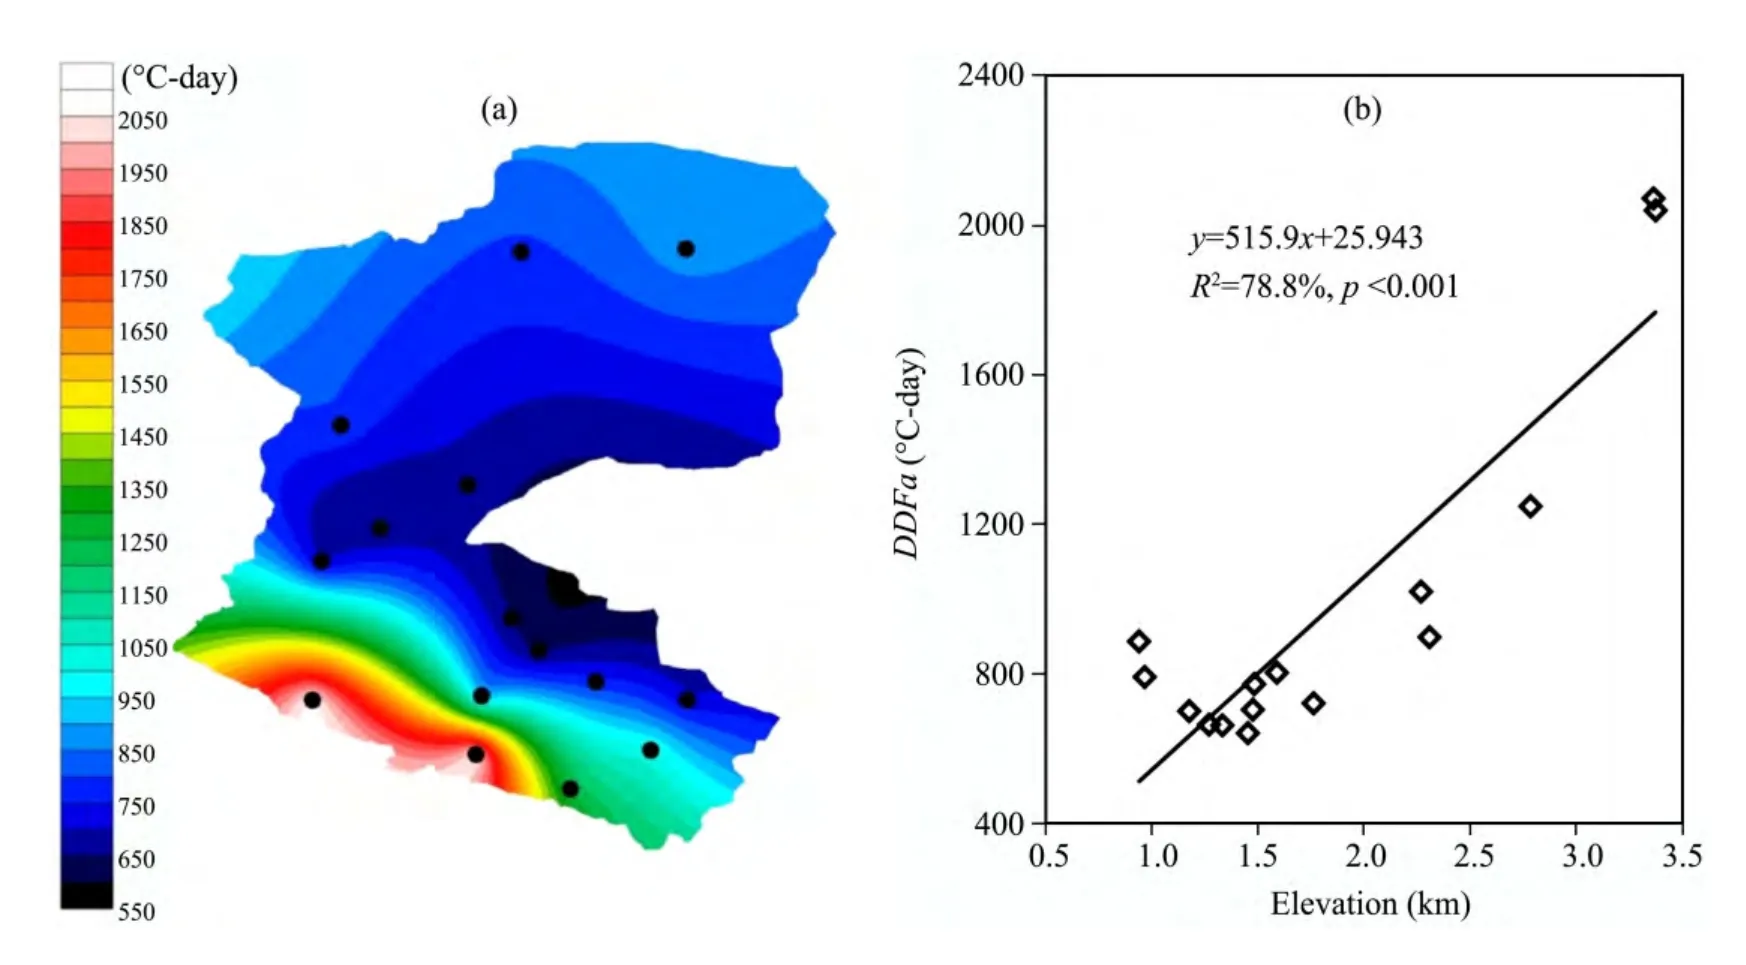
Figure 8 Spatial distribution of averaged DDFa in 1960–2007 (a) and averaged DDFa changing with elevation (b) over the basin
5 Conclusions
Based on soil and air temperatures at the meteorological stations of CMA over the Heihe River Basin,MSFD time series are structured into a composite time series over the period of 1960–2007.Evaluating the averaged MSFD time series for 1960–2007 over the basin exhibits a statistically significant trend of-4.0 cm/decade or a net change of-19.2 cm for the 48-year period.
To determine the driving factors in MSFD changes,we analyzed MAAT,winter air temperature,MAGST,DDTa,DDTs,DDFs,annual precipitation,and winter precipitation.The MSFD had significantly negative correlation with MAAT,winter air temperatures,MAGST,DDTa,as well asDDTs.There was significantly positive correlation betweenDDFsand MSFD time series.
The MSFD was deeper and changed greatly in the Heihe River source area.MSFD was shallower in the east-central basin and gradually became deeper in other sections of the basin.The maximum of MSFD appeared in the Tuole area,which was 2.6–2.7 m in 2003 and 2.4–2.5 m in 2004 and 2005.The MSFD distribution pattern in 2003–2005 is consistent with that of averagedDDFain 1960–2007.However,the maximum of MSFD may be not accurate,because there are only three meteorological stations in the Heihe River source area,and there is no long term observation data in the deep seasonally frozen ground regions near the lower boundary of permafrost.With elevation increasing,the MSFD and the date reaching MSFD became deeper and later,respectively.The MSFG increased by 7.7 cm,7.0 cm and 6.7 cm with elevation increasing by every 100 m in 2003,2004 and 2005,respectively.The reason is that averagedDDFaincreased with increasing elevation(51.6 °C-day/100m).
This study is supported by the Global Change Research Program of China (No.2010CB951402),the Natural Science Foundation of China (Nos.91025013,91325202),the State Key Laboratory of Frozen Soil Engineering (No.SKLFSE-ZY-06),CAS,China,and the Major Research Plan of the Natural Science Foundation of China (No.2013CBA01802).
Brown J,Hinkel KM,Nelson FE,2000.The Circumpolar Active Layer Monitoring (CALM) program:Research designs and initial results.Polar Geography,24(3):166–258.DOI:10.1080/10889370009377698.
Chen LH,Qu YG,1992.Rational Development and Utilization on Water and Soil Resources in Hexi Region.Science Press,Beijing,pp.9–13.(in Chinese)
Cheng GD,2009.Study on Water-Ecology-Economic System Integrated Management over the Heihe River Basin.Science Press,Beijing,pp.1–2.(in Chinese)
Cheng GD,Xiao HL,Chen YN,2010.Eco-hydrology Study of the Typical Inland River in Western China.Meteorological Press,Beijing,pp.28–29.(in Chinese)
Frauenfeld OW,Zhang T,2011.An observational 71-year history of seasonally frozen ground changes in the Eurasian high latitudes.Environmental Research Letters,6:044024.DOI:10.1088/1748-9326/6/4/044024.
Frauenfeld OW,Zhang T,Barry RG,et al.,2004.Interdecadal changes in seasonal freeze and thaw depths in Russia.Journal of Geophysical Research,109:D5101.DOI:10.1029/2003JD004245.
Frauenfeld OW,Zhang T,McCreight JL,2007.Northern hemisphere freezing/thawing index variations over the twentieth century.International Journal of Climatology,27(1):47–63.DOI:10.1002/joc.1372.
Gao QZ,Li FX,1991.Case Study of Rational Development and Utilization of Water Resources in the Heihe River Basin.Gansu Science and Technology Press,Lanzhou,pp.1–5.(in Chinese)
Hinkel KM,Outcalt SI,Taylor AE,1997.Seasonal patterns of coupled flow in the active layer at three sites in northwest North America.Canadian Journal of Earth Sciences,34:667–678.
Iijima Y,Fedorov AN,Park H,et al.,2010.Abrupt increases in soil temperatures following increased precipitation in a permafrost region central Lena River Basin Russia.Permafrost and Periglacial Processes,21(1):30–41.DOI:10.1002/ppp.662.
Jin HJ,He RX,Cheng GD,et al.,2009.Changes in frozen ground in the source area of the Yellow River on the Qinghai-Tibet Plateau,China,and their eco-environmental impacts.Environmental Research Letters,4(4):045206.DOI:10.1088/1748-9326/4/4/045206.
Lachenbruch AH,Marshall BV,1986.Changing climate:Geothermal evidence from permafrost in the Alaskan Arctic.Science,234:689–696.DOI:10.1126/science.234.4777.689.
Li X,Lu L,Cheng GD,et al.,2001.Quantifying landscape structure of the Heihe River Basin,northwest China using FRAGSTATS.Journal of Arid Environments,48:521–535.DOI:10.1006/jare.2000.0715.
Li ZL,Li ZJ,Xu ZX,et al.,2012.Temporal variations of reference evapotranspiration in Heihe River Basin of China.Hydrology Research.DOI:10.2166/nh.2012.125.
Nelson FE,Hinkel KM,Shiklomanov NI,et al.,1998.Active-layer thickness in north-central Alaska:Systematic sampling,scale,and spatial autocorrelation.Journal of Geophysical Research,103(D22):28963–28973.DOI:10.1029/98JD00534.
Nelson FE,Shiklomanov NI,Mueller GR,et al.,1997.Estimating active-layer thickness over a large region:Kuparuk River basin,Alaska,U.S.A..Arctic Antarctic and Alpine Research,29(4):367–378.
Osterkamp TE,2007.Characteristics of the recent warming of permafrost in Alaska.Journal of Geophysical Research,112:F02S02.DOI:10.1029/2006JF000578.
Qi SZ,Luo F,2005.Water environmental degradation of the Heihe River Basin in arid northwestern China.Environmental Monitoring and Assessment,108:205–215.DOI:10.1007/s10661-005-3912-6.
Romanovsky VE,Osterkamp TE,1997.Thawing of the active layer on the coastal plain of the Alaskan Arctic.Permafrost and Periglacial Processes,8(1):1–22.DOI:10.1002/(SICI)1099-1530(199701)8:1<1::AID-PPP243>3.0.CO;2-U.
Streletskiy DA,Shiklomanov NI,Nelson FE,et al.,2008.13 years of observations at Alaskan CALM sites:Long-term active layer and ground surface temperature trends.In:Kane DL,Hinkel KM (eds.).Proceedings of the 9th International Conference on Permafrost.June 29–July 3,Fairbanks,Alaska,Institute of Northern Engineering,University of Alaska Fairbanks,2:1727–1732.
Wang QF,Zhang T,Wu JC,et al.,2013.Investigation on permafrost distribution over the upper reaches of the Heihe River in the Qilian Mountains.Journal of Glaciology and Geocryology,35(1):19–25.DOI:10.7522/j.issn.1000-0240.2013.0003.(in Chinese)
Wu QB,Zhang T,2010.Changes in active layer thickness over the Qinghai-Tibetan Plateau from 1995 to 2007.Journal of Geophysical Research,115:D09107.DOI:10.1029/2009JD012974.
Wu QB,Zhang T,Liu YZ,2012a.Thermal state of the active layer and permafrost along the Qinghai-Xizang (Tibet) railway from 2006 to 2010.The Cryosphere,6:607–612.DOI:10.5194/tc-6-607-2012.
Wu TH,Wang QX,Zhao L,et al.,2011.Observed trends in surface freezing/thawing index over the period 1987–2005 in Mongolia.Cold Regions Sciences and Technology,69(1):105–111.DOI:10.1016/j.coldregions.2011.07.003.
Wu TH,Zhao L,Li R,et al.,2012b.Recent ground surface warming and its effects on permafrost on the central Qinghai-Tibet Plateau.International Journal of Climatology,33(4):920–930.DOI:10.1002/joc.3479.
Zhang T,Armstrong RL,Smith J,2003.Investigation of the near-surface soil freeze/thaw cycle in the contiguous United States:Algorithm development and validation.Journal of Geophysical Research,108(D22):8860.DOI:10.1029/2003JD003530.
Zhang T,Barry RG,Gilichinsky D,et al.,2001.An amplified signal of climatic change in soil temperatures during the last century at Irkutsk Russia.Climatic Change,49:41–76.DOI:10.1023/A:1010790203146.
Zhang T,Osterkamp TE,Stamnes K,1996.Some characteristics of the climate in northern Alaska,U.S.A..Arctic and Alpine Research,28:509–518.
Zhang T,Osterkamp TE,Stamnes K,1997.Effect of climate on the active layer and permafrost on the North Slope of Alaska,U.S.A..Permafrost and Periglacial Processes,8(1):45–67.DOI:10.1002/(SICI)1099-1530(199701)8:1<45::AID-PPP24 0>3.0.CO;2-K.
Zhang T,Stamnes K,1998.Impact of climatic factors on the active layer and permafrost at Barrow,Alaska.Permafrost Periglacial Processes,9(3):229–246.DOI:10.1002/(SICI)1099-1530(199807/09)9:3<229::AID-PPP286>3.0.CO;2-T.
Zhang T,Wang QF,Wu JC,et al.,2012.Preliminary investigation on permafrost distribution over the upper reaches of Heihe River Basin in western China.In:Proceedings of the 10th International Conference on Permafrost.Volume 4:International Contributions,Salekhard,Russia,pp.585–586.
 Sciences in Cold and Arid Regions2014年3期
- Sciences in Cold and Arid Regions的其它文章
- Retrieval study of lake water depth by using multi-spectral remote sensing in Bangong Co Lake
- Climate transformation to warm-humid and its effect on river runoff in the source region of the Yellow River
- Modeling tropical river runoff: A time dependent approach
- Water sources of plants and groundwater in typical ecosystems in the lower reaches of the Heihe River Basin
- Effects of fertilization on population density and productivity of herbaceous plants in desert steppe
- Effects of sand burial on dune plants: a review
