Corresponding Factors Influencing Crude Oils Assay Using Low-field Nuclear Magnetic Resonance
Feng Yunxia; Chu Xiaoli; Xu Yupeng; Tian Songbai
(Research Institute of Petroleum Processing, Beijing 100083)
Corresponding Factors Influencing Crude Oils Assay Using Low-field Nuclear Magnetic Resonance
Feng Yunxia; Chu Xiaoli; Xu Yupeng; Tian Songbai
(Research Institute of Petroleum Processing, Beijing 100083)
In this study, the main factors influencing the measurements by means of the off-line low-field1H NMR in the lab were discussed base on a robust calibration model established by the PLS algorithm using 255 crude oil samples. The preheating temperature had a great influence on the viscosity of oil samples and the resolution of spectral analysis. The repeatability of spectral measurements was impacted by the metal and wax content of the oil samples. For the case of high wax content oils, the wax species began to crystallize in the course of determination that could affect the repeatability of spectral measurements. These factors have evidenced why the preheating devices and filter unit are necessary when low field NMR system is used in the online analysis process. The investigation is very important for the on-line application of the low field NMR.
low-field NMR; influencing factors; crude oils assay
1 Introduction
In recent years, with crude oil prices increasingly spiraling, refineries are paying great attention to process analysis technology in order to effectively monitor the production process and save raw materials[1-2]. The physical and chemical properties of crude oils are of major importance to the petroleum refining processes. However, the traditional evaluation methods are often expensive, timeconsuming, and requiring a large amount of samples and poisonous solvents. Hence, it is necessary to develop a fast method for the real-time detection in process analysis.
Nuclear magnetic resonance (NMR) is primarily used as an analytical technique for elucidation of molecular structure and identification of chemical species in a wide range of fields such as food[3-4], agriculture[5], petrochemicals[6-7], medical science[8], and bioscience[9]. The more recent applications of NMR are associated with various multivariate data analysis methods to exploit the chemical and physical properties of many complex multi-component mixtures such as crude oils, asphaltenes, and base oils[10]. In quantitative analysis, the chemometric regression techniques, for instance the partial least squares (PLS), the principal component regression (PCR) and the artificial neural network (ANN), are routinely used to establish the correlation between NMR spectra and the properties of complex mixtures[11-12]. The main advantage of this correlation is that the assessment of several properties can be achieved simultaneously based on the unique NMR spectra[13-15].
With the development of new technologies using permanent magnets, the low magnetic field NMR instruments open up new possibilities for process analysis[16]. Compared with the high field NMR, the application of low magnetic field NMR in various industrial fields has been promoted thanks to its better stability, lower cost, faster analysis, and the nondestructive nature of measurements.
Small, specified low-field (less than 60 MHz) NMR systems have been used in bypass systems to perform the online analysis and reaction monitoring[17-19]. Since the 1990s the earliest on-line NMR analyzers were provided to petrochemical plants and utilized for controlling the production process[20]. More industrial applications of NMR with chemometric methods to predict all kinds of petroleum properties have already been realized[21-22].
This study focuses on discussing the important factors of low-field1H NMR in the lab, including the effect of viscosity of crude oils on the resolution of spectra and the factors influencing the repeatability of measurements. The factors influencing the test repeatability, such as the metal andwax contents in crude oils, were discussed in this paper.
2 Experimental
2.1 Low field NMR spectroscopy
All1H NMR spectra were recorded using a Qualion 58 MHz NMRS230022 spectrometer that is based on a permanent magnet NMR technology. The1H NMR measurements were performed at a sampling rate of 4 346 Hz, a band width of 2 173 Hz, and a number of loop scanning equating to 8. After storing the free induction decay (FID) signals, the final spectra were obtained through a number of steps such as zero fill, phase correction, removal of direct current (DC), fast Fourier transform (FFT), and baseline correction. All the steps could be completed automatically.
2.2 Samples
A total of 255 crude oil samples were analyzed in the laboratory to obtain the values of chemical and physical properties for each sample according to various industrial or analytical standard test methods.
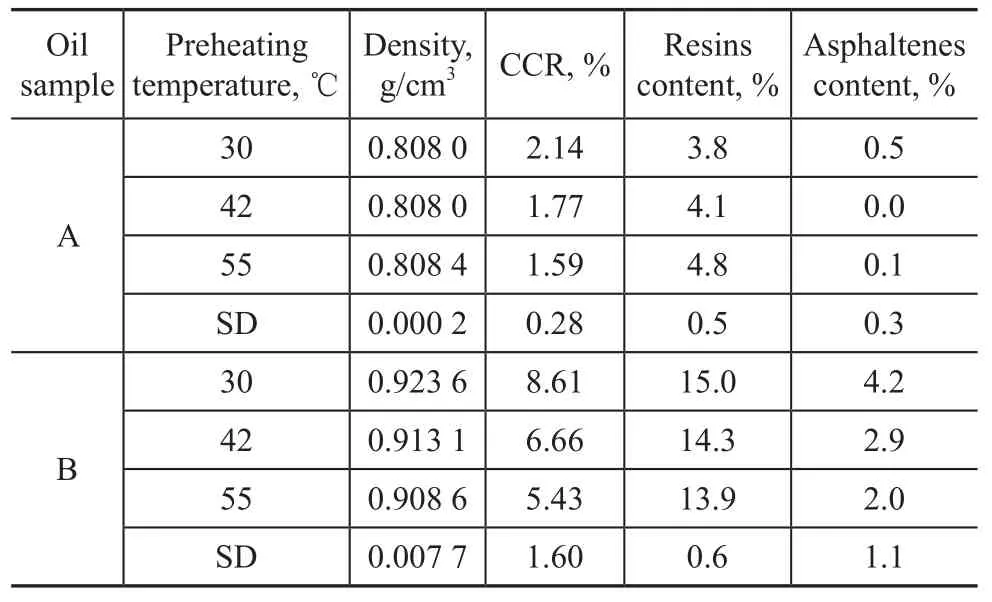
In the case of low field1H NMR, the liquidity of oils is very important for the measurements. All oil samples that are introduced into the analyzer must be in an entirely liquid form so that the distribution of protons in the entire molecule can be observed. Each oil sample is preheated at 42 ℃ in the water bath before scanning. Figure 1 shows the1H NMR spectra of 255 crude oil samples.

Figure 11H NMR spectra of crude oils
2.3 Multivariate analysis
Multivariate analysis was performed using the software developed independently by the Analytical Chemistry Department of the Research Institute of Petroleum Processing (RIPP). PLS regressions were performed with leave-one-out cross validation. The methods of building the calibration and validation models in this work were the same as those described previously by Li, et al.[23-24]All 255 samples were randomly divided into a training set and a validation set using the Kernel-Stone method, in which the training set consisted of 220 samples and the remaining 35 samples were contained in the validation set. The 220 samples in the calibration set were subjected to a PLS regression, in which 4 physicochemical variables (density, Conradson carbon residue, resins content, and asphaltenes content) were included.
The root mean square error of calibration (RMSECV) is used to assess the calibration performance. The calibration model for the oil properties is obtained with the optimum number of latent PLS factors; it is selected based on the predicted residual sum of squares (PRESS) by the cross-validation results. On the other hand, the standard error of prediction (SEP) for the validation set represents an evaluation of the predicted performance of the quantitative model. These values are calculated by the following equations:

wherenandmare the amount of oil samples included in the calibration and validation sets, respectively, whileare the properties of crude oil samples that are measured by the reference and NMR methods, respectively.
3 Results and Discussion
3.1 The results of calibration and validation of variables models
Table 1 shows the results of calibration and validation of the model. These values are in the required range of accuracy, which can be effectively used for the fast estimation of oil samples.

Table1 The PLS calibration and validation results of various property items
3.2 Effects of viscosity on resolution
Crude oil samples with different viscosity values were tested in order to observe the effect of viscosity of crude oils on the test results. In this study, some heavy and light oil samples were preheated to different temperatures by a water bath, and the heavy oil samples were preheated by an oven when the required temperature was higher than 100 ℃. The oil property items were predicted by the models which are referred to in Section 3.1. The values of standard deviation (SD) indicated the difference in oil property at various temperatures.
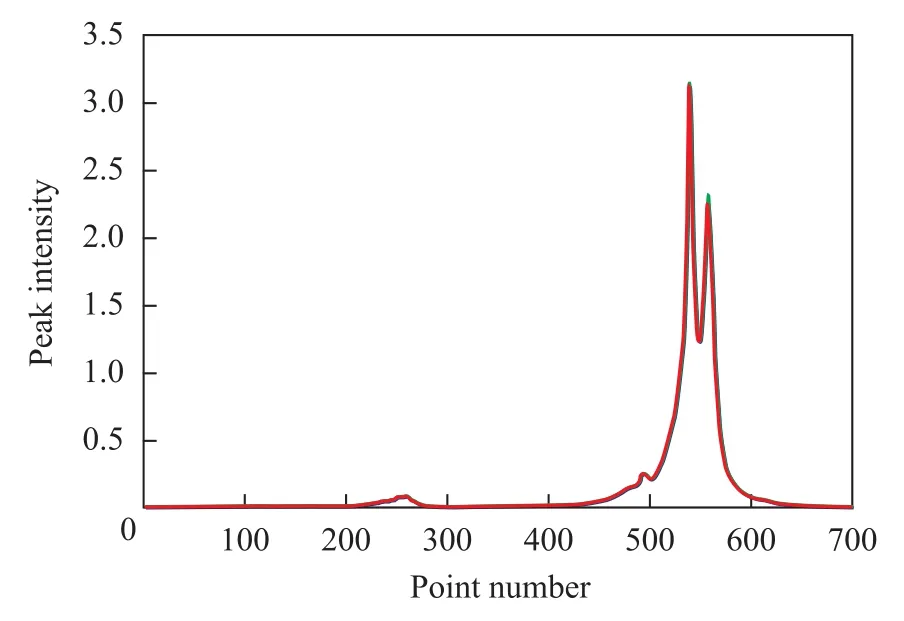
It can be seen from Table 2 that for the light crude oil A, its viscosity is low and remains almost the same at different temperatures. Hence, a high resolution of the spectra can be obtained, as shown in Figure 2. As it is expected, the light oil samples showed little change in their properties measured at different preheating temperatures. In addition, an extended preheating time also did not impose any effect on the resolution of spectra. However, for the heavy crude oil B which showed a great diversity of viscosity values at different temperatures, the change in its various property items could be obviously detected in Table 2. In comparison with the standard deviation (SD) values of the light oil samples, the SD values of heavy oil samples were much greater. It can be inferred that the viscosity of crude oil samples has a great influence on the resolution of spectra.

Table 2 Predicted properties vs preheating temperatures of light crude oils
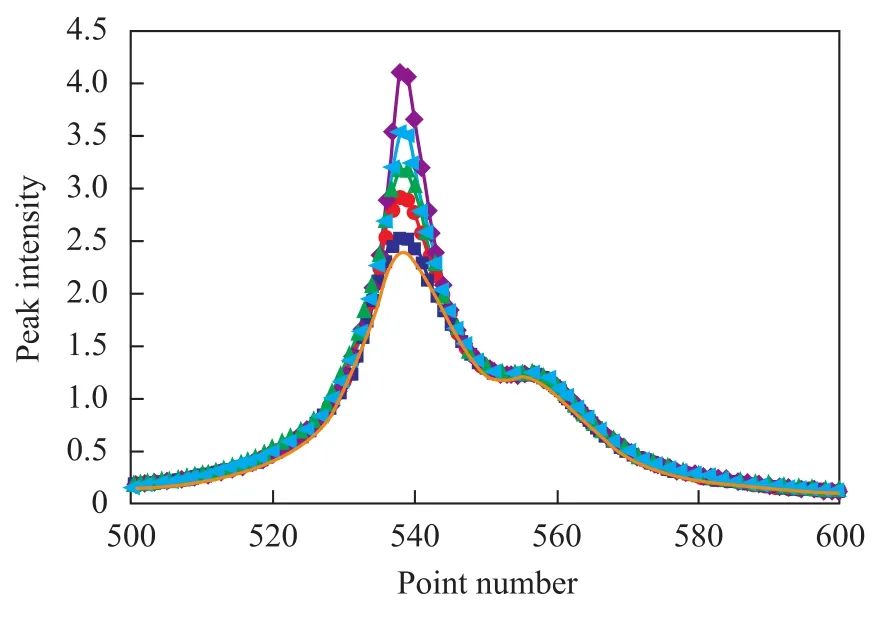
For the heavy crude oil samples, the resolution of spectra was different depending on the preheating temperatures as shown in Figure 3. The resolution of spectra was improved at high temperatures. Therefore it is necessary for the on-line NMR process to add preheating devices to reduce the viscosity of the oil samples.
For the case of the crude oil A, its viscosity value is almost the same at different temperatures. At 20 ℃, 40 ℃, and 50 ℃, the viscosity value is 4.68, 3.45, and 3.02 mm2/s, respectively.
For the case of the crude oil B, its viscosity value shows obvious changes at different temperatures. At 20 ℃, 40 ℃, and 50 ℃, the viscosity value is 103.50 mm2/s, 45.84 mm2/s, and 32.67 mm2/s, respectively.

Figure 2 The spectra of a light oil sample at different temperatures

Figure 3 The spectra of a heavy oil sample at various temperatures
3.3 Effects of metal content on repeatability of measurements
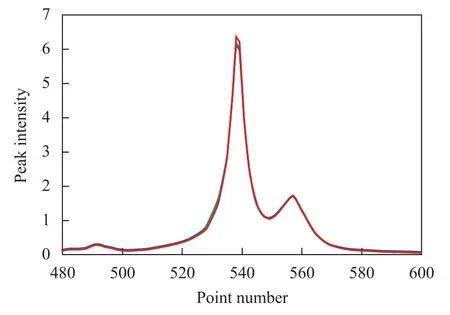
The factors influencing the repeatability of measurements include the metal content, the wax content, the preheating temperature, etc. The metal content in the oil samples plays a key role in the repeatability of the spectral analysis. In Figure 4, the broadened spectra were obtained by scanning the sample directly, which showed a poor repeatability of measurements. In order to make a comparison, after a short moment of settling, the top oil fraction of the sample in the tube was transferred to a new tube. Figure 5 shows the new spectra by scanning the top oil fraction of the sample. It can be seen that there was obviously a difference between the two spectrograms presented in Figure 4 and Figure 5.
In order to compare the difference of metal content in the two oil samples, the metal content in the sample was determined according to the ASTM D5708 method. It can be discovered that the metal content of the crude oil, for example, the content of Fe and Ni, was obviously more than that of the top oil fraction. In Figure 5, the repeatability for the spectral analysis of the top oil fraction was improved. It is supposed that the higher metal content in the crude oil can affect the stability of the magnetic field. To verify that the metals can influence the magnetic stability, two different iron compounds, viz.: iron naphthenate solution and iron powder, were added into the crude oil sample. Each oil sample was scanned three times and the predictions of different property items were obtained by the model. The standard deviation (SD) related with the predictions on three oil property items are listed in Table 3. It can be seen from the results depicted in Table 3 that the values of SD for crude oil samples blended with iron compounds were significantly higher than that of the crude oil sample without addition of iron compounds, indicating that the Fe content had a definite effect on the repeatability of measurements. That is why the on-line NMR process should add a filter unit to prevent too many impurities (including the metals in particular) from entering the analyzer.

Figure 4 The repeatability of analysis achieved by scanning the crude oil for four times

Figure 5 The repeatability of analysis achieved by scanning the top crude oil fraction for four times

Table 3 Standard deviation on repeatability of measurements of different crude oil sample
3.4 Effects of wax content on repeatability of measurements
Another factor that can influence the repeatability of measurements is the wax content in the crude oil samples. The wax fraction is a mixture of long chain hydrocarbons with carbon numbers ranging from 18 to 65. Wax has low solubility in crude oil and can crystallize at low temperatures.
There are two cases leading to wax crystallization. In the case of oil samples having high wax content, whenthe temperature decreases, the crystals of high melting point hydrocarbons would continuously appear, and then build up to form the crystal skeleton, while concurrently sealing the liquid oil into the skeleton, which is called a solidification structure. Finally the oil sample would lose its mobility. In another case in which the oil molecules are composed of more ring structure, when the temperature decreases, the oil sample with less wax content will have a high viscosity at lower temperature even if no wax crystallization occurs. For this reason, the oil sample will also lose its mobility, although the product is still transparent, which is the so-called phenomenon of viscositytemperature solidification. These behaviors have also been reported in the literature.[25-26]Owing to the different wax contents in oil samples, the crystallization conditions cannot be controlled. These facts lead to the difference in oil mobility, which can further affect the repeatability of measurements.
In Table 4, there are several oil samples with high wax content. Although the density of these oil samples was lower, the resolution of analytical instrument was poor at low temperatures. At a preheating temperature of 120 ℃, the repeatability of measurements was investigated by scanning the sample four times. The repeatability of the spectral analysis was poor as evidenced by Figure 6. It can be inferred that in the process of determination, the wax in the oil sample began to crystallize. So that these samples with high wax content could not be analyzed using the low field NMR analyzer.

Table 4 The properties of samp

Figure 6 The repeatability of measurements by scanning the sample for four times
4 Conclusions
In this study, a robust calibration model was established by the PLS algorithm using 255 crude oil samples. Main factors influencing the measurements by means of the off-line low-field1H NMR in the lab were discussed. In order to ensure that all samples were fed into the analyzer in an entirely liquid form, the preheating operation was performed by a water bath device. The preheating temperature had a great influence on the viscosity of oil samples and the resolution of spectral analysis. However, for the case of light oil with lower viscosity, there was little change in the property items of oil samples obtained at different preheating temperatures so that a high resolution of the spectral analysis could be achieved. On the contrary, for the case of heavy crudes featuring a larger diversity of viscosity values, the changes in spectrograms obviously varied with the preheating temperature of oil sample, with the resolution of analytical instrument following the same trend. The repeatability of spectral measurements was impacted by the metal and wax content of the oil samples. For the case of high wax content oils, the wax species began to crystallize in the course of determination that could affect the repeatability of spectral measurements. These factors have evidenced why the preheating devices and filter unit are necessary when low field NMR system is used in the online analysis process. The investigation is very important for the on-line application of the low field NMR.
Acknowledgement:The authors sincerely thank the financial support from the SINOPEC (ST 13028).
[1] Masili A, Pulighe du S, Sassu L, et al. Prediction of physical-chemical properties of crude oils by1H NMR analysis of neat samples and chemometrics[J]. Magn Reson Chem, 2012, 50(1): 729-738
[2] Silva S L, Silva Artur M S, Ribeiro J C, et al. Chromatographic and spectroscopic analysis of heavy crude oil mix-tures with emphasis in nuclear magnetic resonance spectroscopy: A review[J]. Anal Chim Acta, 2011, 707: 18-37
[3] Gudjonsdottir M, Belton P S, Webb G A. Magnetic Resonance in Food Science: Challenges in A Changing World[M]. Cambridge: Royal Society of Chemistry, 2009
[4] Marcon M F, Wang S N, Albabish W, et al. Diverse foodbased applications of nuclear magnetic resonance (NMR) technology[J]. Food Research International, 2013, 51: 729-747
[5] Geya Y, Kimura T, Fujisaki H, et al. Longitudinal NMR parameter measurements of Japanese pear fruit during the growing process using a mobile magnetic resonance imaging system[J]. Journal of Magnetic Resonance, 2013, 226: 45-51
[6] Burri J, Crockett R, Hany R, et al. Gasoline composition determined by1H NMR spectroscopy[J]. Fuel, 2004, 83 (1): 87-193
[7] Monteiro M R, Ambrozin A R P, Liao L M, et al. Study of Brazilian gasoline quality using hydrogen nuclear magnetic resonance (1H NMR) spectroscopy and chemometrics[J]. Energy & Fuels, 2009, 23 (1): 272-279
[8] Spraul M, Hofmann M, Dvortsak P, et al. Liquid chromatography coupled with high-field proton NMR for profiling human urine for endogenous compounds and drug metabolites[J]. J Pharm Biomed Anal, 1992, 10 (8): 601-605
[9] Malet-Martino M, Holzgrabe U. NMR techniques in biomedical and pharmaceutical analysis[J]. Journal of Pharmaceutical and Biomedical Analysis, 2011, 55: 1-15
[10] Dalitz F, Steiwand A, Raffelt K.1H NMR techniques for characterization of water content and viscosity of fast pyrolysis oils[J]. Energy & Fuels, 2012, 26: 5274-5280
[12] Flumignan D L, Sequinel R, Hatanaka R R. Carbon nuclear magnetic resonance spectroscopic profiles coupled to partial least-squares multivariate regression for prediction of several physicochemical parameters of Brazilian commercial gasoline [J]. Energy & Fuel, 2012, 26 (9): 5711-5718
[13] Sanchez-Minero F, Ancheyta J, Silva-Oliver G, et al. Predicting SARA composition of crude oil by means of NMR[J]. Fuel, 2013, 110: 318-321
[14] Trejo F, Centeno G, Ancheyta J. Precipitation, fractionation and characterization of asphaltenes from heavy and light crude oils[J]. Fuel, 2004, 83: 2169-2175
[15] Barbosa L L, Kock F V C, Silva R C. Application of low field NMR for the determination of physical properties of petroleum fractions[J]. Energy & Fuel, 2013, 27: 673-679
[16] Dalitz F, Cudaj M, Maiwald M, et al. Process and reaction monitoring by low-field NMR spectroscopy[J]. Progress in Nuclear Magnetic Resonance Spectroscopy, 2012, 60: 52-70
[17] Nordon A, McGill C A, Littlejohn D. Process NMR spectrometry[J]. Analyst, 2001, 126: 260-272
[18] Blümich B, Casanova F, Appelt S. NMR at low magnetic fields[J]. Chemical Physics Letters, 2009, 477: 231-240
[19] Dalitz F, Maiwald M, Guthausen G. Considerations on the design of flow cells in by-pass systems for process analytical applications and its influence on the flow profile using NMR and CFD[J]. Chemical Engineering Science, 2012, 75: 318-326
[20] Bakeev K. Process Analytical Technology[M]. 2nd ed., USA: John Wiley & Sons, Ltd., 2010
[21] Giammatteo P, Edwards J. Reliable refinery control using process NMR[J]. Control, 1999, 6: 71-74
[22] Corrado L, Roobottom L J, Palmer L D. Application of magnetic resonance analysis (MRA) for the production of clean fuels. Presented at Chemeca 2005[C]. Brisbane, 2005
[23] Li J Y, Chu X L, Tian S B, et al. Research on determination of nitrogen content in petroleum using mid-infrared spectroscopy[J]. China Petroleum Processing and Petrochemical Technology, 2011, 13(4): 1-7
[24] Li J Y, Chu X L, Tian S B. Research on determination of total acid number of petroleum using mid-infrared attenuated total reflection spectroscopy[J]. Energy & Fuel, 2012, 26(19): 5633-5637
[25] Valinejad R, Solaimany Nazar A R. An experimental design approach for investigating the effects of operating factors on the wax deposition in pipelines[J]. Fuel, 2013, 106: 843-850
[26] Robustillo M D, Coto B, Martos C. Assessment of different methods to determine the total wax content of crude oils[J]. Energy & Fuel, 2012, 26: 6352-6357
Recieved date: 2014-02-14; Accepted date: 2014-04-16.
Prof. Tian Songbai, Telephone: +86-10-82368081; E-mail: tiansb.ripp@sinopec.com.
- 中国炼油与石油化工的其它文章
- Research on New Silica Sol Matrix Used in Fluid Catalytic Cracking Reaction
- Synthesis of PE with Broad MWD Catalyzed by Supported Ziegler-Natta Catalyst Consisting of Cycloalkoxy Silane as IED
- Experimental Study on Liquid-Liquid Equilibria of Alcohol- Ester-Water-CaCl2System
- Study on Relationship between Microstructure of Active Phase and HDS Performance of Sulfided Ni-Mo Catalysts: Effect of Metal Loading
- Friction Characteristics of Space Lubricating Oil No. 4129 in Rolling and Sliding Contact
- Research on Hydrolysis and Saccharification of Corn Stover

