Comparison on serum biomarkers for anovulatory and ovulatory dysfunctional uterine bleeding in Lizu females
Shan Bao, Shu-Ying Yang, Zhuo-Ri Li, Ge-Bo Wen
1Department of Endocrinology, The First Affiliated Hospital, University of South China, Hengyang 421001, China
2Department of Gynecology and Obstetrics, Hainan Provincial People's Hospital, Haikou 570311, China
3Department of Surgery, Hainan Provincial People's Hospital, Haikou 570311, China
Comparison on serum biomarkers for anovulatory and ovulatory dysfunctional uterine bleeding in Lizu females
Shan Bao1,2, Shu-Ying Yang2, Zhuo-Ri Li3, Ge-Bo Wen1*
1Department of Endocrinology, The First Affiliated Hospital, University of South China, Hengyang 421001, China
2Department of Gynecology and Obstetrics, Hainan Provincial People's Hospital, Haikou 570311, China
3Department of Surgery, Hainan Provincial People's Hospital, Haikou 570311, China
Objective: To screen, identify, and compare the serum biomarkers between anovulatory dysfunctional uterine bleeding (ADUB) and ovulatory dysfunctional uterine bleeding (ODUB) in Lizu females. Methods: The subjects included 128 ADUB patients, 63 ODUB patients, and 93 controls. The serum and supernate of the subjects’ mense were collected and stored at -80 °C until use. Differential proteins in the sera of three groups were screened using surface-enhanced laser desorption ionization time-of-flight mass spectrometry. The screened proteins were then identified by tricine-SDS-PAGE gel and spectrometry. Protein expression levels in the menses of ADUB, ODUB, and control subjects were determined using ELISA, RT-PCR, and Western blotting. SPSS 14.1 was used for statistical analysis and chart drawing(α = 0.05). Results: Three differential protein peaks with peak values of 11.80, 13.59, and 14.68 km/z were screened and identified as serum amyploid protein A (SAA), vascular endothelial growth factor, and vitamin K epoxide reductase, respectively. The SAA was highly expressed in the menses of ADUB and ODUB patients but poorly expressed in the controls. The vascular endothelial growth factor was highly expressed in the menses of ODUB and controls but poorly expressed in ADUB patients. Meanwhile, the vitamin K epoxide reductase was highly expressed in the menses of ADUB and control subjects but poorly expressed in ODUB patients. Conclusions: The SAA is the common serum biomarker of ADUB and ODUB. ADUB may be related to angiogenesis impairment, whereas ODUB may be associated with blood coagulation disruption.
ARTICLE INFO
Article history:
Received 10 October 2013
Received in revised form 15 December 2013
Accepted 15 January 2014
Available online 20 February 2014
Anovulatory dysfunctional uterine bleeding
Biomarker
Serum amyploid protein A
Vascular endothelia growth factor
Vitamin K epoxide reductase
1. Introduction
Dysfunctional uterine bleeding (DUB) includes anovulatory dysfunctional uterine bleeding (ADUB) and ovulatory dysfunctional uterine bleeding (ODUB). The mechanisms underlying ADUB and ODUB remain unclear. Therefore, although the current clinical practice based on the age, medical history, and menstrual history of the patients, as well as on ultrasound and other tests have facilitated the diagnosis of ADUB and ODUB, a number of difficulties are still encountered during early differential diagnosis. The development of proteomics technology provides an opportunity as well as possibilities for early screening and diagnosis of ADUB and ODUB. Preliminary studies successfully screened and identified two serum protein markers, namely, serum amyploid protein (SAA) and vascular endothelial growth factor (VEGF) associated with ADUB. SAA expression is upregulated in ADUB patients, whereas VEGF expression is downregulated[1]. In this study, the serum protein markers were screened by using surfaceenhanced laser desorption ionization time-of-flight mass spectrometry (SELDI-TOF-MS) and compared between ADUB and ODUB patients.
2. Materials and methods
2.1. Materials
Monoclonal mouse antibodies, including anti-SAA, anti-VEGF, anti-vitamin K epoxide reductase (VKOR), and antiβ-actin, were obtained from Rockland (Gilbertsville, USA). A ReverAidTMFirst-strand cDNA synthesis kit and Master Mix were purchased from Promega (Peking, China). SAA, VEGF, and VKOR ELISA kits were purchased from Aquatic Diagnostics Ltd (Stirling, USA). A PBS IIC protein chip meter reader was purchased from Ciphergen Biosystems, Inc. A Q-STAR4000 mass spectrometer was purchased from ABI Researcher (New York, USA). A Powerbook 2000 scanner was purchased from Umax (USA). The primers were designed and synthesized by Songon Biotech (Shanghai, China).
2.2. Study subjects
The study subjects, Lizu females, included 128 ADUB patients, 63 ODUB patients, and 93 healthy women, with average ages of (41.83±3.85), (40.66±3.13), and (41.54±3.76) years, respectively. The patients were either inpatients or outpatients in Hainan Provincial People’s Hospital from January 2008 to October 2008. Moreover, no subjects were diagnosed with any other diseases.
2.3. Sample collection and processing
Blood samples (5 mL) were collected during menstrual period, mixed with anticoagulants, sterilized, and then allowed to stand for 1 h at room temperature. Afterward, the samples were centrifuged at 12 000 r/min for 30 min at 4 °C. Sera were collected, packaged, and stored at -80 °C for future use. Another set of 5 mL menstrual blood specimens were collected, mixed with anticoagulants, sterilized, and then allowed to stand for 20 min at room temperature. Afterward, the samples were centrifuged at 2 000 r/min for 30 min at 4 °C. Sera were collected, and the supernates were packaged and stored at -80 °C until use.
2.4. Protein chip assay and protein spectrum analysis
A CM10 protein chip was used to reduce experimental error. All samples were simultaneously subjected to SELDI detection and analysis. Protein spectra were normalized after treatment, and the Biomarker WizardTM3.2 software was used for analysis. The parameters are as follows: peak signal-to-noise ratio of 5, minimum frequency threshold of 10%, cluster mass deviation of 0.3%, and secondary standard peak valve signal-to-noise ratio of 2.
2.5. Mass spectrometry
The treated sera of an equal volume were subjeted to tricine-SDS-PAGE gel electrophoresis followed by Coomassie blue staining. Then, the differential protein bands were cut and analyzed using a NanoESI source QSTAR Pulsar I mass spectrometer. The proteins were finally identified using peptide-mass fingerprinting and peptide sequence tags. Alignments were performed by using an online database for proteins (http://www.matrixscience.com).
2.6. Western blotting
Protein concentration was determined using a bicinchoninic acid protein assay kit. Proteins were separated in sodium dodecyl sulfate polyacrylamide gel electrophoresis (SDSPAGE) gels (10%) and then transferred to a polyvinylidene difluoride membrane. The membrane was immunoblotted overnight with antibodies to SAA (1:2 000), VEGF (1:2 500), and VOKA (1:1 000) at 4 °C. The corresponding secondary antibody conjugated with peroxidase and enhanced chemiluminence reagents were then added to the protein samples to visualize the targeted antigens. The levels of SAA, VEGF, and VOKA were assessed using the Labwork image analysis software.
2.7. RT-PCR
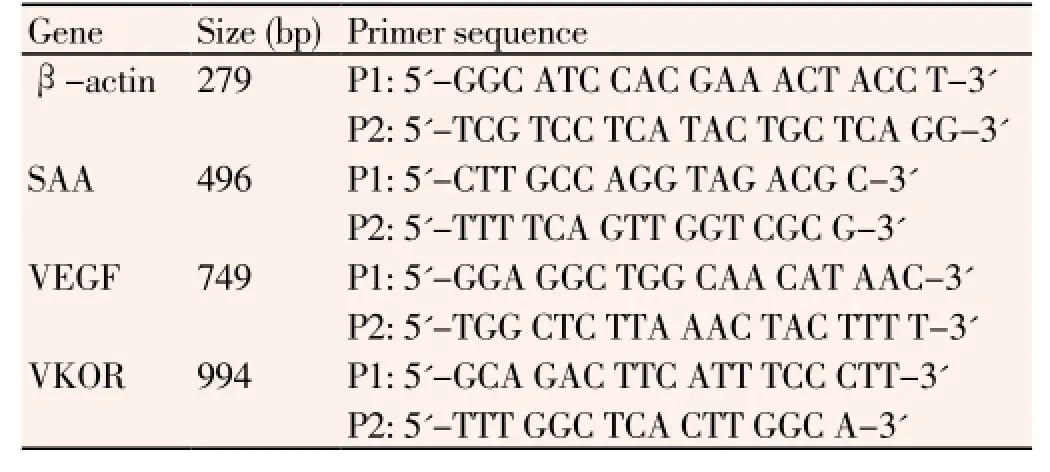
Total RNA was extracted using the TRIzol reagent following manufacturer’s instructions (Invitrogen, USA). Total RNA (1 μg) was reverse-transcribed using a ReverAidTMFirststrand cDNA synthesis kit. Afterward, 2 μg of cDNA was added to the RT-PCR system to evaluate the relative levels of β-actin mRNA. PCR was performed using the primers shown in Table 1. The following PCR conditions were used: 95 °C for 5 min, followed by 30 cycles at 95 °C for 30 s, 56 °C for 20 s, and 72 °C for 40 s, and a final step of 72 °C for 10 min.

Table 1 List of primers for amplification.
2.8. ELISA
The collected sera from different groups were analyzed using SAA, VEGF, and VOKA ELISA kits according to manufacturer’s instructions.
2.9. Statistical analysis
Statistical analysis was performed using ANOVA. The statistical significance of differences between groups was determined using the chi-square test by comparison with the control group using the SPSS 11.0 software (IBM Corporation). Statistical significance was set at the 0.05 level.
3. Results
3.1. Serum marker screening and identification of ADUB and ODUB
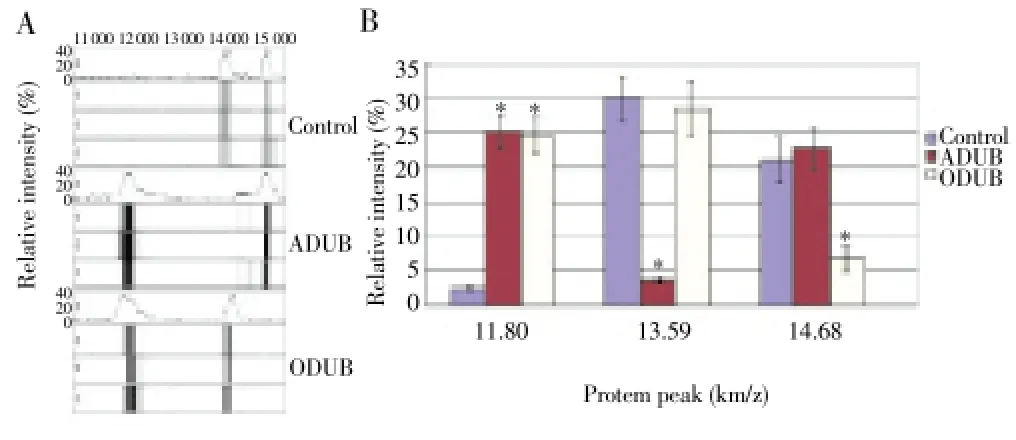
As shown by the SELDI-TOF-MS results (Figure 1), three protein peaks for the ADUB, ODUB, and normal groups showed significant differences. The protein peak intensities [(11.80±1.52) km/z] for ADUB and ODUB were significantly higher than that for the normal groups (P<0.05). The protein peak intensities [(13.59±2.85) km/z] for the ODUB and control groups were increased, compared with that for ADUB (P<0.05). The protein peak intensities [(14.68±3.01) km/z] for the ADUB and control groups also increased compared with that for ODUB (P<0.05).

Figure 1. Comparison on serum biomarkers between ADUB and ODUB using SELDI-TOF-MS.*P<0.05 vs control.
The tricine-SDS-PAGE gel analysis showed two protein bands for the normal menstrual serum sample supernates at approximately 45 and 18 kD. The ADUB serum samples also showed two protein bands at 12 and 18 kD. Furthermore, the protein bands for the ODUB serum samples appeared at approximately 12 and 45 kD. After gel digestion, the 12, 18, and 45 kD protein bands were cut, and mass spectrometry for the menstrual serum sample supernates and global protein (amino acid) alignments were performed online. The 12 kD band was identified as SAA, the 18 kD band as VKOR, and the 45 kD band as VEGF.
3.2. Expression SAA, VKOR, and VEGF in DUB patients
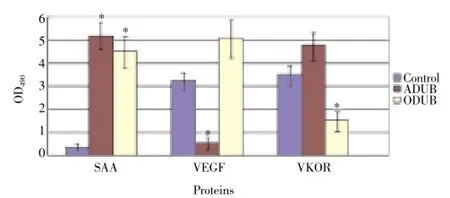
Changes in the mRNA level and protein expression of SAA, VKOR, and VEGF in the DUB patients were determined using ELISA, RT-PCR, and Western blotting. The ELISA results (Figure 2) showed that the SAA levels in the ADUB and ODUB patients increased compared with that in the normal group. Moreover, the VEGF levels decreased in the ADUB patients, whereas the VKOR levels decreased in ODUB patients. The RT-PCR results (Figure 3) theSAAmRNA level in the ADUB and ODUB patients was higher than that in the normal group. TheVEGFmRNA level in the ADUB patients was significantly higher than that of the normal and ODUB groups. TheVKORmRNA level in the ODUB group was significantly lower than that of the normal and ADUB groups. As evidenced by Western blotting, the expression of SAA, VKOR, and VEGF proteins in the ADUB, ODUB, and normal groups (Figure 4) was identical to their mRNA performance.

Figure 2. Expression of SAA, VEGF, and VKOR in patients with ADUB and ODUB.ELISA was used to analyze the protein concentration. *P<0.05 vs control.

Figure 3. RT-PCR analysis of SAA, VEGF, and VKOR in patients with ADUB and ODUB.(M) DNA 5000 marker consisting of segments with different size (5 000, 3 000, 2 000, 1 500, 1 000, 750, 500, 300, and 100 bp). (1-3) Healthy controls; (4-6) ADUB patients; (7-9) ODUB patients.

Figure 4. Western blotting analysis of SAA, VEGF, and VKOR expression in patients with ADUB and ODUB.(1-2) Healthy controls; (3-4) ADUB patients; (5-6) ODUB patients.
4. Discussion
Microarray and serial analyses of gene expression are used to indirectly study gene function at the mRNA level in order to determine the protein gene function. Gene transcription levels do not completely represent the protein expression level because of the poor correlation between mRNA abundance and tissue protein abundance, particularly for low-abundance proteins[2]. Therefore, determination of the pathogenesis of a disease at the protein level can be used to directly elucidate the underlying mechanisms of physiological or pathological conditions. SELDI-TOF-MS is a recently developed high-throughput proteomics research method that does not require the capture of “all” proteins to accurately determine the significant differences in protein levels. In addition, this technique does not damage the protein samples. Thus, complete samples and soluble matrix crystals are used to generate mass signals. The method can also be used for direct spot detection using untreated serum, urine, or tissue extract samples and can therefore be used in a wide range of applications[3-6]. The present study applied SELDI-TOF-MS to screen serum protein markers for DUB. Three different protein peaks were detected and furtheridentified as SAA, VEGF, and VKOR. ELISA, RT-PCR, and Western blotting results confirmed that the SAA expression levels were upregulated in the menstrual samples from the ADUB and ODUB patients, the VEGF expression levels were down-regulated in the menstrual samples from the ADUB patients, and the VKOR levels were down-regulated in the menstrual samples from the ODUB patients. These results suggest that SAA, VEGF, and VKOR are associated with DUB.
The humanSAAgene is located on the short arm of chromosome 11. Normally, the levels of SAA, which is a stress protein, are low in plasma but increases during infection and trauma[7,8]. Numerous studies have reported the potential use of SAA as a marker for cancers[9-11]. Generally, DUB occur for more than 6 months, and SAA would be up-regulated as a result of irregular uterine bleeding for extended periods. However, a number of studies showed that SAA is not associated with stress response. Choet al. found that SAA expression significantly increased in 621 cancer patients without non-immune inflammation[12]. This finding suggests that SAA expression is related to cancers but is not associated with inflammatory responses. Therefore, increased SAA levels could be a cause of uterine bleeding.
Uterine bleeding is closely linked to endometrial repair, which includes epithelial regeneration and angiogenesis. Recent studies have shown that VEGF is involved in the menstrual cycle and functions by regulating the proliferation and migration of endothelial cells and by stimulating neovascularization and repair of the endometrium[13,14]. In abnormal situations (ADUB patients), the VEGF levels significantly decrease when estrogen is inhibited[15]. However, menstrual blood entrainment leads to reduced VEGF, which leads to angiogenesis and repaired endometrium disorders. Meanwhile, VEGF production is at a normal level in ODUB patients, because the luteal phase and ovulation are normal. In this study, the VEGF levels in the menstrual discharges of ADUB patients were lower but were normal in the ODUB patients. This result indicates that angiogenesis disorders of the endometrium are important risk factors of ADUB.
Vitamin K (VK), a key factor of the body for thromboplastin, functions as a carboxylase cofactor that stimulates the conversion of glutamic acid residues to γ carboxyl acids and acts in combination with Ca2+to promote blood clotting. Vitamin K2, a 3-epoxide of VK, depends on VKOR for transformation into VK. The humanVKORgene is located on chromosomes 10 and 12. Its coding DNA sequence gene has a length of 499 bp and encodes a 163-amino acid protein with a molecular weight of 18 kD. In this study, the VKOR expression levels in ODUB patients were lower than those of the normal and ADUB subjects. Thus, we hypothesize that clotting disorders are a major cause of ODUB.
Conflict of interest statement
We declare that we have no conflict of interest.
Acknowledgments
The work was supported by the Natural Science Foundation of Hainan Province (30633, 812148).
[1] Bao S, Yang S, Wang L. Screening and identification of serum biomarker of anovulatory dysfunctional uterine bleeding and its expression in the menses. Zhong Nan Da Xue Xue Bao Yi Xue Ban 2009; 34: 616-623.
[2] Gygi SP, Rochon Y, Franza BR, Aebersold R. Correlation between protein and mRNA abundance in yeast. Mol Cell Biol 1999; 19: 1720-1730.
[3] Schweigert FJ, Wirth K, Raila J. Characterization of the microheterogeneity of transthyretin in plasma and urine using SELDI-TOF-MS immunoassay. Proteome Sci 2004; 2: 5.
[4] Walker CC, Salinas KA, Harris PS, Wilkinson SS, Watts JD, Hemmer MJ. A proteomic (SELDI-TOF-MS) approach to estrogen agonist screening. Toxicol Sci 2007; 95: 74-81.
[5] Cadron I, Van Gorp T, Amant F, Vergote I, Moerman P, Waelkens E, et al. The use of laser microdissection and SELDI-TOF MS in ovarian cancer tissue to identify protein profiles. Anticancer Res 2009; 29: 1039-1045.
[6] Wegdam W, Moerland PD, Meijer D, de Jong SM, Hoefsloot HC, Kenter GG, et al. A critical assessment of SELDI-TOF-MS for biomarker discovery in serum and tissue of patients with an ovarian mass. Proteome Sci 2012; 10: 45.
[7] Perry ME, Stirling A, Hunter JA. Effect of etanercept on serum amyloid A protein (SAA) levels in patients with AA amyloidosis complicating inflammatory arthritis. Clin Rheumatol 2008; 27: 923-925.
[8] Li G, Ren F, Yao J, Wang M, Feng X, Liu D. Human serum amyloid A (SAA) protein changes in acute epilepsy patients. Int J Neurosci 2013; 123: 265-268.
[9] Zhang G, Sun X, Lv H, Yang X, Kang X. Serum amyloid A: A new potential serum marker correlated with the stage of breast cancer. Oncol Lett 2012; 3: 940-944.
[10] Fischer K, Theil G, Hoda R, Fornara P. Serum amyloid A: a biomarker for renal cancer. Anticancer Res 2012; 32: 1801-1804.
[11] Moshkovskii SA, Vlasova MA, Pyatnitskiy MA, Tikhonova OV, Safarova MR, Makarov OV, et al. Acute phase serum amyloid A in ovarian cancer as an important component of proteome diagnostic profiling. Proteomics Clin Appl 2007; 1: 107-117.
[12] Cho WC, Yip TT, Cheng WW, Au JS. Serum amyloid A is elevated in the serum of lung cancer patients with poor prognosis. Br J Cancer 2010; 102: 1731-1735.
[13] Benoy I, Vermeulen P, Wuyts H, Dirix L. Vascular endothelial cell growth factor (VEGF) serum concentrations change according to the phase of the menstrual cycle. Eur J Cancer 1998; 34: 1298-1299.
[14] Sugino N, Kashida S, Karube-Harada A, Takiguchi S, Kato H. Expression of vascular endothelial growth factor (VEGF) and its receptors in human endometrium throughout the menstrual cycle and in early pregnancy. Reproduction 2002; 123: 379-387.
[15] Xu J, Xiang Q, Lin G, Fu X, Zhou K, Jiang P, et al. Estrogen improved metabolic syndrome through down-regulation of VEGF and HIF-1α to inhibit hypoxia of periaortic and intra-abdominal fat in ovariectomized female rats. Mol Biol Rep 2012; 39: 8177-8185.
*Corresponding author: Ge-Bo Wen, Department of Endocrinology, The First Affiliated Hospital, University of South China, Hengyang 421001, China.
Tel: 86-734-8281340
Fax: 86-734-8284942
E-mail: gb_wen@aliyun.com
Foundation project: The work was supported by the Natural Science Foundation of Hainan Province (30633, 812148).
 Asian Pacific Journal of Tropical Medicine2014年2期
- Asian Pacific Journal of Tropical Medicine的其它文章
- Diagnosis and multi-modality treatment of adult pulmonary plastoma: Analysis of 18 cases and review of literature
- Mathematical modeling for selecting center locations for medical and health supplies reserve in Hainan Province
- Bond strength analysis of the bone cement- stem interface of hip arthroplasties
- Comparative analysis of different cyclosporine A doses on protection after myocardial ischemia/reperfusion injury in rat
- Hepatic effect of NAC on sevear acute pancteatise of rats
- Preparation of novel biodegradable pHEMA hydrogel for a tissue engineering scaffold by microwave-assisted polymerization
