
Maize forage aptitude: Combining ability of inbred lines and stability of hybrids
2014-03-13 05:51:12LuisximoBertoianicaBeatrizAulicino
The Crop Journal 2014年6期
Luis Máximo Bertoia*,Mónica Beatriz Aulicino
aDepartment of Plant Production,Faculty of Agrosciences,National University of Lomas de Zamora,Camino de Cintura km 2,1832 Lomas de Zamora,Buenos Aires,Argentina
bDepartment of Genetics,Faculty of Agrosciences,National University of Lomas de Zamora,Camino de Cintura km 2,1832 Lomas de Zamora,Buenos Aires,Argentina
cSanta Catalina Plant Breeding Institute,National University of La Plata,CC 4,1836 Llavallol,Buenos Aires,Argentina
1.Introduction
Silage maize allows feeding cattle daily throughout the year.It is commonly used as a primary source of energy,is easy to produce and store,and is very well accepted by ruminants.When the whole plant is harvested,ear and stover contribute to the final forage dry matter yield.Therefore,both components must be considered.Since digestibility of plant components varies with genotype,maize quality is determined by plant morphology and architecture.
An important question is which germplasm should be used for breeding programs aimed at forage maize with high digestibility/ingestibility characteristics.Modern inbred lines with the highest digestibility are expected to be the best germplasm[1].Modern maize germplasm has been developed by centuries of empirical improvement for grain,followed by decades of scientific improvement.For economic and genetic reasons,forage maize improvement should combine breeding for grain with breeding for the specific needs of forage hybrids[1].
Tolenaar et al.[2] pointed out that grain maize selection over time has made it possible to improve stability because modern varieties have higher levels of tolerance to stress and diseases than older ones.In fact,thorough selection among various materials has been applied to improve grain production.However,there is still insufficient information on the environmental and genotype response of other plant components,or on yield or quality.
Modern hybrids have proved to have,on average,5.5%lower in vivo cell wall digestibility than older ones,resulting in a 2.0%reduction in dry matter digestibility,despite a tendency to a slight but significant increase in grain content [1].Production stability is an essential property,especially when maize is intended for forage production,because,in general,sowing areas are located in dairy farms near urban centers or other marginal areas that are not ideal agronomic environments for potential yield expression.As a result,low and uneconomic yields may be obtained.For this reason,the selection of forage genotypes should be based on the criteria of genotype × environment interaction (GEI) and stability/adaptability.GEI is a universal phenomenon that arises when different genotypes are evaluated in various environments,as reported in the voluminous literature[3–7].Strong interaction of this kind complicates the selection of superior genotypes and reduces the correlation between genotypic and phenotypic values[8–10],hindering progress in selection[11–13].
The presence of interaction justifies expanding the number of environments for evaluation or predicting the expected variation among environments[14].Grain yield shows significant interaction [15].However,there is no clear information about GEI variance for forage traits.Multivariate techniques are most appropriate for explaining the multidimensional nature of this interaction [16,17].One such is the additive main effects and multiplicative interaction model (AMMI)[12,18,19].It is a methodology that combines ANOVA for the evaluation of genotype and environment additive effects with interaction principal component analysis (IPCA).Biplots [20]are graphical representations of interactions that are highly recommended when there is a qualitative interaction [21,22].Biplots also allow simultaneous graphs of additive effects of genotypes and environments versus GEI and the estimation of stability parameters [23,24].Gauch and Zobel [18,19] developed a predictive methodology for selecting the best AMMI model.
The success of forage breeding programs depends not only on the amount of genetic variation present in the germplasm but also on the extent to which it is heritable.Knowledge of heritability influences the choice of selection procedures[25].The estimation of additive and epistatic gene effects is a prerequisite for effective improvement.The existence of a heterotic pattern,“Reid-BSSS × flint”,has been demonstrated for ear yield(EY)and harvest index(HI)[26].However,General Combining Ability(GCA)exceeded Specific Combining Ability(SCA) in flint × dent crosses with respect to qualitative and quantitative forage traits[26,27].Thus,additive gene action for whole plant dry matter yield was shown when two dent populations were crossed [28].With respect to maize vegetative components,crosses between divergence heterotic groups reduced SCA effects and increased additive ones[29].
The objectives of the present study were:(i)to quantify the effects of the environmental and genetic variation and their interaction on stover yield,ear yield and digestibility traits that determine forage aptitude; (ii) to identify inbred lines suitable for inclusion in the development of hybrids with forage aptitude and (iii) to differentiate inbred lines based on the response of their derived hybrids to environmental changes.
2.Materials and methods
2.1.Plant material
We selected ten maize inbred lines that represent a wide range of racial origins,maturity,and grain type (Table 1).Forty-five hybrids from diallelic crosses without reciprocals generated by the ten inbred lines and three commercial hybrids(Checks) with outstanding forage aptitude were evaluated:4-F-37(Check 1),369(Check 2)and SD5(Check 3).

Table 1-Number,source,Food and Agriculture Organization of the United Nations(FAO)maturity,and grain type of ten inbred lines included in the diallelic crosses.
2.2.Design of the experiment and traits
Thirty ears of each cross were harvested and trials were conducted for two years in sites located in the dairy region near Buenos Aires:San Vicente(SV,35°24′S,58°30′W),Vicente Casares (VC,35°18′S,58°56′W) and Esteban Echeverría (EE,34°38′S,58°48′W).Soil analysis showed typic Argiudolls in San Vicente and Vicente Casares,and Aquic Argiudoll with horizon B2tin Esteban Echeverría.Randomized complete blocks with 3 replications were used as the experimental design.The experimental unit consisted of two rows 5.20 m long and 0.70 m apart and two seeds were planted in each hill.Once the plants reached the V3 stage [30],they were thinned to an approximate density of 71,500 plants ha-1.After sowing,atrazine + metolachlor and carbofuran were applied in all trials.They were then fertilized with 45 kg ha-1of diammonium phosphate at preemergence and with 100 kg ha-1of granulated urea at the V6 stage[30].The harvest time for each experimental unit was determined when 50%of the plants reached the stage of 2/3 of the grain in dough [31].The whole plot with approximately 56 plants was harvested.Yield was determined by weighing each plant component(stover and ears) separately.A representative subsample of each plant fraction was dried at 60 °C to constant weight in a forced-air oven to estimate dry weight and then to calculate dry matter content.The dry matter yield was measured on ear(EY) and stover (SY) bases,both contributing to whole-plant dry matter yield (WY).The dried samples of both plant components were ground to pass a 1 mm screen in a mill(Fritsch Co.,Germany).Near infrared reflectance spectroscopy(NIRS)was used for forage quality determinations using a NIRS 6500 Foss (Foss NIRS Systems Inc.,Silver Spring,MD,USA),to collect the spectra of the ground samples in mini-dishes(100 mm × 60 mm).NIRS calibration equations were determined using a subset of ear and stover samples previously analyzed by routine laboratory methods.For NIRS calibration,all data were analyzed using a partial least squares method.As suggested by Shenk and Westhaus [32],the criteria used to select prediction equations were the maximization of the coefficient of determination (r2) and the minimization of the standard error of calibration.Then cross validation and the guidelines of [32] were applied.An enzymatic technique (pepsin–cellulase) was used to determine in vitro dry matter digestibility.Samples were incubated in pepsin (in 0.1 mol L-1HCl,39.5 °C) for 24 h [33] and then in cellulase preparations from Trichoderma viridae at 39.5 °C[34]for 48 h.A treatment for starch hydrolysis at high temperature digestion (80 °C) for 45 min was included and performed in a Daisy II incubator,Ankom technology Corp.,Fairport,NY,USA.
The digestible whole-plant dry matter yield(DWY),expressed in Mg ha-1,was calculated as follows:
DWY= [(EY×ED)+(SY×SD)]100-1,
where EY denotes ear yield in Mg ha-1,ED ear digestibility in%,SY stover yield in Mg ha-1,and SD stover digestibility in Mg ha-1.
Whole-plant digestibility (WD),expressed in %,was determined as
WD= (D WY/WY)×100,
where WY denotes whole-plant yield in Mg ha-1.
2.3.Statistical analysis
Data were analyzed with a combined ANOVA that included environment,genotype (hybrids and checks) and their interaction as sources of variation.Environment or year–location combination was treated as a random effect,whereas genotype was treated as a fixed effect.A mixed model was fitted according to[35]and significance was assigned at the 0.05 level of probability.When effects were statistically significant,multiple comparisons were made using Fisher's protected LSD (t5%).Balanced data were analyzed using SAS [36].The combined model was
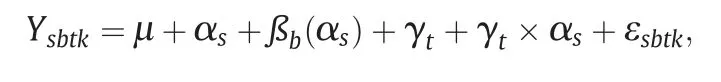
where Ysbtkrepresents the observed value from each experimental unit,μ the population mean,αsthe site effect;ßb(αs)the effect of replication b nested in sites,γtthe F1hybrid effect,γt× αsthe interaction effect between hybrid and sites,and εsbtka random residual effect.
Griffing method IV[37]was used to analyze GCA and SCA,and GENES Software for Windows (GENES) [38] to estimate GCA and SCA effects and their interactions with sites.
Genetic and phenotypic correlations between all traits were estimated[25].Patterns of genetic and phenotypic correlation were compared using the Pearson product–moment correlation and the t-Mantel test[39].
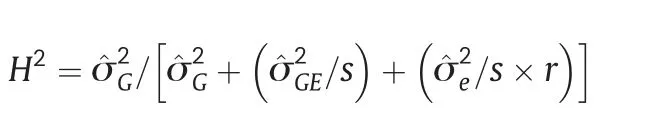
Phenotypic variance components were estimated from the expected mean squares.Broad-sense heritability was calculated as suggested by[40]:
Variables that presented significant GEI were analyzed by the additive main effects and multiplicative interactions model(AMMI)[12].This methodology is based on the fitting of the additive effects model (G and E) using the analysis of variance and the multiplicative effects of GEI through the interaction principal component analysis(IPCA)as
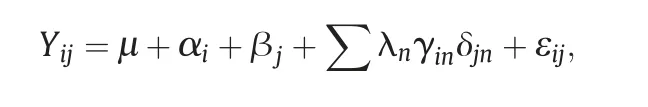
where Yij: is the cell mean of the ith genotype in the jth environment.The additive effects are as follows: μ is the overall mean,αithe effect of the ith genotype,and βjthe effect of the jth environment.The multiplicative parameters are as follows: λnis the eigenvalue for the nth interaction principal component(IPC),the interaction parameters γinand δjnare the elements of the nth eigenvector for genotypes and environments,respectively,and εijis the residual,which includes the residual interaction not accounted for the multiplicative terms and the experimental error variance.
Multiplicative formulations were used to calculate the coordinates of the genotypic and environmental.Each eigenvalue square root is multiplied by its own eigenvectorandto estimate the interaction of a given genotype in any environment.Thus,a data matrix is created to estimate the interaction using AMMI.The number of possible axes that the model can retain is min (g-1,s-1).Normally,the number of axes retained in the model is smaller,producing a reduced model called AMMI1.In contrast,it is AMMI2 when it retains two axes of the IPCA.Finally,after the additive main effects of sites and genotypes are fitted,a reduced model leaves a residual ξij[20].
For the predictive approach,cross-validation was applied to obtain a reduced model using Matmodel software[41].Data were split into two subgroups,with two replicates for modeling and two for validation.For each variable,the model with the lowest root mean square predictive difference(RMSPD)was selected as the best predictive model.Predicted values were based on 999 runs and a total of 287,712 validations [41,42].Biplots were constructed according to[43]only for variables that retained an optimal number of IPC axes after cross validation.
First IPC(IPC1)scores of genotypes and environments are a direct measurement of stability [12].The stability value can be graphically calculated when the genotype or environment scores are projected on the IPC1(biplot y ordinate).
3.Results
3.1.Analysis of variation
Combined analysis revealed a higher statistical significance for environment for all variables.Genotypes were divided into crosses (F1),checks,and the comparison between these two sources(F1vs.Checks).Checks differed for four variables:SY,WY,WD,and DWY.Although the checks showed nonsignificant differences for EY,HI,and variables related to quality (ED and SD),differences appeared for WD.Differences between crosses (F1s) were shown for the ear traits: EY and HI and for the forage traits: SY,WY,WD,and DWY.The response for the crosses (F1) was similar to that for the genotypes(F1+ Checks).Quality traits(ED and SD)showed non-significant differences for all sources of variation except environment and consequently Blocks nested in environments(Blocks/E)for trait SD.The F1sum of squares was also divided into GCA and SCA(Table 2).Except for the above variables (ED and SD),GCA was significant for all variables (Table 2).This response reflects the differential input of the inbred lines under evaluation via their crosses.The SCA analysis showed highly significant differences for all variables except for those associated with quality(SD,ED,and WD).
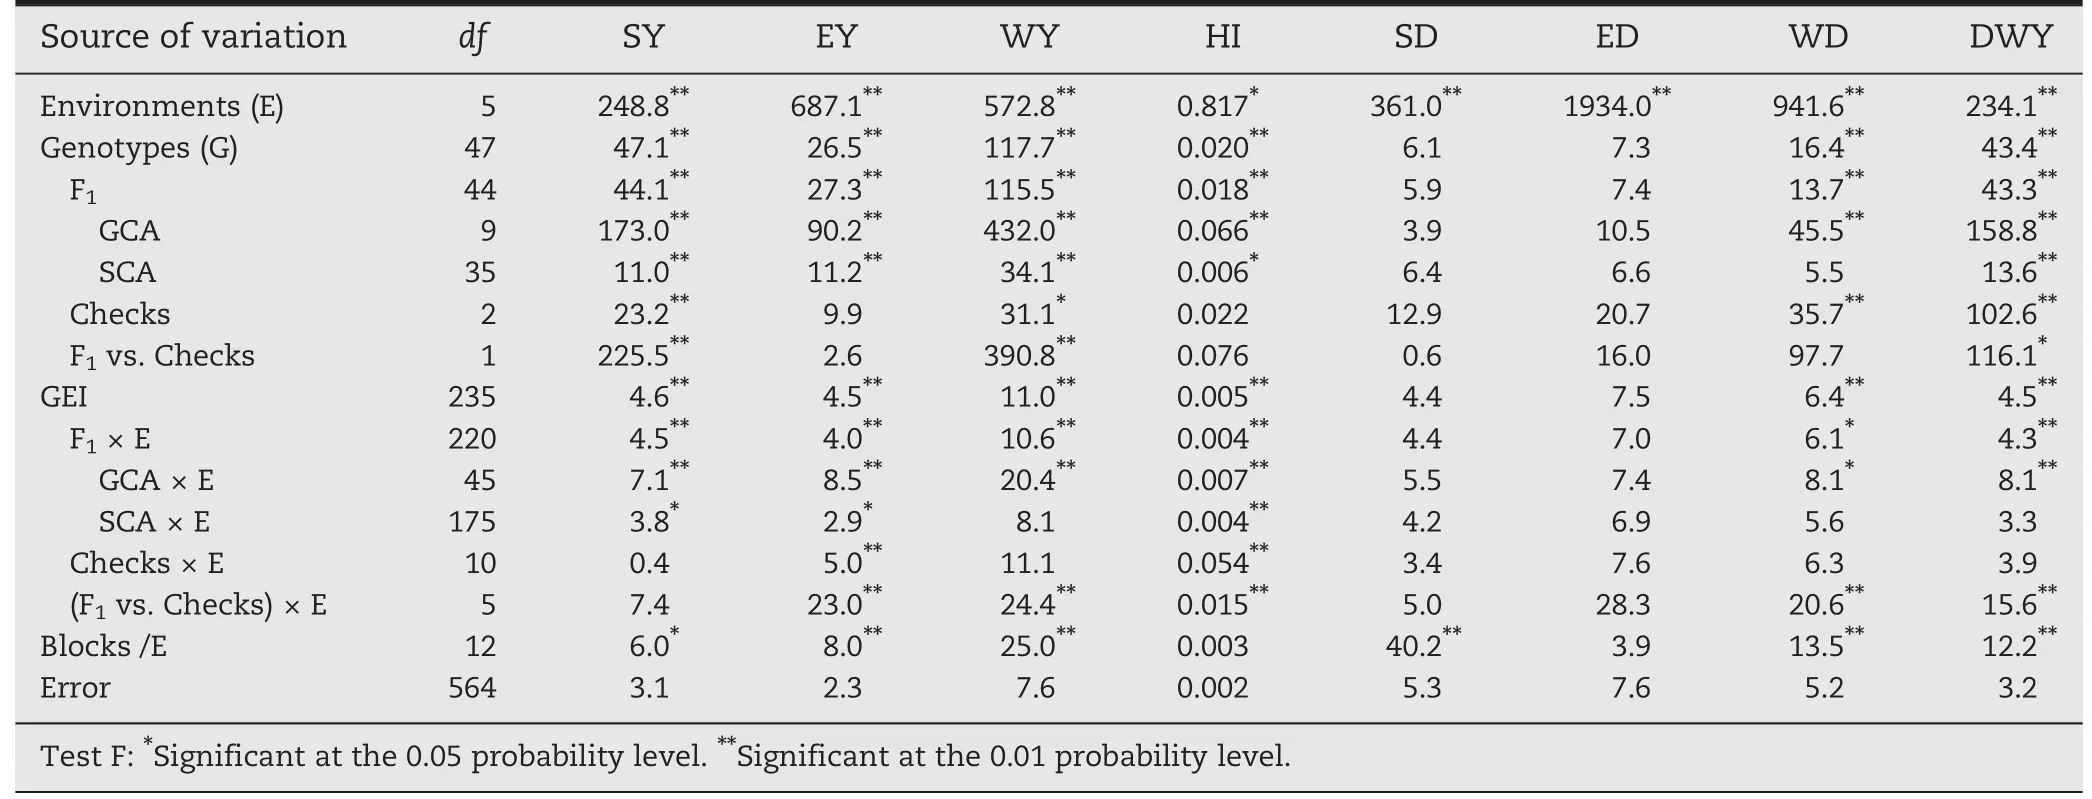
Table 2-Mean squares of combined analysis of variance of six environments,45 F1 hybrids,and three checks for the variable:stover yield(SY),ear yield(EY),whole plant yield(WY),harvest index(HI),stover digestibility(SD),ear digestibility(ED),whole plant digestibility (WD),and digestible whole plant dry matter yield(DWY).
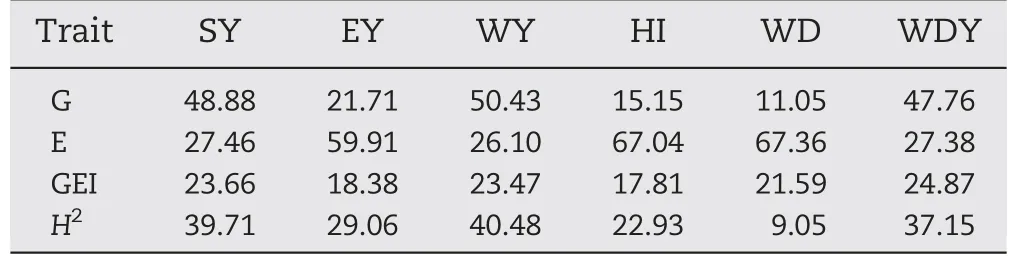
Table 3-Percentage of variation explained by genotype(G),environment(E) effects,genotype × environment interaction(GEI),and heritability(H2)for:stover yield(SY),ear dry yield(EY),whole plant yield(WY),harvest index(HI),whole plant digestibility (WD),and digestible whole plant dry matter yield(WDY).
GEI,F1× E,and GCA × E interactions were significant for all variables except ED and SD.Thus,there were no significant differences of SCA × E for WY,WD,and DWY.Checks × E interaction was significant only for EY and HI,while (F1vs.Checks) × E interactions also showed differences for WY,WD,and WDY(Table 2).
Table 3 shows the percentage of treatment variation explained by each source of variation(G,E,and GEI).Variables associated with grain yield(EY and HI)were mostly influenced by E and GEI.The Environment source of variation explained more than 59.9%of treatment variation for all of the variables with the exception of SY and WY.In contrast,these variables associated with the production of stover and whole plant dry matter showed large genotype effect explaining 48.9% and 50.4%,respectively,of treatment variation(Table 3)whereas GEI explained a low percentage of treatment variation (between 6.2%and 23.7%).

Table 4-Phenotypic correlation coefficients(above diagonal)and genetic correlation(below diagonal) between eight traits measured in six environments:ear yield(EY),stover yield(SY),whole plant yield(WY),harvest index(HI),ear digestibility(ED),stover digestibility(SD),whole plant digestibility(WD),and digestible whole plant dry matter yield(DWY).
Heritabilities tended to be moderate (from 22.9 to 40.5),with the highest values for stover and whole plant traits.The H2for digestibility traits were not calculated,owing to non-significant genetic variances (Table 3).No genetic correlation could be estimated for ED,owing to negative or null genetic variances.
We found no association between ED and SD and other variables,although both were positively correlated with WD(Table 4).WD was significantly correlated with SY,WY,and HI.As expected,WDY,WY,and SY were highly correlated with one another and with the rest of the traits.They were positively associated with EY,but negatively with HI and WD (Table 4).Genetic correlations slightly exceeded phenotypic correlations for any combination of variables.However the Mantel t-test and the Pearson correlation coefficient (t = 5.1049,P <0.01;r = 0.98)showed similarities between both matrices.
3.2.Genotypic effect: GCA and SCA
Some commercial cultivars outperformed the averages of the experimental hybrids for HI,SY,and WD (LSD test,P <0.05).However,check 2 showed the best SY,possibly owing to its longer cycles of life and greater plant height (Table 5,below diagonal),although it showed the lowest average of WD and HI.Hybrids ZN6 × B84,P465 × B84,B84 × P21,and B84 × L256 performed very well for EY (Table 6).Hybrids PR4 × B84,PR4 × ZN6,PR4 × A632,ZN6 × B84,and B84 × P21 showed high performance for both SY and WY (Tables 5 and 7).Hybrids ZN6 × L256 and P465 × B84 showed the highest WD(Table 8).Hybrid PR1 × Mo17 had higher HI than PR4 × A632,PR4 × P21,PR4 × ZN6,and P21 × L256.
GCA was responsible for the greatest part of the F1variation.Although ANOVA showed significant effects of GCA and SCA,Student's t-test(at 5%)identified no outstanding combination of ED,SD,WD,and HI.Accordingly,the results of GCA and SCA analysis are presented only for traits SY,EY,WY,and WDY.
For trait SY,lines PR4,ZN6,P465,B84,and P21 showed positive GCA,although only the value of line PR4 proved significant (Table 5).Significant and negative values of SCA were found for ZN6 × PR1 and ZN6 × PR2,indicating that these crosses resulted in poorly performing hybrids.
Only B84 had significant and positive GCA for EY,and ZN6 × PR1 and ZN6 × PR2 showed significant and negative results for SCA (Table 6).This response is also found in A632 × B84 and P21 × L256.This may be a result of combinations among derivatives of the same heterotic group of parents,BSSS in the first case,and Argentine flint populations in the second.

Table 5-Stover yield (SY).General combining ability (GCA: values on the matrix diagonal,in bold),specific combining ability(SCA:values above the diagonal),means(in Mg ha-1),and standard deviation(values below the diagonal)of 10 maize inbred lines(F:flint,D:dent).

Table 6-Ear yield (EY).General Combining Ability (GCA: values on the matrix diagonal,in bold),Specific Combining Ability (SCA: values above the diagonal),means (in Mg ha-1),and standard deviation (values below the diagonal) of 10 maize inbred lines (F: flint,D: dent).
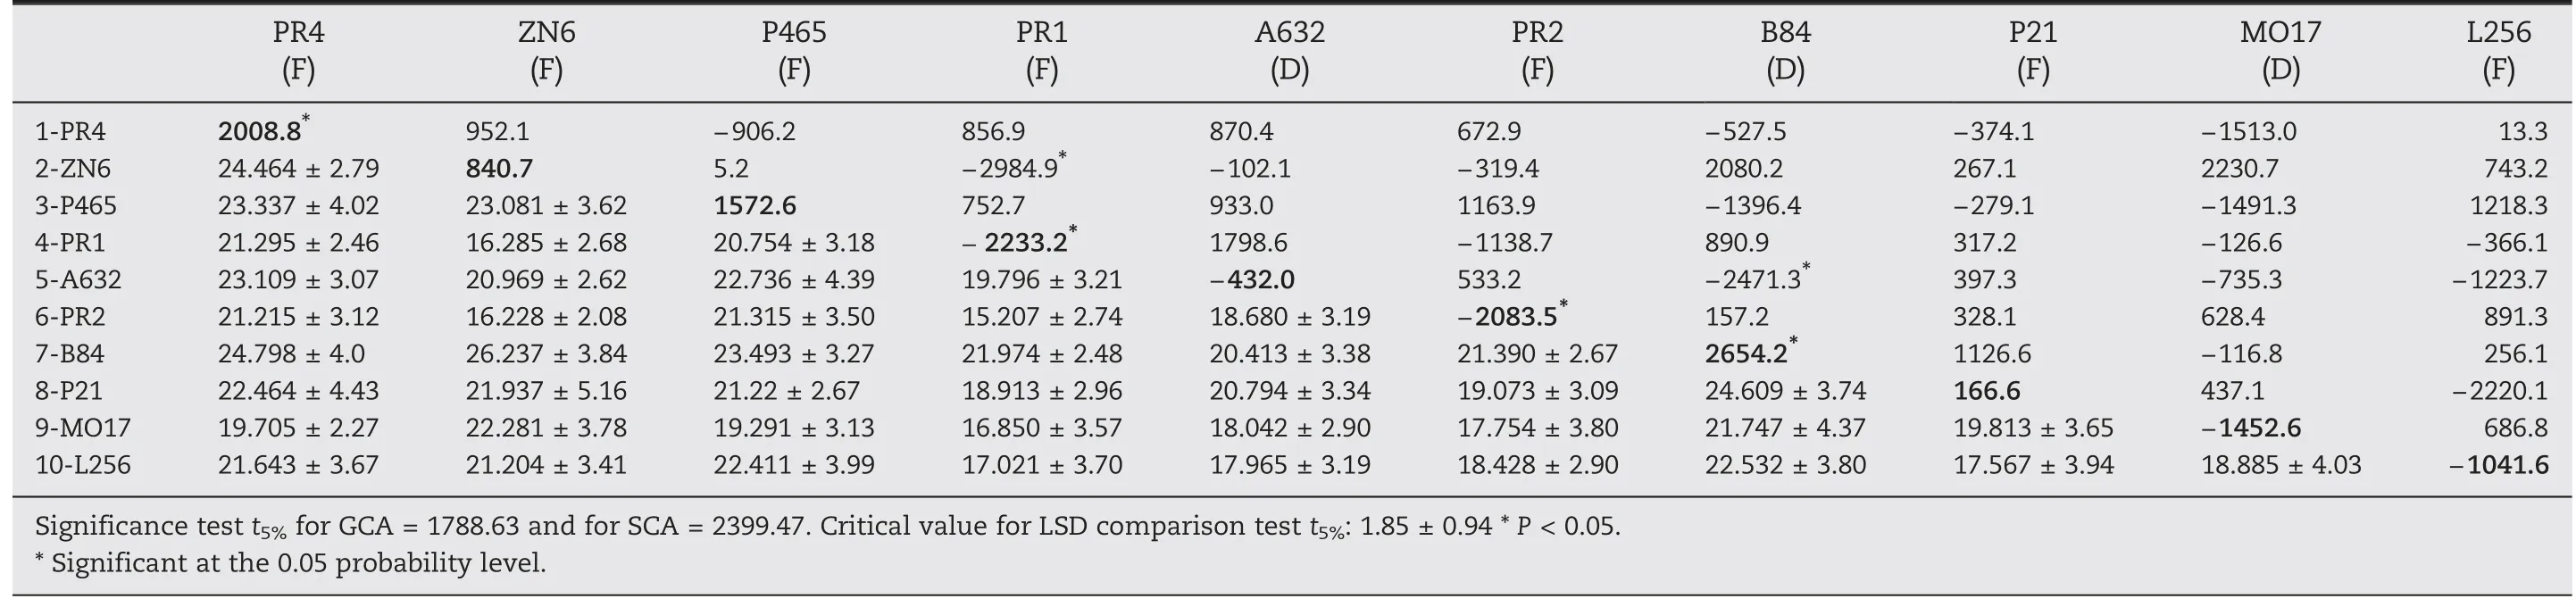
Table 7-Whole plant yield (WY).General combining ability (GCA: values on the matrix diagonal,in bold),specific combining ability (SCA: values above the diagonal),and means (in Mg ha-1) and standard deviation (values below the diagonal) of 10 maize inbred lines (F: flint,D: dent).
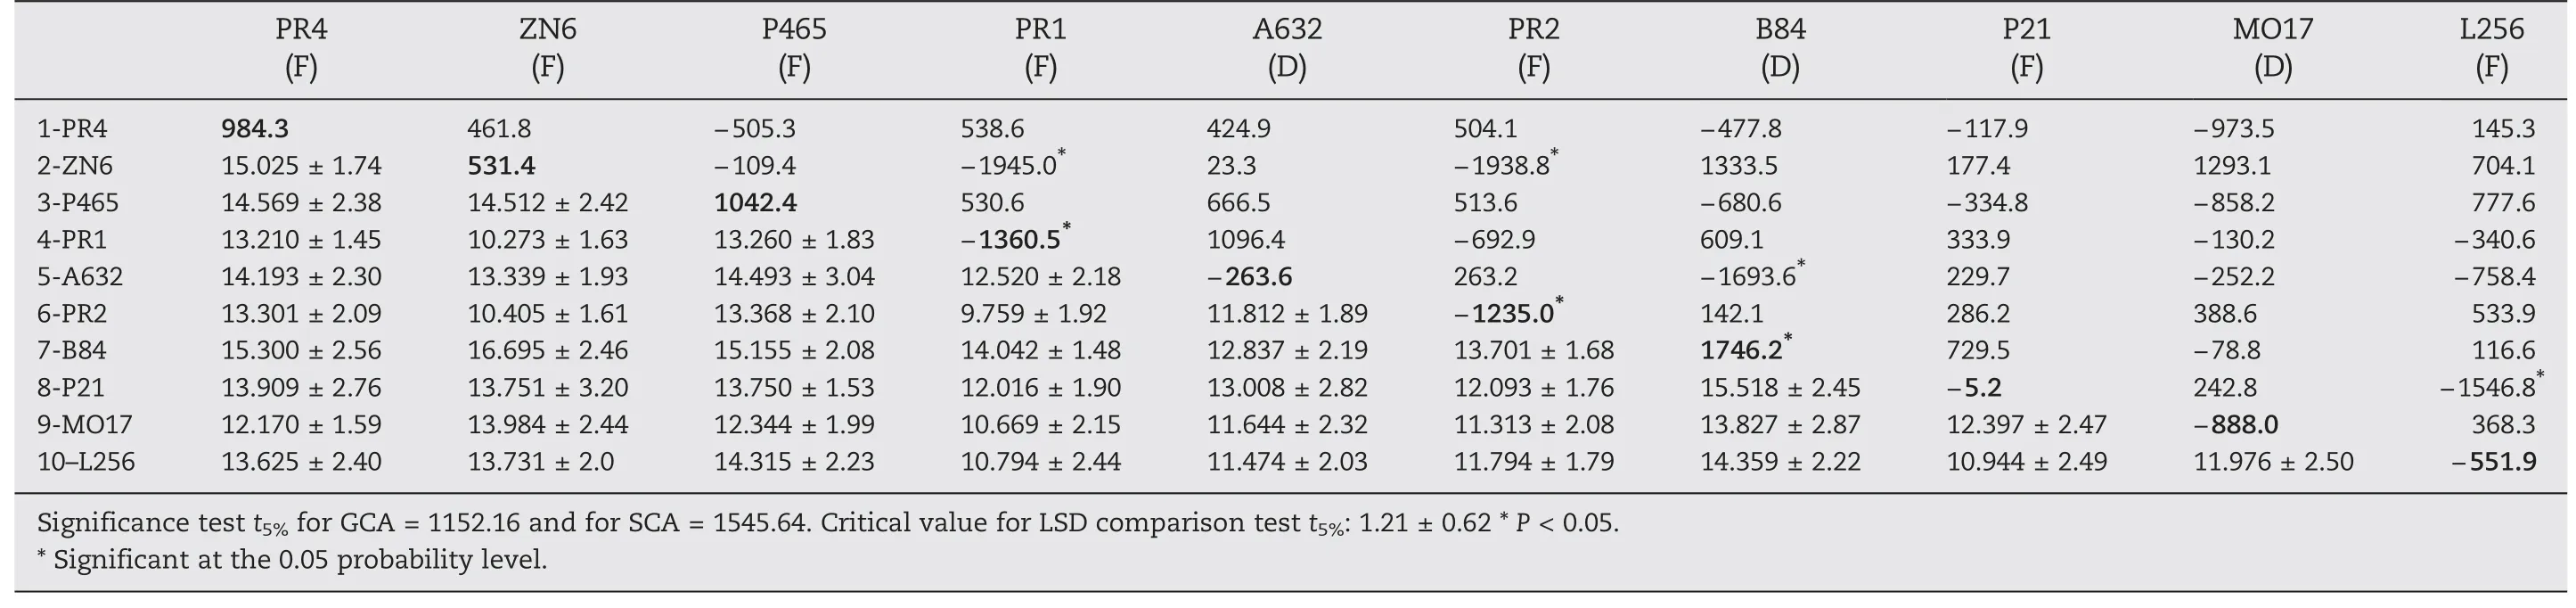
Table 8-Digestible whole plant dry matter yield (DWY).General combining ability (GCA: values on the matrix diagonal,in bold),specific combining ability (SCA: values above the diagonal),means (in Mg ha-1),and standard deviation (values below the diagonal) of 10 maize inbred lines (F: flint,D: dent).
Inbred lines B84 and PR4 had significant and positive GCA values and both would provide genes to increase WY,but B84 showed a positive GCA value only for WDY (Tables 7 and 8).However,the combination of both genotypes in the hybrid form(B84 × PR4)did not result in outstanding performance,as indicated by the SCA value.In contrast,negative SCA values indicated that some combinations,for example hybrid A632 × B84,to which the B84 line contributes would show a decrease in performance for those traits.SCA effects were also significant and negative for PR1 × ZN6.Similar to EY,lines PR1 and PR2 carry genes decreasing WDY and some hybrids(PR1 × ZN6 and PR2 × ZN6)had negative SCA(Table 8)possibly due to its precocity.
3.3.Environmental selection
Environments showed a pattern of differential performance for qualitative and quantitative variables(Table 9).E1 showed high averages for SD and WD and also HI.Thus,E3 was favorable to increasing SY and ED,whereas E6 was best for EY,WY,and consequently DWY(Table 9).In contrast,E4 showed the lowest averages for most of the variables,HI,EY,WY,WD,and DWY.E5 and E6 showed the worst performance for the quality variables SD,ED,and WD.
3.4.GEI and stability analyses
The AMMI model was applied only to variables showing significant GEI.Using the PCA,the GEI sum of squares was divided into sums associated with the possible IPC axis(Table 10).When the postdictive model was applied,most variables fitted an AMMI3 model.WD was explained by a reduced model (AMMI2),while WDY was fitted by an AMMI1 model(Table 10).
The prediction model was applied to fit the dataset to a reduced model.The model that retained no PCA axes was called AMMI0 and included only the additive effects of G and E.In contrast,the full model (Cell Means) retained the maximum number of axes.The model was adjusted by observing the lowest RMSPD value.Significant interaction effects were found for only two variables (Table 11).Both,HI and EY,were fitted by an AMMI1 model,whereas SY,WY,WD,and WDY were fitted by AMMI0(Table 11).The AMMI1 model captured 46.2%and 40.2%of the GEI sum of squares for HI and EY,respectively.
Genotype and environment mean additive main effects are plotted on the ordinate axis(Fig.1-A,B).The interaction effect of the first IPC axis (IPC1) for genotypes and environments is plotted on the coordinate axis.Environment E4 showed the highest positive IPC1 values but was the environment with the worst performance.Environment E1 and E6 made large negative contributions to the variance of the interaction for both traits.In contrast,E5 was the environment with the highest performance and showed high ear yield for the most hybrids.When scores values were projected on the biplot y-axis(IPC1),the stable cultivars or environments could be graphically identified by the lowest score absolute value,or the value nearest to zero.ZN6 × A632 (-1.24),PR4 × PR1 (-1.29),ZN6 × Mo17 (-1.46),PR2 × PR1 (2.10),PR4 × P465 (2.14),PR4 × Mo17 (2.99),P21 × Mo17 (-3.70),PR1 × P21 (4.58),PR1 × L256(5.54),and P465 × B84(-5.36)were the most stable hybrids for EY while PR2 × L256 (39.75),Check 2 (-43.33),A632 × P21 (-27.2),and Check 1 (-27.29) were the most unstable.For HI,Check 1 (-0.21),Mo17 × L256 (0.16),A632 × Mo17 (-0.17),PR2 × L256 (0.16),A632 × P21 (-0.16),P21 × L256 (-0.16),and P465 × PR2 (0.15) contributed with the highest scores,whereas the most stable hybrids were PR2 × B84(-0.001),B84 × P21 (0.006),ZN6 × A632 (0.007),P21 × Mo17(-0.008),and P465 × B84 (0.009).Hybrid PR1 × Mo17 showed the highest HI values in a high-performance environment and thus had acceptable stability (score value-0.008).
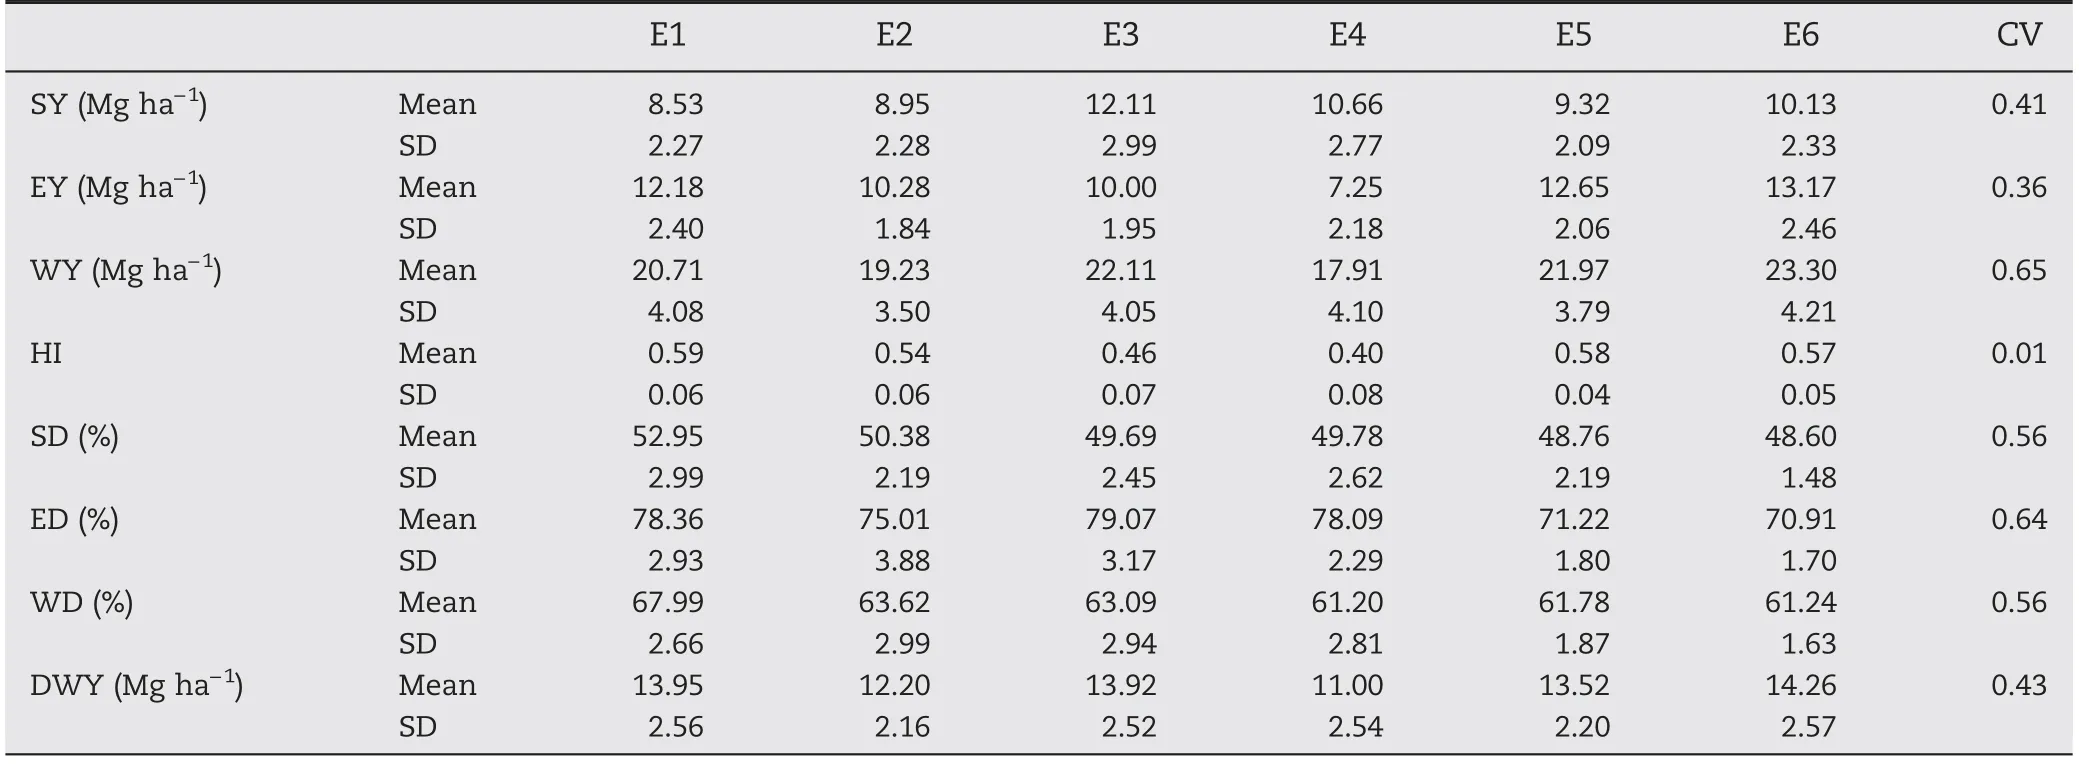
Table 9-Environmental means(x),standard deviation(SD),LSD comparison test,critical value t5%(CV)of variables:stover yield(SY),ear yield(EY),whole plant yield(WY),harvest index(HI),stover digestibility (SD),ear digestibility (ED),whole plant digestibility(WD),and digestible whole plant dry matter yield(DWY).
4.Discussion
4.1.Analysis of variation
Absences of differences in ear and stover digestibility were characteristic of all genotypes assessed.These results agree with those reported [44].Such performance could be explained by the common grain origin,where there was no selection on the quality of plant components.With respect to combining aptitude,the results indicate that there were no predictable combinations based on the GCA.

Table 10-Application of AMMI postdictive model for traits with significant GEI.Mean squares and degree of freedom(df)for stover yield(SY),ear dry yield(EY),whole plant yield(WY),harvest index(HI),whole plant digestibility (WD),and whole plant digestible dry matter yield(WDY).
The use of characters calculated indirectly from other variables can lead to results contradicting those obtained with the original variables[45].ED and SD were a clear example of this phenomenon.They showed non-significant effects for any source of variation,but when they were integrated into the WD variable,their values were high enough to probe differences for the F1and checks,helping to differentiate both sources of variation.
Moreno-González et al.[26] found no significant heterosis for digestibility or acid detergent fiber contents in the stover fraction or the whole plant.Our results are similar to theirs with respect to digestibility.They did not provide values for ear fraction,but they found that heterosis values were higher inflint × dent crosses than in crosses between populations of the same grain type.These results agree with ours,given that the combination flint × dent (ZN6 × B84) showed the largest results.By analysis of the complete plant,the values could be explained by differences in harvest index.This assertion is based on the observation that ear digestibility fluctuates over a range of 85–90%.Stover values fluctuate between 50% and 65%.Consequently,if digestibility of each of the components does not differ,as observed in Table 2,but the proportional contribution of each component varies,WD values will change in favor of the treatment with the greatest proportional contribution of ear(HI).
Variables associated with stover showed a large genetic component with twice the value of the environmental component and of its GEI.This relationship was reflected in higher heritability,as is expected for variables not subjected to sustained crop improvement.Heritability estimates in comparison with genetic variation values are helpful for predicting genetic gain under selection [46].Selection of forage genotypes based on stover traits could accordingly be more effective.
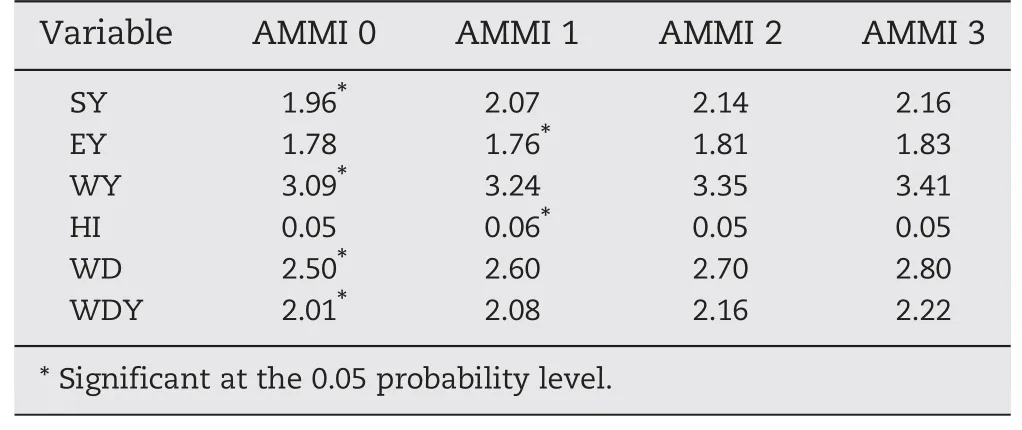
Table 11-Predictive model for variables with significant GEI.Application of Cross Validation for the estimation of RMSPD for AMMI family,from AMMI0 to AMMI3 for stover yield(SY),ear yield(EY),whole plant yield(WY),harvest index(HI),whole plant digestibility (WD),and digestible whole plant dry matter yield(DWY).
4.2.GEI and hybrid stability
AMMI analysis showed the highest residual values for the variables SY,WY,WD,and DWY,corresponding to a higher level of noise or high unpredictable effects.Noisy results are expected for variables associated with stover,possibly owing to a sampling effect [19,42].Stover components (stem and leaves) may be harvested at different stages of maturity depending on genotype,the environment,or their interaction(GEI),generating a higher residual value.The absence of differential selection pressure for stover would explain large genotypic variation for both components.Predictive model confirmed a large interaction effect for EY and HI.This interaction would produce changes in relative rankings of genotypes over diverse environments [47,48] and would consequently be considered in the selection process.
4.3.GGC and SCA and breeding implications
Moreno González et al.[26] pointed out that the ear fraction was the main contributor to heterosis in WY,while stover fraction contributed relatively little.They described populations differing in traits related to forage quality,but noted very little heterosis for such traits.These results may be explained by the lack of interest over decades in improving these components.Ferret et al.[28] found that the strongest gene action in two dent populations was additive for both stover and whole plant yield.In line with our results,Geiger et al.[27]reported in flint × dent crosses that GCA variance considerably exceeds SCA variance for all evaluated agronomic traits and those related to quality,except for grain yield.Thus,the phenotypic variation of both stover and grain could be exploited.The ratios between the two fixed effects indicate a net predominance of additive effects in all the evaluated variables except for those related to quality.These results are consistent with those previously reported for materials with different genetic composition[29].
Materials with similar and/or differential response for forage or/and grain performance could be identified by LSD comparison and the AMMI graphic.It was also possible to detect several potential heterotic patterns capable of generating competitive hybrids,such as Reid(B84) × Argentine flint(ZN6 or P465),which are frequently used for maize grain improvement.However,this pattern was not clearly repeated for stover traits.Some flint × flint crosses also showed high means,although SCA values were non-significant.
Environmental effect was the most common finding in the results,evidenced by high F-values for all variables considered.This response requires the assessment of genotypes intended for forage in an environment similar to those used for grain production.
Our results indicate that breeding of highly digestible forage maize may depend on the re-evaluation and use of old genetic resources that are not currently used,and/or specific breeding of digestibility/ingestibility resource lines[1].This finding is consistent with the results shown in countless research papers suggesting comprehensive screening of lines,populations,and varieties,with or without improvement,to identify candidate genotypes with variation for forage aptitude [1].B84 was the only line that showed a high,positive,and significant GCA value for EY.P465,ZN6,and PR4 values were also positive but non-significant.In contrast,PR4 contributed to increasing SY,but lines PR1 and PR2 had unfavorable alleles,as indicated by significant and negative GCA values.Both B84 and PR4 carried genes to increase WY and only B84 to increase DWY.Our results showed differential aptitude in genotypes for breeding progress in each plant component(stover or ear).This finding means that the ability to generate performance of both components of the plant can be supported in both the vegetative and reproductive component.These results support an approach of differential programs of improvement for forage and grain hybrids.The use of a complex trait such as DWY could complicate the selection process,especially when variances of the GEI are differentially acting on the simple component traits.
The application of different statistical methods for the analysis of the identification of superior materials may be of paramount importance if results are not consistent.There is at present a narrow genetic base for forage quality-related traits that can be enlarged only by incorporation of new genotypes.Stover digestibility and ear yield should be the main objectives in the search for variation.
We conclude that some lines have favorable alleles that will make it possible to reduce the evaluation time.The magnitude of the additive genetic variance will lead to rapid genetic advance during the selection processes.Contrasting the aptitudes of lines with high frequencies of favorable and unfavorable alleles could be used to select parents of advanced populations aimed at QTL analysis for forage aptitude.Thus,the low to moderate SCA levels for the ear traits would confirm the use of crosses in recurrent selection programs or in the production of composites for use as germplasm sources in breeding programs.

Fig.1-AMMI analysis.Two-dimensional graph constructed with interaction principal component axis 1(IPC1)and the average values corresponding to 45 hybrid genotypes,three checks,and six environments.A) Ear yield(EY in Mg ha-1).B) Harvest index(HI).See Table 1 for definitions of numbers 1 to 10.
The authors thank the Germplasm Bank at INTA Pergamino,Argentina,for supplying seeds of the evaluated materials and sincere thanks are extended to Dr.James Nelson,Kansas State University,for valuable critiques and suggestions of previous versions of this paper.
[1] Y.Barrière,D.Alber,O.Dolstra,C.Lapierre,M.Motto,A.Ordas,J.Van Waes,L.Vlasminkel,C.Welcker,J.P.Monod,Past and prospects of forage maize breeding in Europe:I.The grass cell wall as a basis of genetic variation and future improvements in feeding value,Maydica 50(2005) 259–274.
[2] M.Tolenaar,D.E.McCullough,L.M.Dwyer,Physiological basis of the genetic improvement of corn,in: G.A.Slafer,M.Dekker (Eds.),Genetic Improvement of Field Crops,USA,1994,pp.83–236.
[3] M.S.Kang,Genotype by Environment Interaction and Plant Breeding,Louisiana State University,Baton Rouge,Luisiana,1990.
[4] M.S.Kang,Using genotype by environment interaction for crop cultivar development,Adv.Agron.62 (1998)199–252.
[5] C.H.Snijders,F.A.van Eeuwijk,Genotype × strain interactions for resistance to Fusarium head blight caused by Fusarium culmorum in winter wheat,Theor.Appl.Genet.81(1991)239–244.
[6] M.Cooper,G.L.Hammer,Plant Adaptation and Crop Improvement,CABI,Wallingford,Oxford,1996.
[7] M.Brancourt-Hummel,C.Lecomte,Effect of environmental varieties on genotype × environment interaction of winter wheat:a comparison of bi-additive factorial regression to AMMI,Crop Sci.43(2003) 608–617.
[8] M.S.Kang,Breeding:genotype-by-environment interaction,in: R.M.Goodman (Ed.),Encyclopedia of Plant and Crop Science,Marcel-Dekker,New York,2004,pp.218–221.
[9] R.Magari,M.Kang,Genotype selection via a new yield stability statistic in maize yield trials,Euphytica 70(1993)105–111.
[10] J.S.Ebdon,H.G.Gauch,Additive main effect and multiplicative interaction analysis of national turfgrass performance trials: II.Cultivar recommendations,Crop Sci.42 (2002) 497–506.
[11] R.E.Comstock,R.H.Moll,Genotype × environment interactions,in:D.Hanson,H.F.Robinson (Eds.),Statistical Genetics and Plant Breeding,NAS-NRC,Washington,D.C.,1963,pp.164–196,(Publ.No.982).
[12] H.Gauch,R.Zobel,AMMI analysis of yield trials,in:M.S.Kang,H.G.Gauch(Eds.),Genotype-by Environment Interaction,CRC Press,Boca Raton,Florida,1996,pp.85–122.
[13] S.Ceccarelli,S.Grando,R.H.Booth,International breeding programs and resource-poor farmers:crop improvement in difficult environments,in: P.Eyzaguirre,M.Iwanga (Eds.),Participatory Plant Breeding,Proceeding of a workshop on participatory plant breeding.26–29 July,Wageningen.The NetherlandsIPGRI,Italy,1996,pp.99–116.
[14] P.Busey,Management of crop breeding,in: D.R.Wood (Ed.),Crop Breeding,Foundations of Modern Crop Science Series,Crop Science Society of America,Madison,WI,1983,pp.31–54.
[15] C.Epinat-Le Signor,S.Dousse,J.Lorgeou,J.Denis,R.Bonhomme,P.Carolo,A.Charcosset,interpretation of genotype × environment interactions for early maize hybrids over 12 years,Crop Sci.41(2001) 663–669.
[16] P.N.Fox,A.A.Rosielle,Reducing the influence of environmental main-effects on pattern analysis of plant breeding environments,Euphytica 31(1982) 645–656.
[17] P.Annicchiarico,Genotype × Environment Interaction–Challenges and Opportunities for Plant Breeding and Cultivar Recommendations,FAO Plant Production and Protection Paper 174,Food and Agriculture Organization of the United Nations,Rome,2002.
[18] H.G.Gauch,Model selection and validation for yield trials with interaction,Biometrics 44(1988) 705–715.
[19] H.G.Gauch,R.W.Zobel,Predictive and posdictivesuccess of statistical analyses of yield trials,Theor.Appl.Genet.76(1988) 1–10.
[20] K.R.Gabriel,The biplot graphic display of matrices with application to principal component analysis,Biometrika 58(1971) 453–467.
[21] J.C.Gower,D.J.Hand,in: Chapman &Hall (Ed.),Biplots,1996,p.277,(London).
[22] R.Parsad,J.Crossa,M.Vargas,V.K.Bhatia,Biplot graphic display:some concepts,Electronic Book on Advances in Data Analytical Techniques,2007,(Available at http://www.iasri.res.in/design/ebook/EBADAT/index.htm).
[23] N.Sabaghnia,S.H.Sabaghpour,H.Dehghani,The use of an AMMI model and its parameters to analyze yield stability in multi-environment trials,J.Agric.Sci.146 (2008) 571–591.
[24] W.Adugna,M.T.Labuschagne,Genotype–environment interactions and phenotypic stability analyses of linseed in Ethiopia,Plant Breed.121 (2002) 66–71.
[25] D.Falconer,T.Mackay,Introduction to Quantitative Genetics,4th ed.Addison Wesley Longman,Harlow,Essex U.K.,1996.459.
[26] J.Moreno-González,I.Martínez,I.Brichette,A.López,P.Castro,Breeding potential of European flint and U.S.Corn Belt dent maize populations for forage use,Crop Sci.40(2000)1588–1595.
[27] H.Geiger,A.Melchinger,G.Schmidt,Analysis of factorial crosses between flint and dent maize inbred lines of forage performance and quality traits,Proceedings of the 13th Congress of Maize and Sorghum,Wageningen,The Netherlands,1986,pp.147–154.
[28] A.A.Ferret,A.Casañas,A.Vedú,L.Bosch,F.Nuez,Breeding for yield and nutritive value in forage maize:an easy criterion for stover quality,and genetic analysis of Lancaster variety,Euphytica 53 (1991) 61–66.
[29] L.M.Bertoia,Forage yield and quality combining ability of maize composites with different improvement levels,Maydica 46 (2001) 87–92.
[30] S.W.Ritchie,G.O.Benson,How a corn plant develops,in:Cooperative Extension Service (Ed.),Special Report No.48,Iowa State University of Science and Technology,Ames,Iowa,1993.
[31] C.W.Hunt,W.Kezar,R.Vinands,Yield,chemical composition and ruminal fermentability of corn whole-plant,ear and stover as affected by maturity,J.Prod.Agric.2 (1989) 357–361.
[32] J.S.Shenk,M.O.Westerhaus,The Application of Near Infrared Reflectance Spectroscopy (NIRS) to Forage Analysis,Forage Quality Evaluation and Utilization,Am.Soc.Agron,Madison,WI,1994.406.
[33] D.Jones,M.Hayward,The effect of pepsin pretreatment of herbage on the prediction of dry matter digestibility from solubility in fungal enzyme solution,J.Sci.Food Agric.26(1975) 711–718.
[34] B.C.Gabrielsen,Evaluation of marketed cellulases for activity and capacity to degrade forage,Agron.J.78(1986) 838–842.
[35] M.S.McIntosh,Analysis of combined experiments,Agron.J.75(1983) 153–155.
[36] SAS Institute Inc.SAS/STAT,Software version 8,Cary,NC,USA,1999.
[37] H.G.Griffing,Concept of general and specific combining ability in relation to diallel crossing systems,Aust.J.Biol.Sci.9(1956) 463–493.
[38] C.D.Cruz,Programa Genes: Versao Windows,aplicativo computacional em genética e estadística,UFV Viçosa,Brasil,2001.648.
[39] J.M.Cheverud,A comparison of genetic and phenotypic correlations,Evolution 42(1988) 958–968.
[40] C.H.Hanson,H.F.Robinson,R.E.Comstock,Biometrical studies of yield in segregating population of Korean Lespedeza,Agron.J.48(1956) 268–272.
[41] H.G.Gauch,R.E.Furnas Jr.,Statistical analysis of yield trials with MATMODEL,Agron.J.83(1991) 916–922.
[42] H.G.Gauch Jr.,Full and reduced models for yield trials,Theor.Appl.Genet.80(1990) 153–160.
[43] I.Lipkovich,E.P.Smith,Biplot and singular value decomposition Macros for Excel™,http://www.jstatsoft.org/v07/i05/,Virginia Polytechnic Institute,2002.
[44] Peña Ramos,F.González Castañeda,G.NuñezHernandez,M.R.Tovar Gómez,R.Preciado Ortiz,A.Terroin Ibarra,N.Gómez Montiel,A.Ortega Corona,Estabilidad del rendimiento y calidad forrajera en híbridos de maíz,RevistaFitotecnia Mexicana,29,Special N2,2006.109–114.
[45] M.M.Goodman,E.Paterniani,The races of maize:III.Choices of appropriate characters for racial classification,Econ.Bot.23 (1969) 265–273.
[46] B.Atnafua,T.Nageshwar Rao,Estimates of heritability,genetic advance and correlation study for yield and its attributes in maize (Zea mays L.),J.Plant Sci.2(2014) 1–4.
[47] K.W.Finlay,G.N.Wilkinson,The analysis of adaptation in a plant breeding program,Aust.J.Agric.Res.14 (1963)742–754.
[48] S.A.Eberhart,W.A.Rusell,Stability parameters for comparing varieties,Crop Sci.6(1966) 36–40.
- The Crop Journal的其它文章
- Molecular detection of Xanthomonas oryzae pv.oryzae,Xanthomonas oryzae pv.oryzicola,and Burkholderia glumae in infected rice seeds and leaves
- Growth,photosynthesis and nitrogen metabolism in soybean varieties after exclusion of the UV-B and UV-A/B components of solar radiation
- Differences between soybean genotypes in physiological response to sequential soil drying and rewetting
- Mapping and validation of a dominant salt tolerance gene in the cultivated soybean(Glycine max) variety Tiefeng 8
- Genetic background effects on QTL and QTL × environment interaction for yield and its component traits as revealed by reciprocal introgression lines in rice
- Brief Guide for Authors