Genetic background effects on QTL and QTL × environment interaction for yield and its component traits as revealed by reciprocal introgression lines in rice
Xiaoqian Wang,Yunlong Pang,Jian Zhang,Qiang Zhang,Yonghong Tao,Bo Feng,Tianqing Zheng,Jianlong Xu*,Zhikang Li
Institute of Crop Science/National Key Facility for Crop Gene Resources and Genetic Improvement,Chinese Academy of Agricultural Sciences,Beijing 100081,China
1.Introduction
Rice(Oryza sativa L.),as a staple food,feeds more than half of the world population [1].In the past half century,production has improved significantly,benefiting from the Green Revolution in the late 1950s through improved harvest index and plant type,and hybrids from the late 1970s through improved biomass.However,the rate of improvement has declined in recent years.Rice production needs to increase by at least 40%over current production to meet increasing demand by 2030 [2].With continuing land degradation and urbanization this can be achieved only by higher yielding varieties.
Yield is a complex agronomic trait controlled by multiple genes,but primarily determined by three component traits:filled grain number (FGN) per panicle,panicle number per plant (PN),and 1000-grain weight (TGW).Since the 1980s,a large number of reports on complex agronomic traits have been published from studies on segregating populations such as recombinant inbred lines,F2and progenies,backcross populations and doubled haploids (DH) [3–7].A total of 2060 QTLs for yield and its component traits were reported up to March 2014 (http://www.gramene.org/).Furthermore,progress has been made in cloning major QTLs controlling yield and its component traits,facilitating a better understanding of the mechanism of regulation of rice yield [8–12].However,the results of QTL mapping and gene cloning have not significantly improved the yield of rice under field conditions and QTL application in breeding practice has been minimal.The major reasons for this are: (1) genetic background (GB) effects impede general utilization of QTL identified in different backgrounds; (2) quantitative traits are influenced by environment and tend to perform differently in different environments;and(3)insufficient numbers of effective favorable alleles.
There are considerable evidences demonstrating that the expression of QTL for yield and its component traits are strongly affected by GB [13–16].Most QTLs affecting panicle size-related traits including primary branch number,secondary branch number,and spikelet number per panicle were detectable only in one of the parental GBs in two sets of reciprocal introgression lines (ILs) of rice [16].Strong GB effects on TGW and grain shape were also detected using a set of reciprocal introgression lines (ILs) from Lemont and Teqing [13].Some GB-independent loci for grain length and grain width were identified and these could be utilized for marker-assisted breeding (MAS).On the other hand,epistatic QTLs are more sensitive to GB and environment as revealed in a DH population derived from IR64/Azucena and a RIL population derived from IR1552/Azucena,crosses that share the same male parent[15].Moreover,the number of commonly identified QTLs indifferent mapping populations largely depends on the degree of overlap between their genomes[17,18].
QTL × environment interaction (QEI) plays an important role in adaptation to the changing environments and maintenance of genetic variation in populations.QEI is particularly high in self-pollinated plants [19].The expression of QTLs affecting yield and its components is influenced by environment [20] and the same QTLs may have different effects in different years,with strong QEIs [21].It is important in plant breeding to identify QTLs stably expressed in different environments and intensive studies on the effects of QEI will be needed in the future [22,23].
In order to minimize GB and QEI effects,advanced backcross QTL analysis (AB-QTL) and trait-specific IL analysis were proposed and applied in QTL mapping for yield and abiotic stress tolerance in rice[16,20,24–27].To evaluate GB effects on expression of QTL and QEI in this study,QTL mapping for yield and yield-related traits was undertaken using two sets of ILs derived from Lemont and Teqing across six environments.The results were expected to provide valuable information for marker-assisted breeding for yield potential in rice.
2.Materials and methods
2.1.Plant material
Lemont,a good grain quality japonica variety from the U.S.A.was crossed with Teqing,a high yielding indica variety from South China.The F1hybrids were then backcrossed to their corresponding parents Lemont and Teqing to produce BC1F1s,which were used as male parents in backcrossing with their corresponding parents to produce BC2F1populations.Further backcrossing was carried out until the BC3F1or BC4F1generations,resulting in a set of 194 ILs in Lemont background(LT-ILs) and 248 ILs in Teqing background (TQ-ILs) [28],and these were used for QTL detection.
2.2.Field trials and data collection
The 442 ILs and parents,Lemont and Teqing,were planted in 6 environments,including Hainan(18.3°N,109.3°E)in 2006,2010,and 2011,designated as 06HN,10HN,and 11HN,respectively,Beijing(40.2°N,116.2°E)in 2007 and 2012,designated as 07BJ and 12BJ,respectively,and Guangxi (22.84°N,108.33°E) in 2011,designed as 11GX.Seeds were sown on November 20 in Hainan,April 30 in Beijing,and July 15 in Guangxi.Seedlings at 25 days were transplanted in the field in random complete block designs,2 rows of 10 plants per row and a spacing of 20 cm between rows and 17 cm between plants in two replications.Field management was the same in all six environments.At maturity,six middle plants in the two rows were sampled for measuring grain yield per plant(GY,g),filled grain number per panicle (FGN),panicle number per plant (PN),and 1000-grain weight (TGW,g).Mean values from the two replications were used for data analysis in each environment.
2.3.SNP genotyping
SNP genotyping was carried out by the School of Life Sciences,Peking University.An array containing 9000 SNP markers evenly distributed on 12 chromosomes [29] was used to genotype 194 LT-ILs,248 TQ-ILs and the two parents.A total of 3924 polymorphic SNPs were available for analysis.
2.4.Data analysis
SAS PROC GLM [30] was used to analyze trait variances.Correlations between yield and its component traits over six environments were analyzed with SAS PROC CORR[30].
The BIN tool in QTL IciMapping was implemented to help identify and remove redundant markers in a dataset and also remove markers with high missing rates [31].Finally,1942 and 2118 SNP markers in the LT-IL and TQ-IL populations,respectively,were retained for QTL mapping.Single environment QTL analysis was conducted by the method of inclusive composite interval mapping(ICIM)in QTL IciMapping ver.3.3[31].LOD thresholds for QTL detection were determined by 1000 permutation tests with average LOD values of 3.5 and 3.6 in LT-ILs and TQ-ILs,respectively.Multi-environment joint analyses were performed using the multi-environment trials(MET)program in QTL IciMapping ver.3.3 to detect QEIs with LOD thresholds of 3.5 and 3.6 in LT-ILs and TQ-ILs,respectively.Only reliable QTLs detected by both single environment analysis and multi-environment analysis are reported[32].
3.Results
3.1.Genetic characteristics of the reciprocal ILs
A total of 3924 SNP markers were evenly distributed across the 12 chromosomes covering an average 96.58%(369.1 Mb)of the rice genome published by the International Rice Genome Sequencing Project[33],ranging from 90.94%on chromosome 11 to 99.53% on chromosome 8 (Table S1).According to the rice genome genetic distances,the physical distance was on average 241.7 kb cM-1,ranging from 215.3 kb cM-1for chromosome 3 to 269.5 kb cM-1for chromosome 10.There was an average 2.56 SNPs cM-1across the whole genome.
Most of the ILs possessed well reconstituted parental genotypes; the level of genome recovery averaged 87.29%,ranging from 26.17% to 99.96% in LT-ILs,and 91.93% ranging from 61.27%to 99.99%in TQ-ILs(Fig.1).There were 8.07–12.70%common genome segments shared by ILs from different sets.
3.2.Trait performance
The performances of yield and its component traits differed among the six environments(Table 1).However,they had the same trends in the following aspects.Firstly,Lemont had significantly lower values than Teqing for PN,GY and FGW,but similar TGW to Teqing.Secondly,there was transgressive segregation in both directions for all traits except for GY in both populations.
Correlation coefficients between different traits in each environment are given in Table S2.Both PN and FGN were significantly correlated (P ≤0.001) with GY in both backgrounds over all six environments,although the coefficients were different,whereas TGW was inconsistent over different environments.In LT-ILs,TGW showed a significant correlation with GY in all environments except 10HN and 11GX,whereas in TQ-ILs TGW was highly significantly correlated with GY in all environments except 10HN and 11GX.
ANOVA showed that differences among genotypes and environments within each set of ILs were highly significant for all traits.Genotypes (G) explained an average of 27.0 ±14.9% of the total phenotypic variation in the IL populations,ranging from 13.3% for GY to 50.3% for TGW (Table S3).Environment(E)explained an average 31.9 ± 18.5%of the total phenotypic variation in the IL populations,ranging from 2.9%for TGW to 52.5%for GY.G × E interaction was also significant for all measured traits and explained an average 26.6 ± 3.8%of the total phenotypic variation in the IL populations,ranging from 22.6%for GY to 33.3%for FGN.
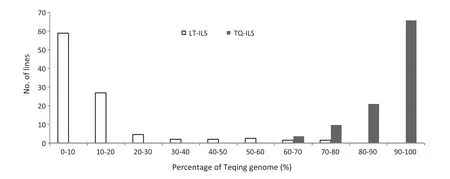
Fig.1-Frequency distribution of the Teqing genome content in reciprocal introgression line populations derived from Lemont × Teqing.
3.3.QTL affecting GY and its component traits
A total of 72 distinct QTLs for GY and its component traits,including 14 for GY,23 for FGN,14 for PN,and 21 for TGW were detected by both single environment and multi-environment analyses in the reciprocal ILs over the six environments(Tables 2–5;Fig.2).
For GY,8 and 7 QTLs were identified in LT-ILs and TQ-ILs,respectively(Table 2;Fig.2).Eight QTLs(QGy3a,QGy3b,QGy3c,QGy5a,QGy6,QGy7,QGy8,and QGy10) were detected in more than one environment in the two backgrounds and the Teqing alleles at all loci,except for QGy3b and QGy7,increased GY by an average of 3.5 g(ranging from 1.5 to 6.8 g).The other 6 QTLs were environment-specific and detected in only one environment in the two backgrounds.Teqing alleles at QGy2a,QGy2b,QGy4a,and QGy12 increased GY whereas Lemont alleles at QGy1 and QGy4b increased GY.Among them,only QGy5a was simultaneously detected in both backgrounds and in different environments with the same direction of gene effect.
For FGN,11 and 14 QTLs were identified in LT-ILs and TQ-ILs,respectively (Table 3,Fig.2).Seven QTLs (QFgn3c,QFgn3e,QFgn5a,QFgn6a,QFgn10,QFgn3d,and QFgn4b) were detected in more than one environment under the two backgrounds and the Teqing alleles in the first five QTLs increased FGN by an average of 17.2(ranging from 7.4 to 27.2)whereas the Lemont alleles in the last two increased FGN.The other 16 QTLs were detected in only one environment across the two backgrounds.Teqing alleles at QFgn1a,QFgn1b,QFgn2a,QFgn2b,QFgn3a,QFgn5c,QFgn6b,QFgn8,and QFgn9a increased FGN,whereas Lemont alleles at QFgn3b,QFgn4a,QFgn5b,QFgn7a,QFgn7b,QFgn9b,and QFgn11 increased FGN.Among them,QFgn3a and QFgn3e were simultaneously detected in both backgrounds,but most were detected in single environments.QFgn3e was consistently detected in five out of six environments in LT-ILs.
For PN,6 and 12 QTLs were identified in LT-ILs and TQ-ILs,respectively (Table 4,Fig.2).Four QTLs (QPn4b,QPn5,QPn7,and QPn9)were detected in more than one environment under the two backgrounds and Teqing alleles at all loci except QPn7 increased PN by an average of 0.8(ranging from 0.6 to 1.0).The other ten QTLs were detected in only one environment in the two backgrounds.Teqing alleles at QPn2a,QPn2b,QPn4a,QPn6b,QPn10b,QPn11a,and QPn12 increased PN and Lemont alleles at QPn6a,QPn10a,and QPn11b increased PN.Four QTLs(QPn2b,QPn4b,QPn6b,and QPn9) were detected in both backgrounds,but mostly in different environments.
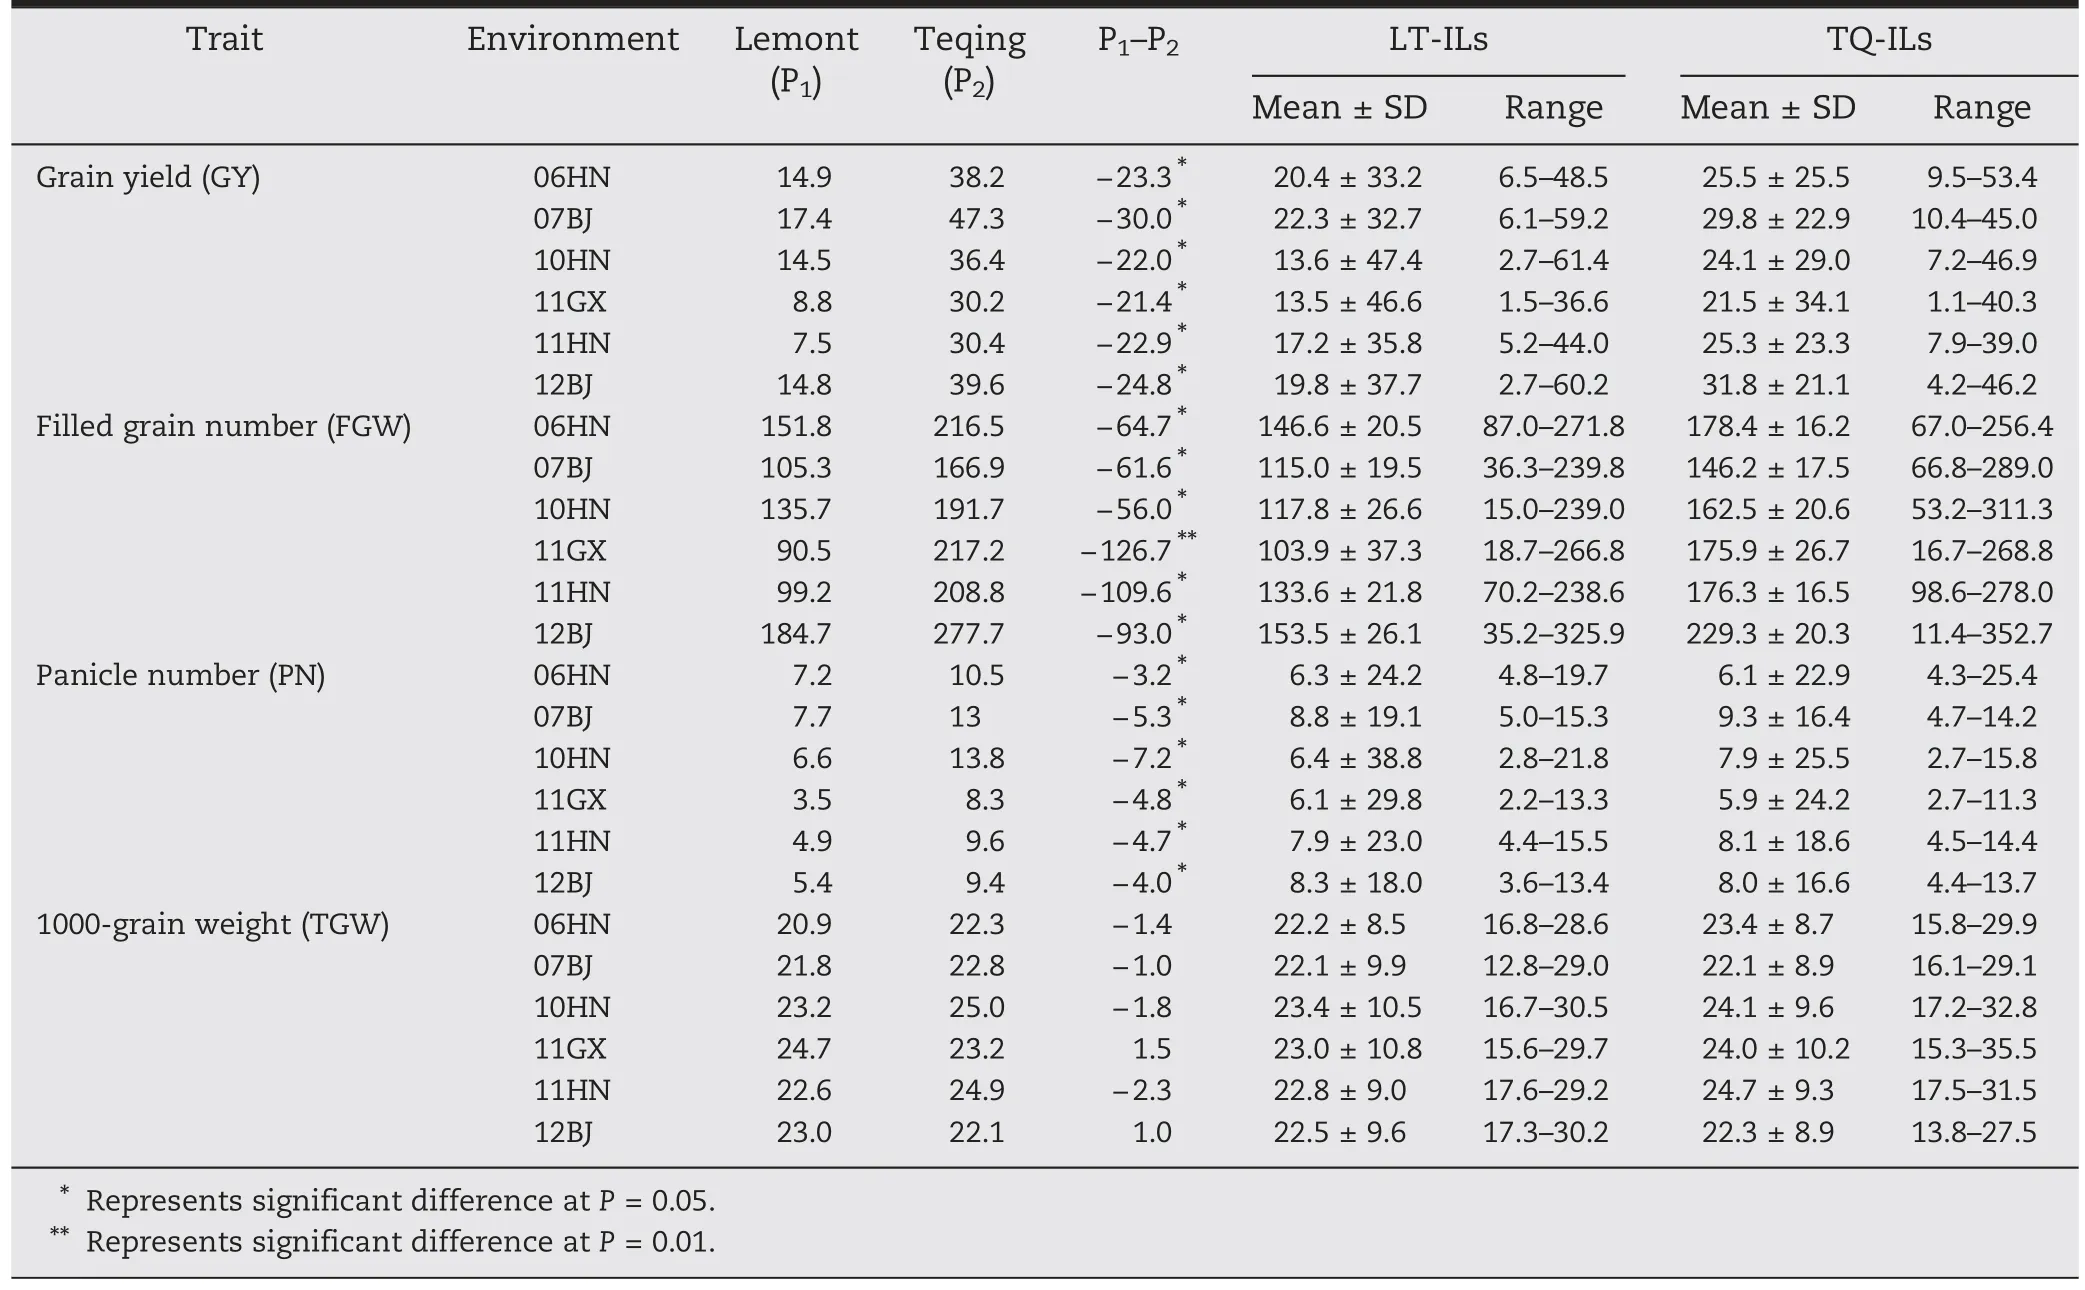
Table 1-Performance of reciprocal introgression lines (ILs) of Teqing (TQ) and Lemont (LT) and their two parents for yield and its component traits in Beijing(07BJ,12BJ),Hainan(06HN,10HN,and 11HN),and Guangxi(11GX).
For TGW,12 and 17 QTLs were identified in LT-ILs and TQ-ILs,respectively (Table 5,Fig.2).Eleven QTLs (QTgw3a,QTgw4b,QTgw5a,QTgw5b,QTgw5c,QTgw7,QTgw2a,QTgw2b,QTgw3b,QTgw3c,and QTgw4a) were detected in more than one environment under the two backgrounds and Teqing alleles at the first six loci increased TGW by an average of 0.99 (ranging from 0.4 to 1.9) whereas Lemont alleles at the last five loci increased TGW by an average of 1.1 (ranging from 0.5 to 1.6).The other 10 QTLs were environment-specific and detected in only one environment.Teqing alleles at QTgw1b,QTgw9a,QTgw10a,and QTgw10b and Lemont alleles at QTgw1a,QTgw1c,QTgw6,QTgw8,QTgw9b,and QTgw11 increased TGW.Eight QTLs (QTgw1a,QTgw1c,QTgw2b,QTgw3b,QTgw3c,QTgw4b,QTgw5a,and QTgw10b) were detected in both backgrounds but mostly in different environments.QTgw5a was consistently detected in at least four environments in the two sets of ILs,indicating stability across environments.
Fifteen (20.8%) QTLs were commonly identified for the above four traits in the reciprocal backgrounds across six environments,indicating QTLs for yield and its component traits were strongly affected by GB.
3.4.Genotype × environment interaction (GEI)
Among 72 QTLs for GY and its component traits,most(87.4%) showed significant QTLs × environment interactions(QEIs)and appeared to be more or less environment-specific(Table 6).
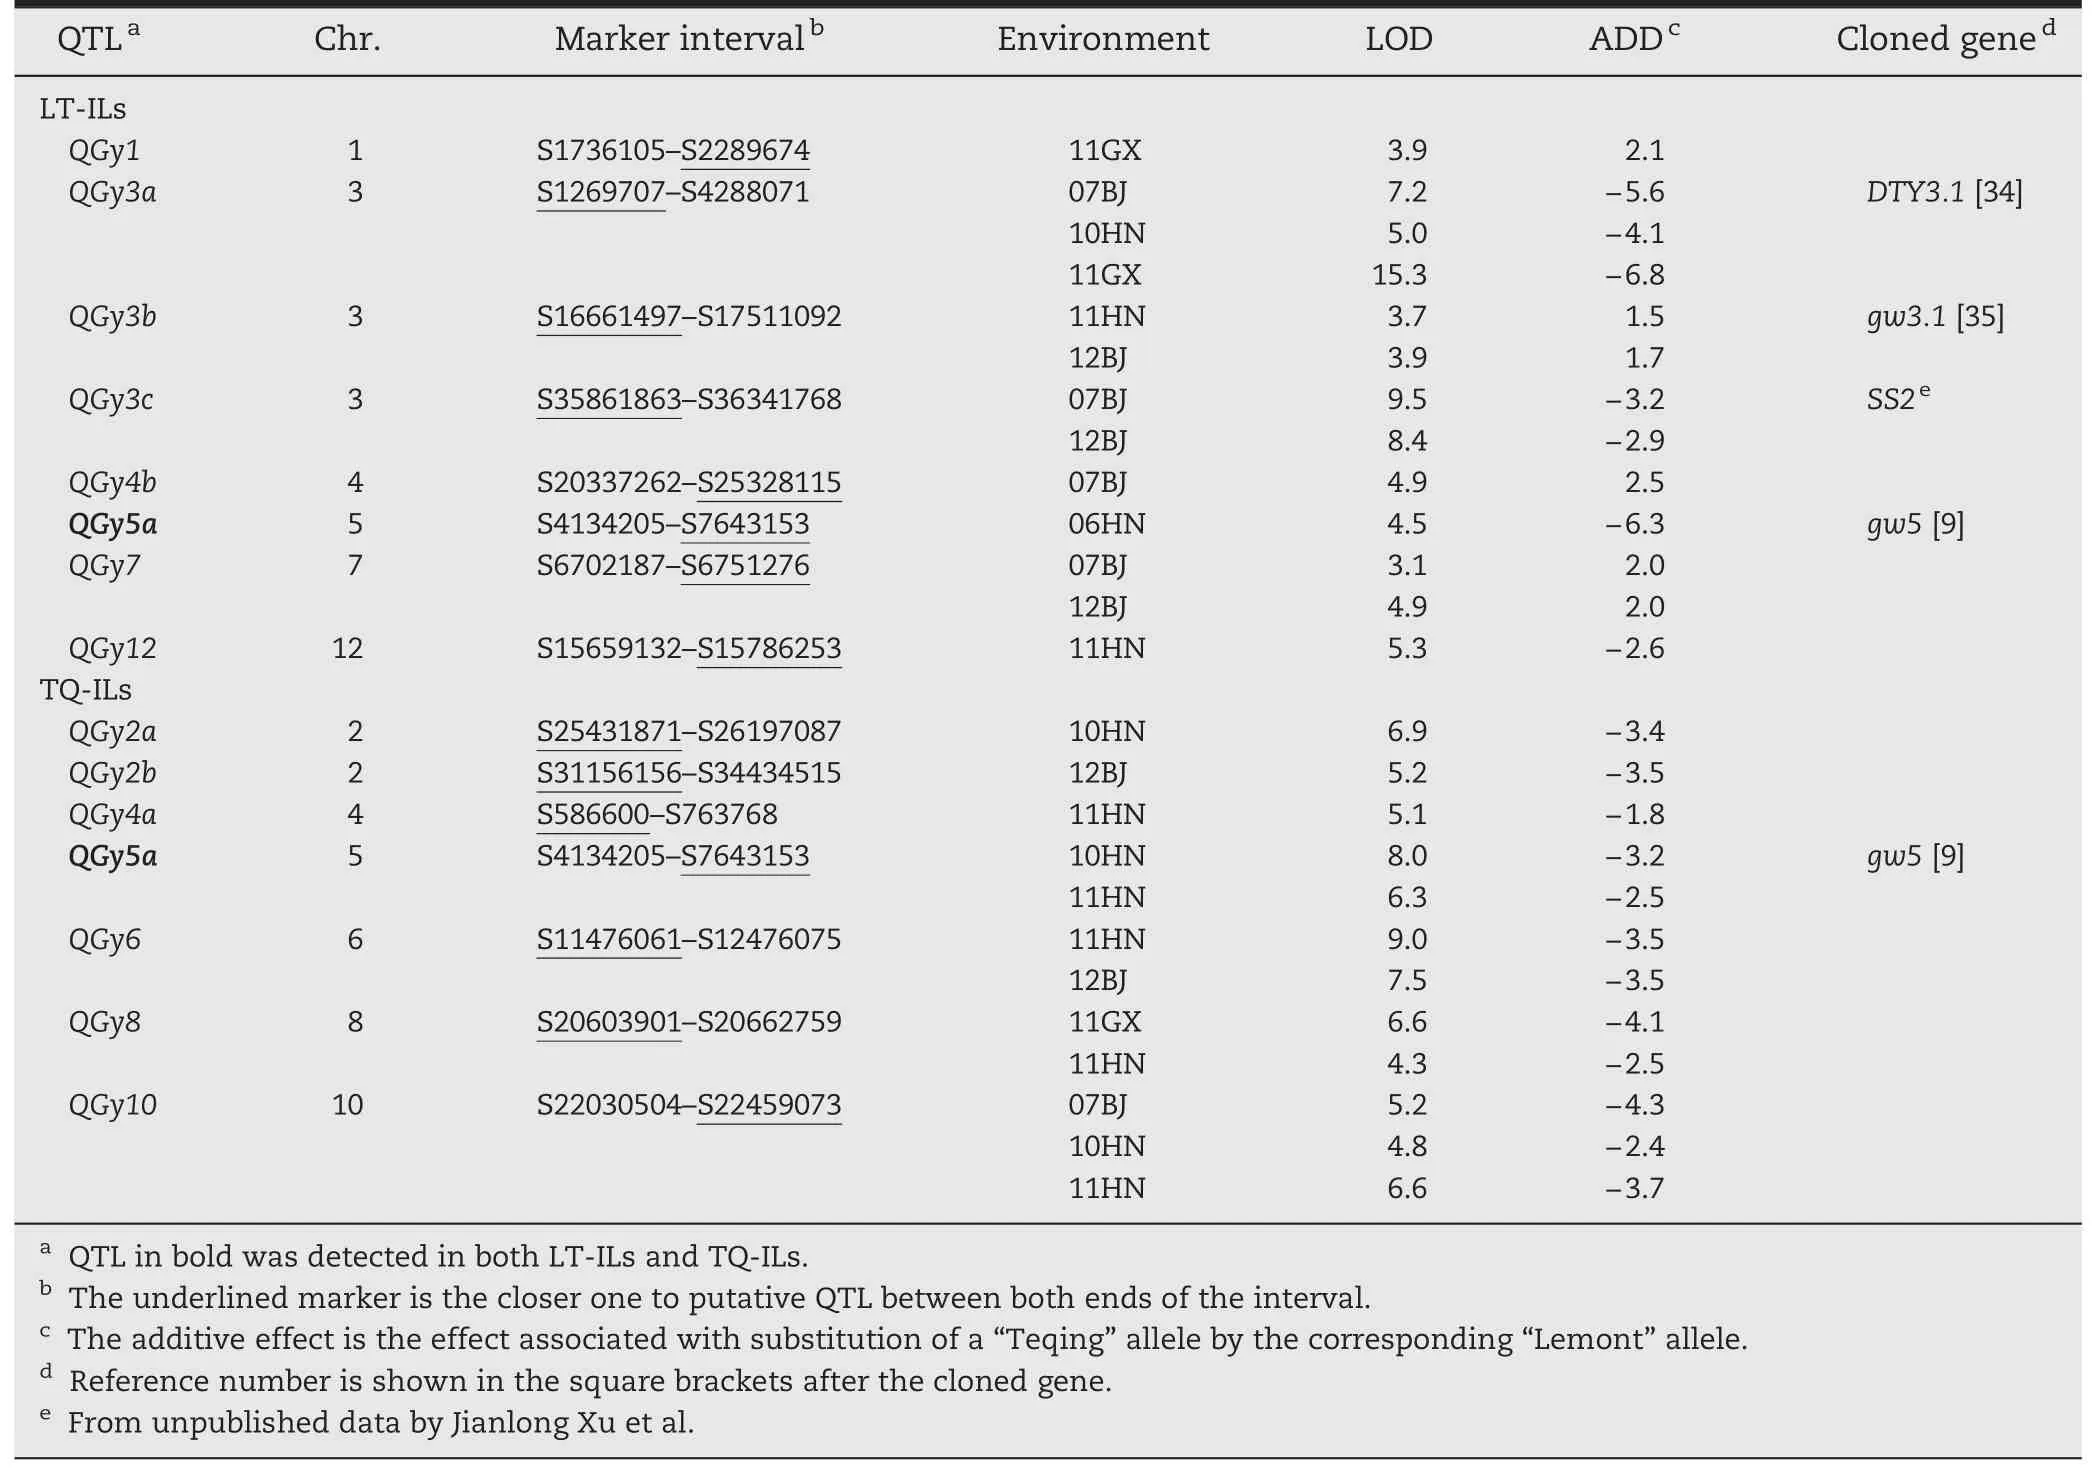
Table 2-QTLs associated with GY in LT-ILs and TQ-ILsin Beijing(07BJ,12BJ),Hainan(06HN,10HN,and 11HN),and Guangxi(11GX).
For GY,7 and 7 QTLs showed significant environment interactions in LT-ILs and TQ-ILs,respectively,with significant additive × environment (AE) effects ranging from-5.3 to 2.7 g(Table 6).No significant environment interaction was detected for QGy3b in LT-ILs.Four QTLs(QGy2a,QGy5a,QGy6,and QGy10)were detected in at least four environments,and QGy5a was commonly detectable in both backgrounds with different interaction patterns.The remaining QTLs appeared to be more or less environment-specific.Among 15 QTLs,we noted thatQGy3a in LT-ILs and QGy2a and QGy8 in TQ-ILs showed large variations in their effects in both magnitude and direction.
For FGN,11 and 13 QTLs showed significant interactions in LT-ILs and TQ-ILs,respectively,with significant AE effects ranging from-14.8 to 12.3 (Table 6).No significant environment interaction was detected for QFgn1a in TQ-ILs.Eight QTLs (QFgn2b,QFgn3a,QFgn3c,QFgn3e,QFgn5a,QFgn6a,QFgn7a,and QFgn10) were detected in at least four environments,and QFgn3a and QFgn3e were commonly detected in both ILs with different interaction patterns.Among 25 QTLs,QFgn3a,QFgn4b,QFgn5a,QFgn5b,and QFgn11 in LT-ILs and QFgn2b,QFgn3a,QFgn3c,QFgn6a,QFgn7a,and QFgn10 in TQ-ILs showed large variations in effect in both magnitude and direction.
For PN,6 and 11 QTLs showed significant interactions in LT-ILs and TQ-ILs,respectively,with significant AE effects ranging from-1.5 to 1.3 (Tables 5,6).No significant environment interaction was detected for QPn6a in TQ-ILs.Almost all QTLs appeared to be less environment-specific,and four QTLs (QPn2b,QPn4b,QPn6b,and QPn9) were commonly detected in both ILs with different interaction patterns,except for QPn2b.Among 18 QTLs,QPn4b,QPn6b,and QPn11b in TQ-ILs showed large variations in effect in both magnitude and direction.
For TGW,8 and 13 QTLs showed significant interactions in LT-ILs and TQ-ILs,respectively,with significant AE effects ranging from-2.2 to 2.0 g (Tables 5,6).No significant environment interactions were detected for QTgw4a,QTgw6,QTgw9b,and QTgw10b in LT-ILs and QTgw1a,QTgw1b,QTgw1c,and QTgw9a in TQ-ILs.Most QTLs appeared to be less environment-specific,except for QTgw2a in TQ-ILs,which showed interaction with five environments.Five QTLs (QTgw2b,QTgw3b,QTgw3c,QTgw4b,and QTgw5a) were commonly detected in both ILs with different interaction patterns.Among 29 QTLs,QTgw4b in LT-ILs and QTgw7 in TQ-ILs showed large variations in effect in both magnitude and direction.
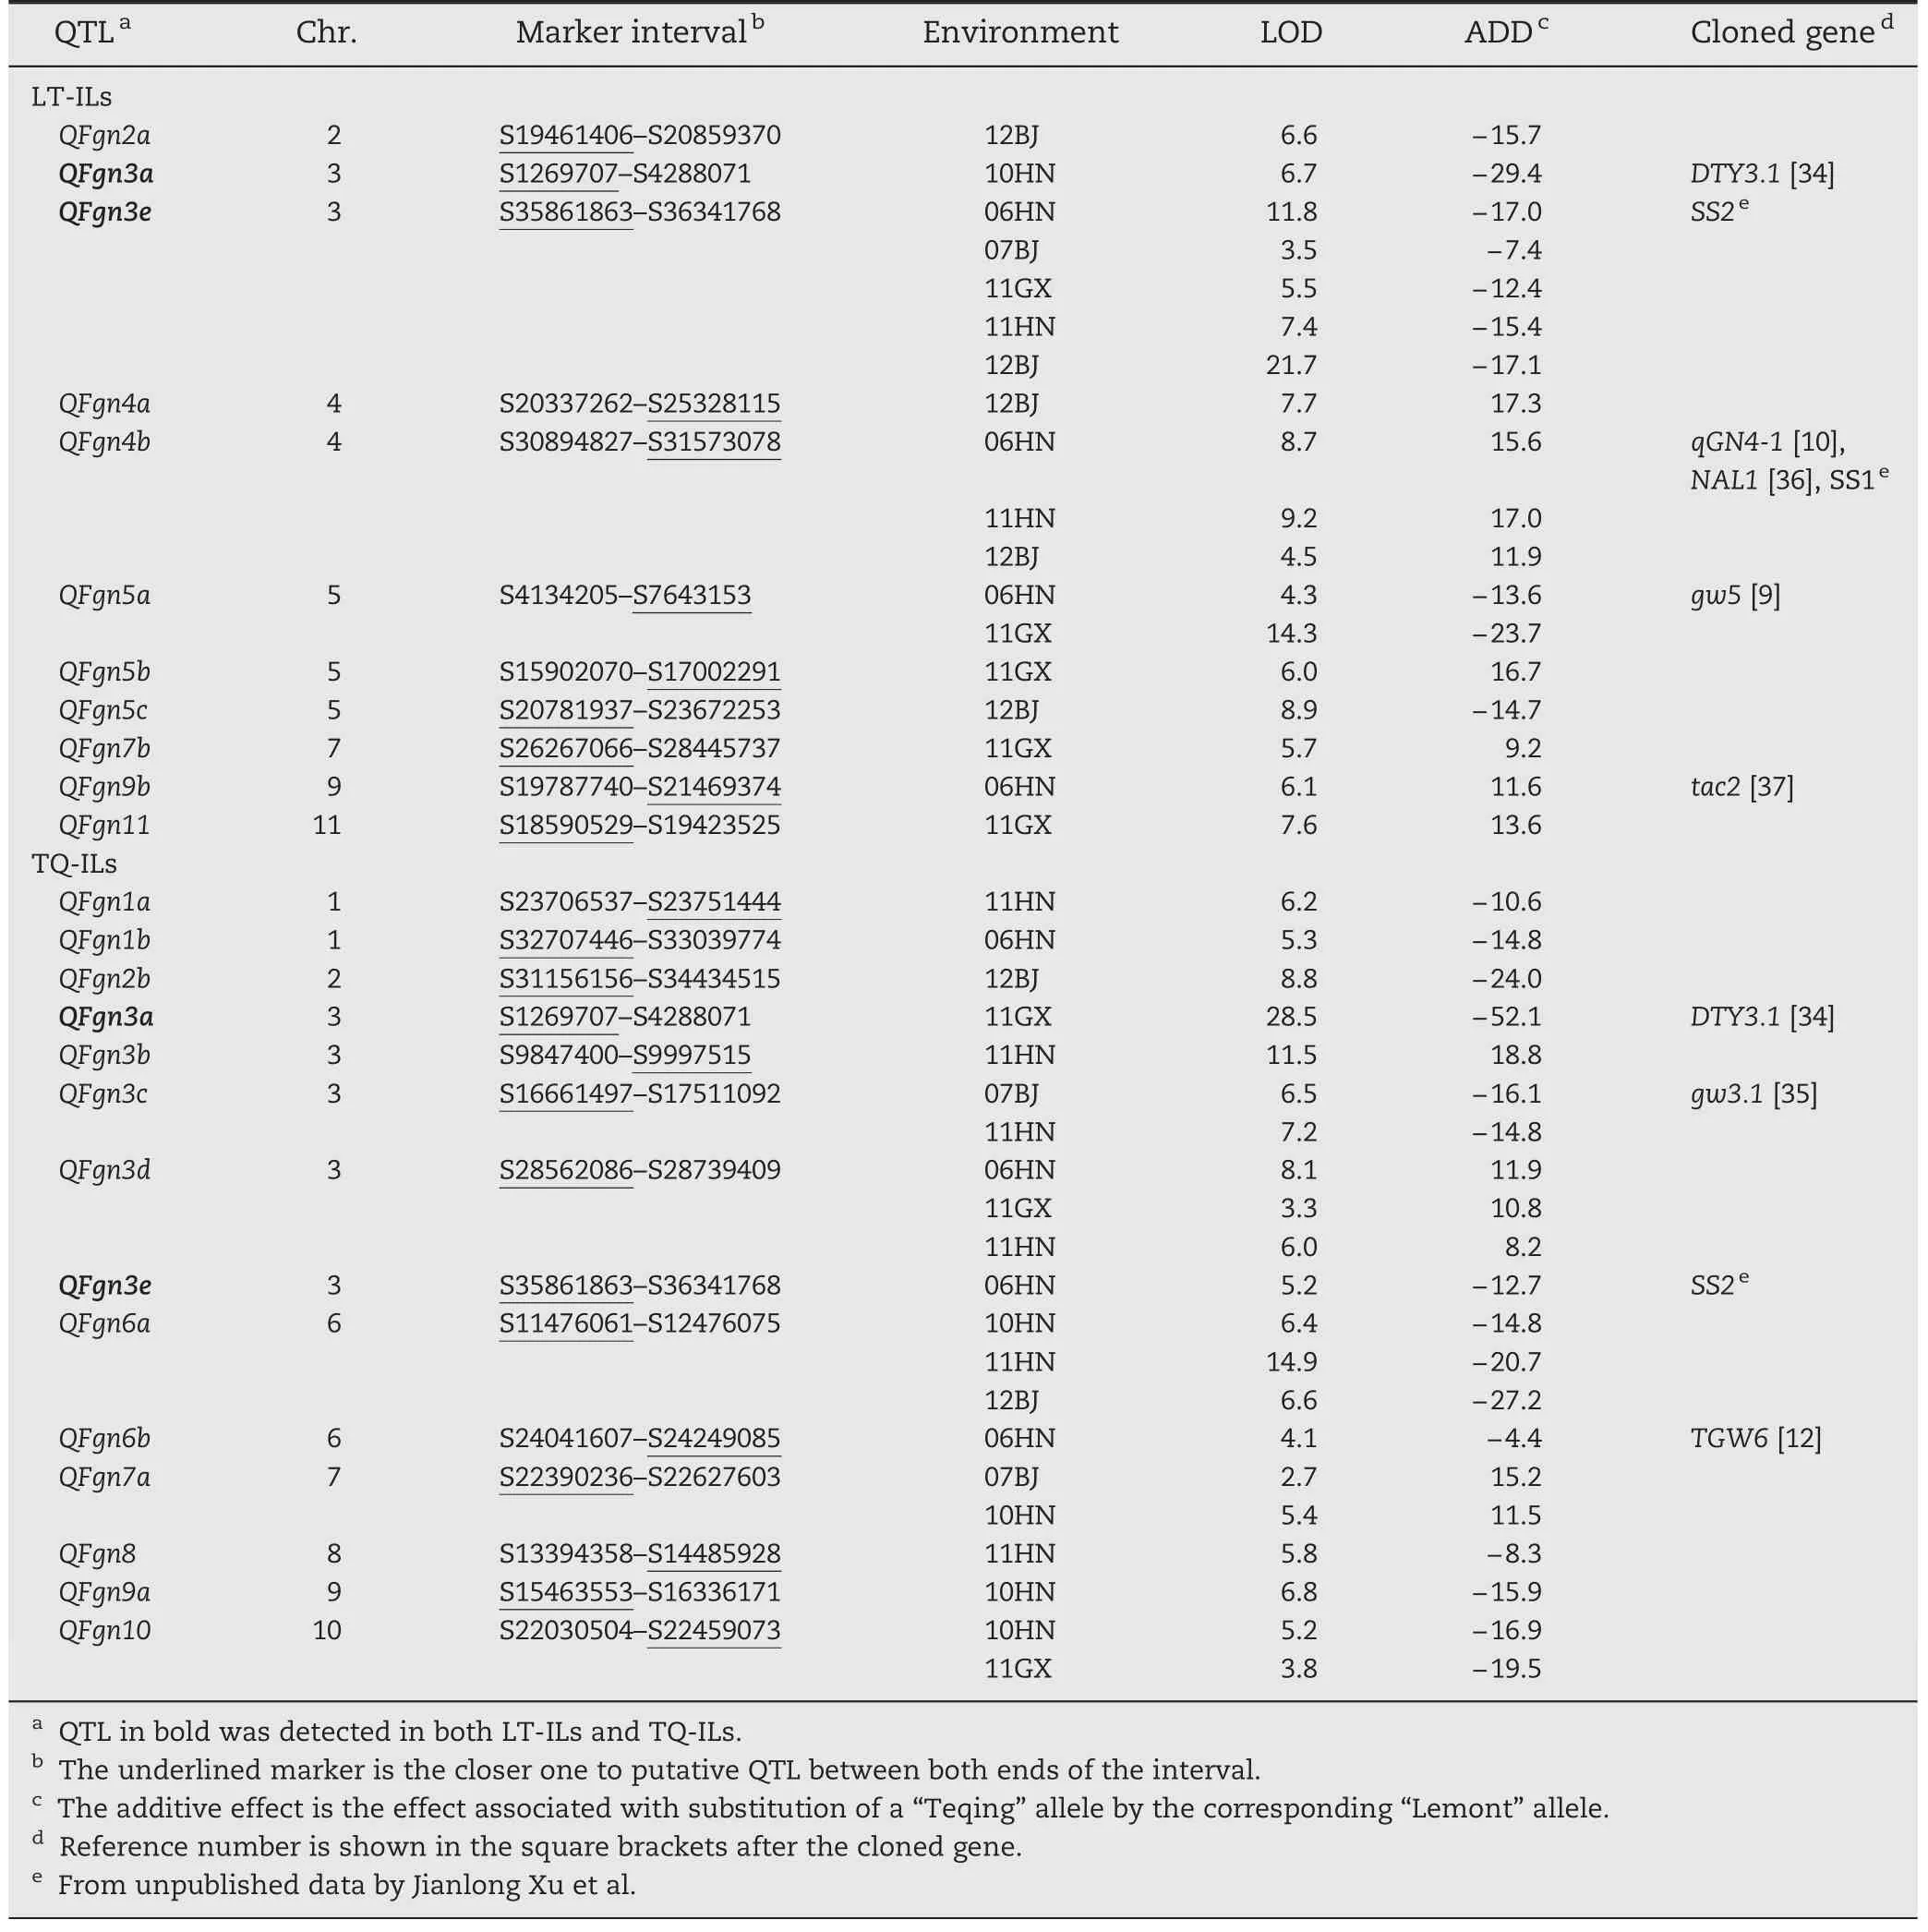
Table 3-QTLs associated with FGN in LT-ILs and TQ-ILs in Beijing(07BJ,12BJ),Hainan(06HN,10HN and 11HN),and Guangxi(11GX).
4.Discussion
4.1.Genetic background (GB) effect of QTL
Most marker-assisted selection (MAS) experiments concern introgression of QTL for improvement of single traits in the GB in which they were originally detected [40,41].The use of several recipient parents is essential to assess the effect of a QTL detected in one population when transferred to unrelated GBs.When several recipient parents were used,the consistency of the QTL effects in the different GBs became less obvious[42,43].So consistency of QTLs effects in different GBs is a major concern for marker-assisted breeding of complex traits.Among the 72 QTLs detected in this study,only 15(20.8%) were detected in both ILs and in both environments,clearly indicating that most QTLs detected in one background were not identified in the other,meaning that the QTLs effects for GY and its component traits were GB-specific.This was in agreement with data showing that only 21% of the QTLs for branch numbers and spikelet number per panicle[16],18.2%of the QTLs for sheath blight resistance[44],15.4%of the QTLs for salt tolerance [17],and 17.9% of the QTLs for drought tolerance[18] were detected in reciprocal ILs derived from the same parents,Lemont and Teqing.Interestingly,the direction of additive effects was consistent for QTL detected in both ILs,indicating that the GB can influence QTL effect without affecting the direction of gene effect[13,15,16,24,44,45].
Compared with QTL,QEI were more sensitive to GB as indicated by the fact that only 4 (16%) of 25 QTLs for FGN,2(11.1%)QTLs of 18 for PN,and 2(6.9%)QTLs of 29 for TGW were simultaneously detected as QEI in the reciprocal backgrounds.Therefore,much attention is needed when QTL mapping information is applied in breeding for yield potential by MAS,as the GBs of breeding populations may be completely different from those of the mapping populations.It is essential for integration of QTL mapping and MAS-based breeding in the same GB as strongly recommended by Tanksley and Nelson [46] and Li et al.[47].In the present study,three QTLs,including QPn2b for PN in the region of S25431871–S26197087 on chromosome 2,QFgn3e for FGN in the region of S35861863–S36341768 on chromosome 3,and QTgw5a for TGW in the region of S25431871–S26197087 on chromosome 5 were consistently detected in the two GBs in the same environment,so they could be applied in MAS for the three yield component traits in the populations derived from Lemont × Teqing.
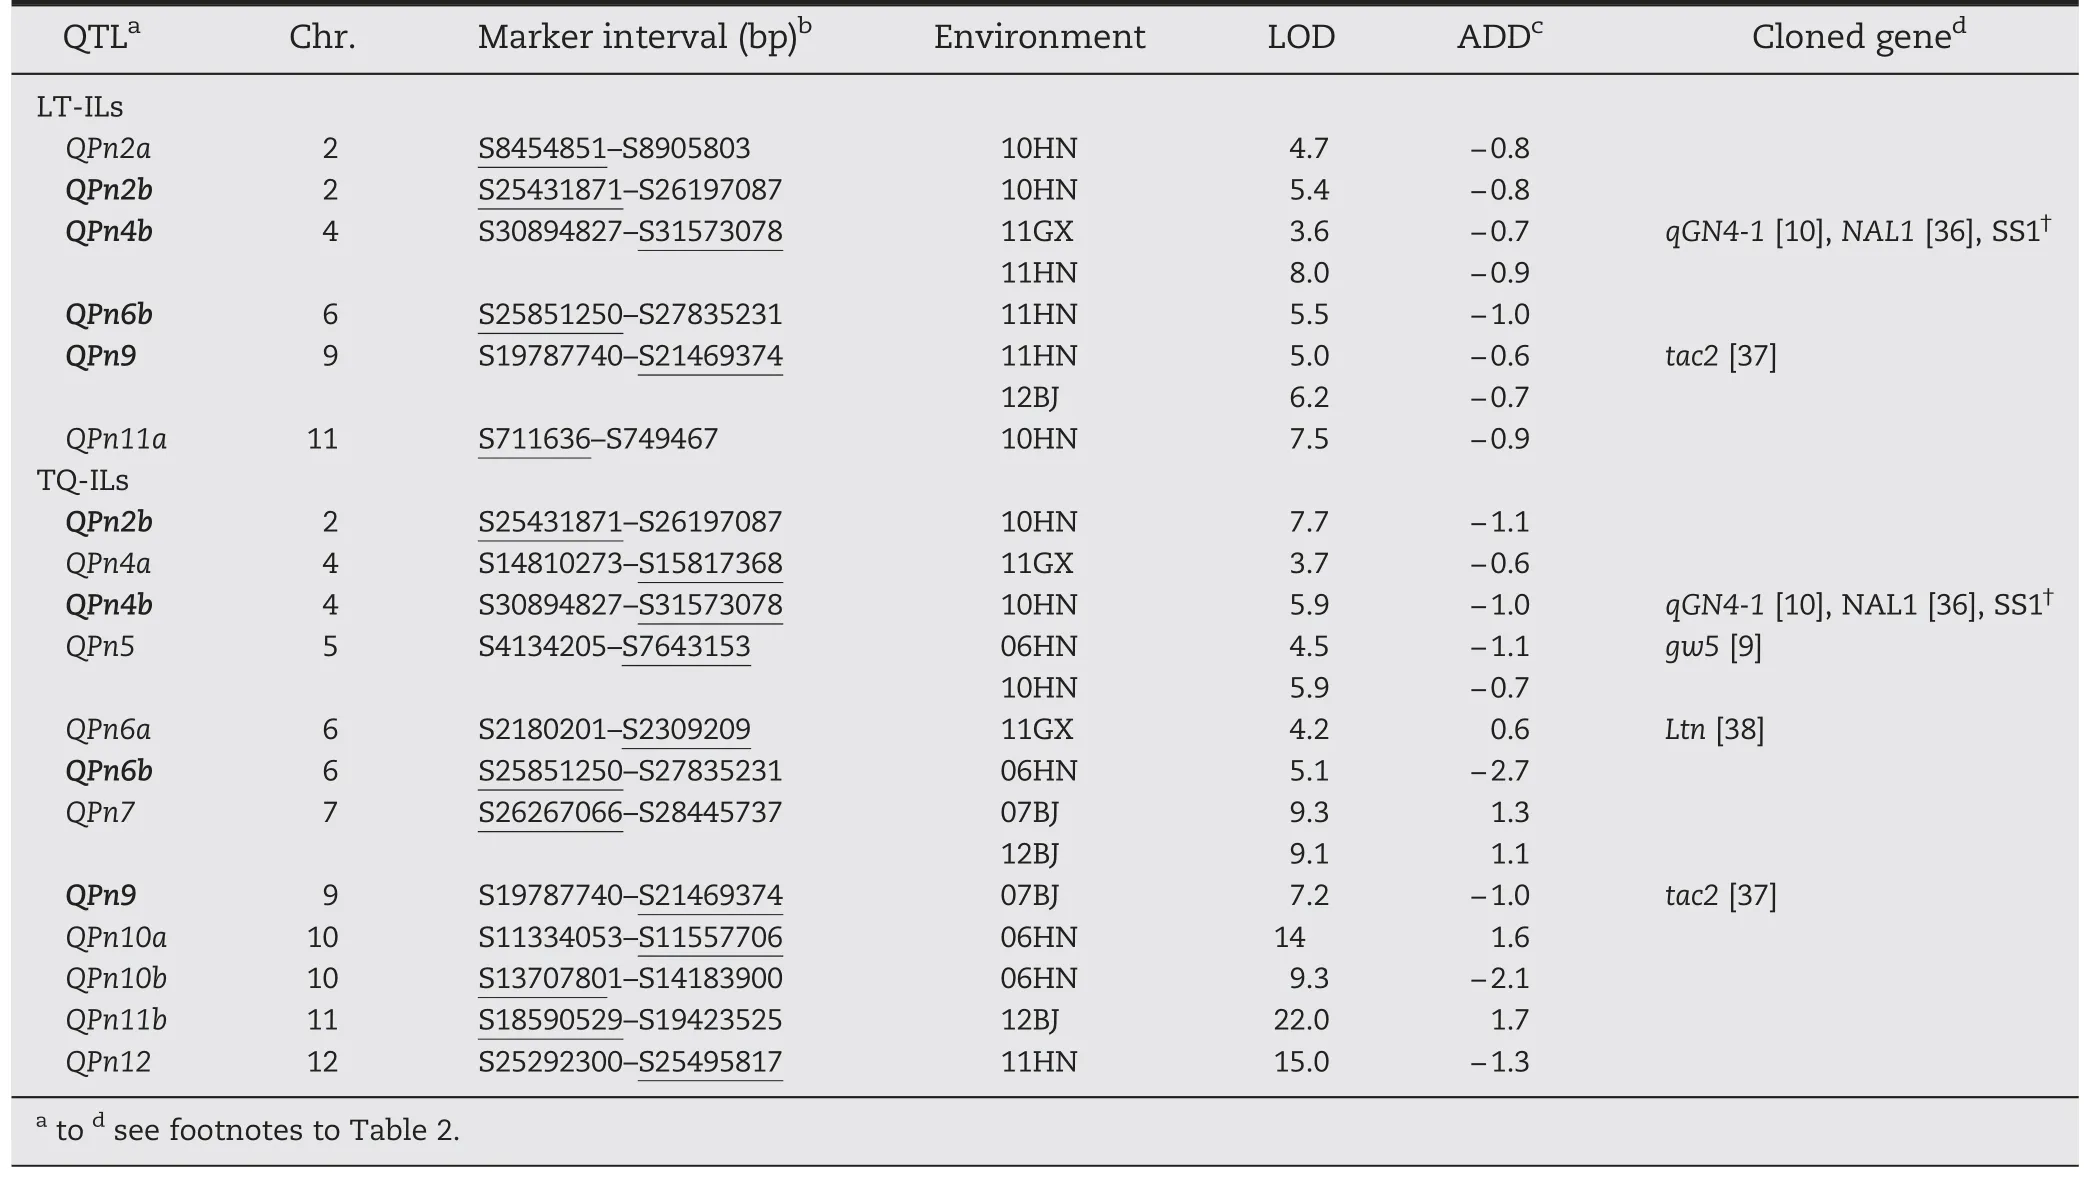
Table 4-QTLs associated with PN in LT-ILs and TQ-ILs in Beijing(07BJ,12BJ),Hainan(06HN,10HN,and 11HN)and Guangxi(11GX).
4.2.QTL × environment interaction (QEI) effect
Quantitative traits are influenced by the environment and tend to show variable degrees of genotype × environment interactions.In most previous studies,QTL × environment interaction was inferred by comparing QTL detected in different environments.This inference about the presence of QTL × environment interaction has two shortcomings.Firstly,individual QTL × environment interaction effects were not properly quantified,largely because of a lack of appropriate analytical methodology,and secondly,because only a single threshold was used in most QTL mapping studies,it remains unknown whether inconsistent QTL detection was due to type-II error arising from the use of single thresholds,or to true differential trait expression across environments.Using a multi-environment joint analysis method in this study,significant QTL × environment interactions were detected for 93.8%,96.4%,95.8%,and 71.6% of QTLs for GY,FGN,PN,and TGW,respectively,suggesting that TGW involves less QTL × environment interaction,and that there is greater control by main-effect QTL for this trait than for GY,FGN and PN.In this study,QEIs mainly arose from (1) a QTL expressed strongly in one environment but weakly in another,or (2) a QTL expressed very differently with opposite effects in different environments (Tables 5,6).The levels of QTL ×environment interaction varied considerably among the QTLs such as QGy3a,QFgn3a,QFgn4b,QFgn5a,QFgn5b,QFgn11,and QTgw4b in LT-background and QGy2a,QGy8,QFgn2b,QFgn3a,QFgn3c,QFgn6a,QFgn7a,QFgn10,QPn4b,QPn6b,QPn11b,and QTgw7 in TQ-background.For QTLs that were more environment-specific,MAS should be applied with caution.
4.3.QTL clusters detected in different GBs
In this study,QTL clusters controlling more than one trait were quite common because of pleiotropy or close linkage.Eight QTL clusters affecting GY and related traits were detected in the two backgrounds in the same or differentenvironments,including the regions of S25431871–S26197087 harboring QGy2a and QPn2b on chromosome 2,S1269707–S4288071 harboring QGy3a,QFgn3a,and QTgw3a on chromosome 3,S16661497–S17511092 harboring QGy3b,QFgn3c,and QTgw3b on chromosome 3,S35861863–S36341768 harboring QGy3c,QFgn3e,and QTgw3c on chromosome 3,S20337262–S25328115 harboring QGy4b,QFgn4a,and QTgw4a on chromosome 4,S4134205–S7643153 harboring QGy5a,QFgn5a,QPn5,and QTgw5a on chromosome 5,S11476061–S12476075 harboring QGy6,QFgn6a,and QTgw6 on chromosome 6,and S20602112–S21083021 harboring QGy10,QFgn10,and QTgw10b on chromosome 10.The Teqing alleles in the above regions on chromosomes 2,5,10 and the region S1269707–S4288071 on chromosome 3 increased GY and its component traits whereas Lemont alleles in the region on chromosome 4 increased GY,FGN and TGW.The parental alleles were inconsistent in the regions S16661497–S17511092 and S35861863–S36341768 on chromosome 3,and S11476061–S12476075 on chromosome 6 in which the Lemont alleles increased TGW but decreased FGN and had inconsistent additive effects on GY.Among
them,four QTL regions affecting GY and its component traits,including S1269707–4288071,S16661497–S17511092 and S35861863–S36341768 on chromosome 3,and S4134205–S7643153 on chromosome 5 coincided with the positions of cloned genes DTY3.1 for grain yield under drought stress conditions [48],gw3.1 for grain weight [35],SS2 for sink-source and grain yield(unpublished data),and gw5 for grain weight [9],respectively.The QTL regions for the above yield-related traits were detected in different mapping populations under varying environments and therefore can be target genomic regions in breeding for high yield potential through MAS.Allelism of the above GY and component trait QTLs identified in this study to the reported
cloned genes will need to be further clarified after fine mapping and cloning of the QTL.

Table 5-QTLs associated with TGW in LT-ILs and TQ-ILs in Beijing (07BJ,12BJ),Hainan (06HN,10HN and 11HN),and Guangxi(11GX).
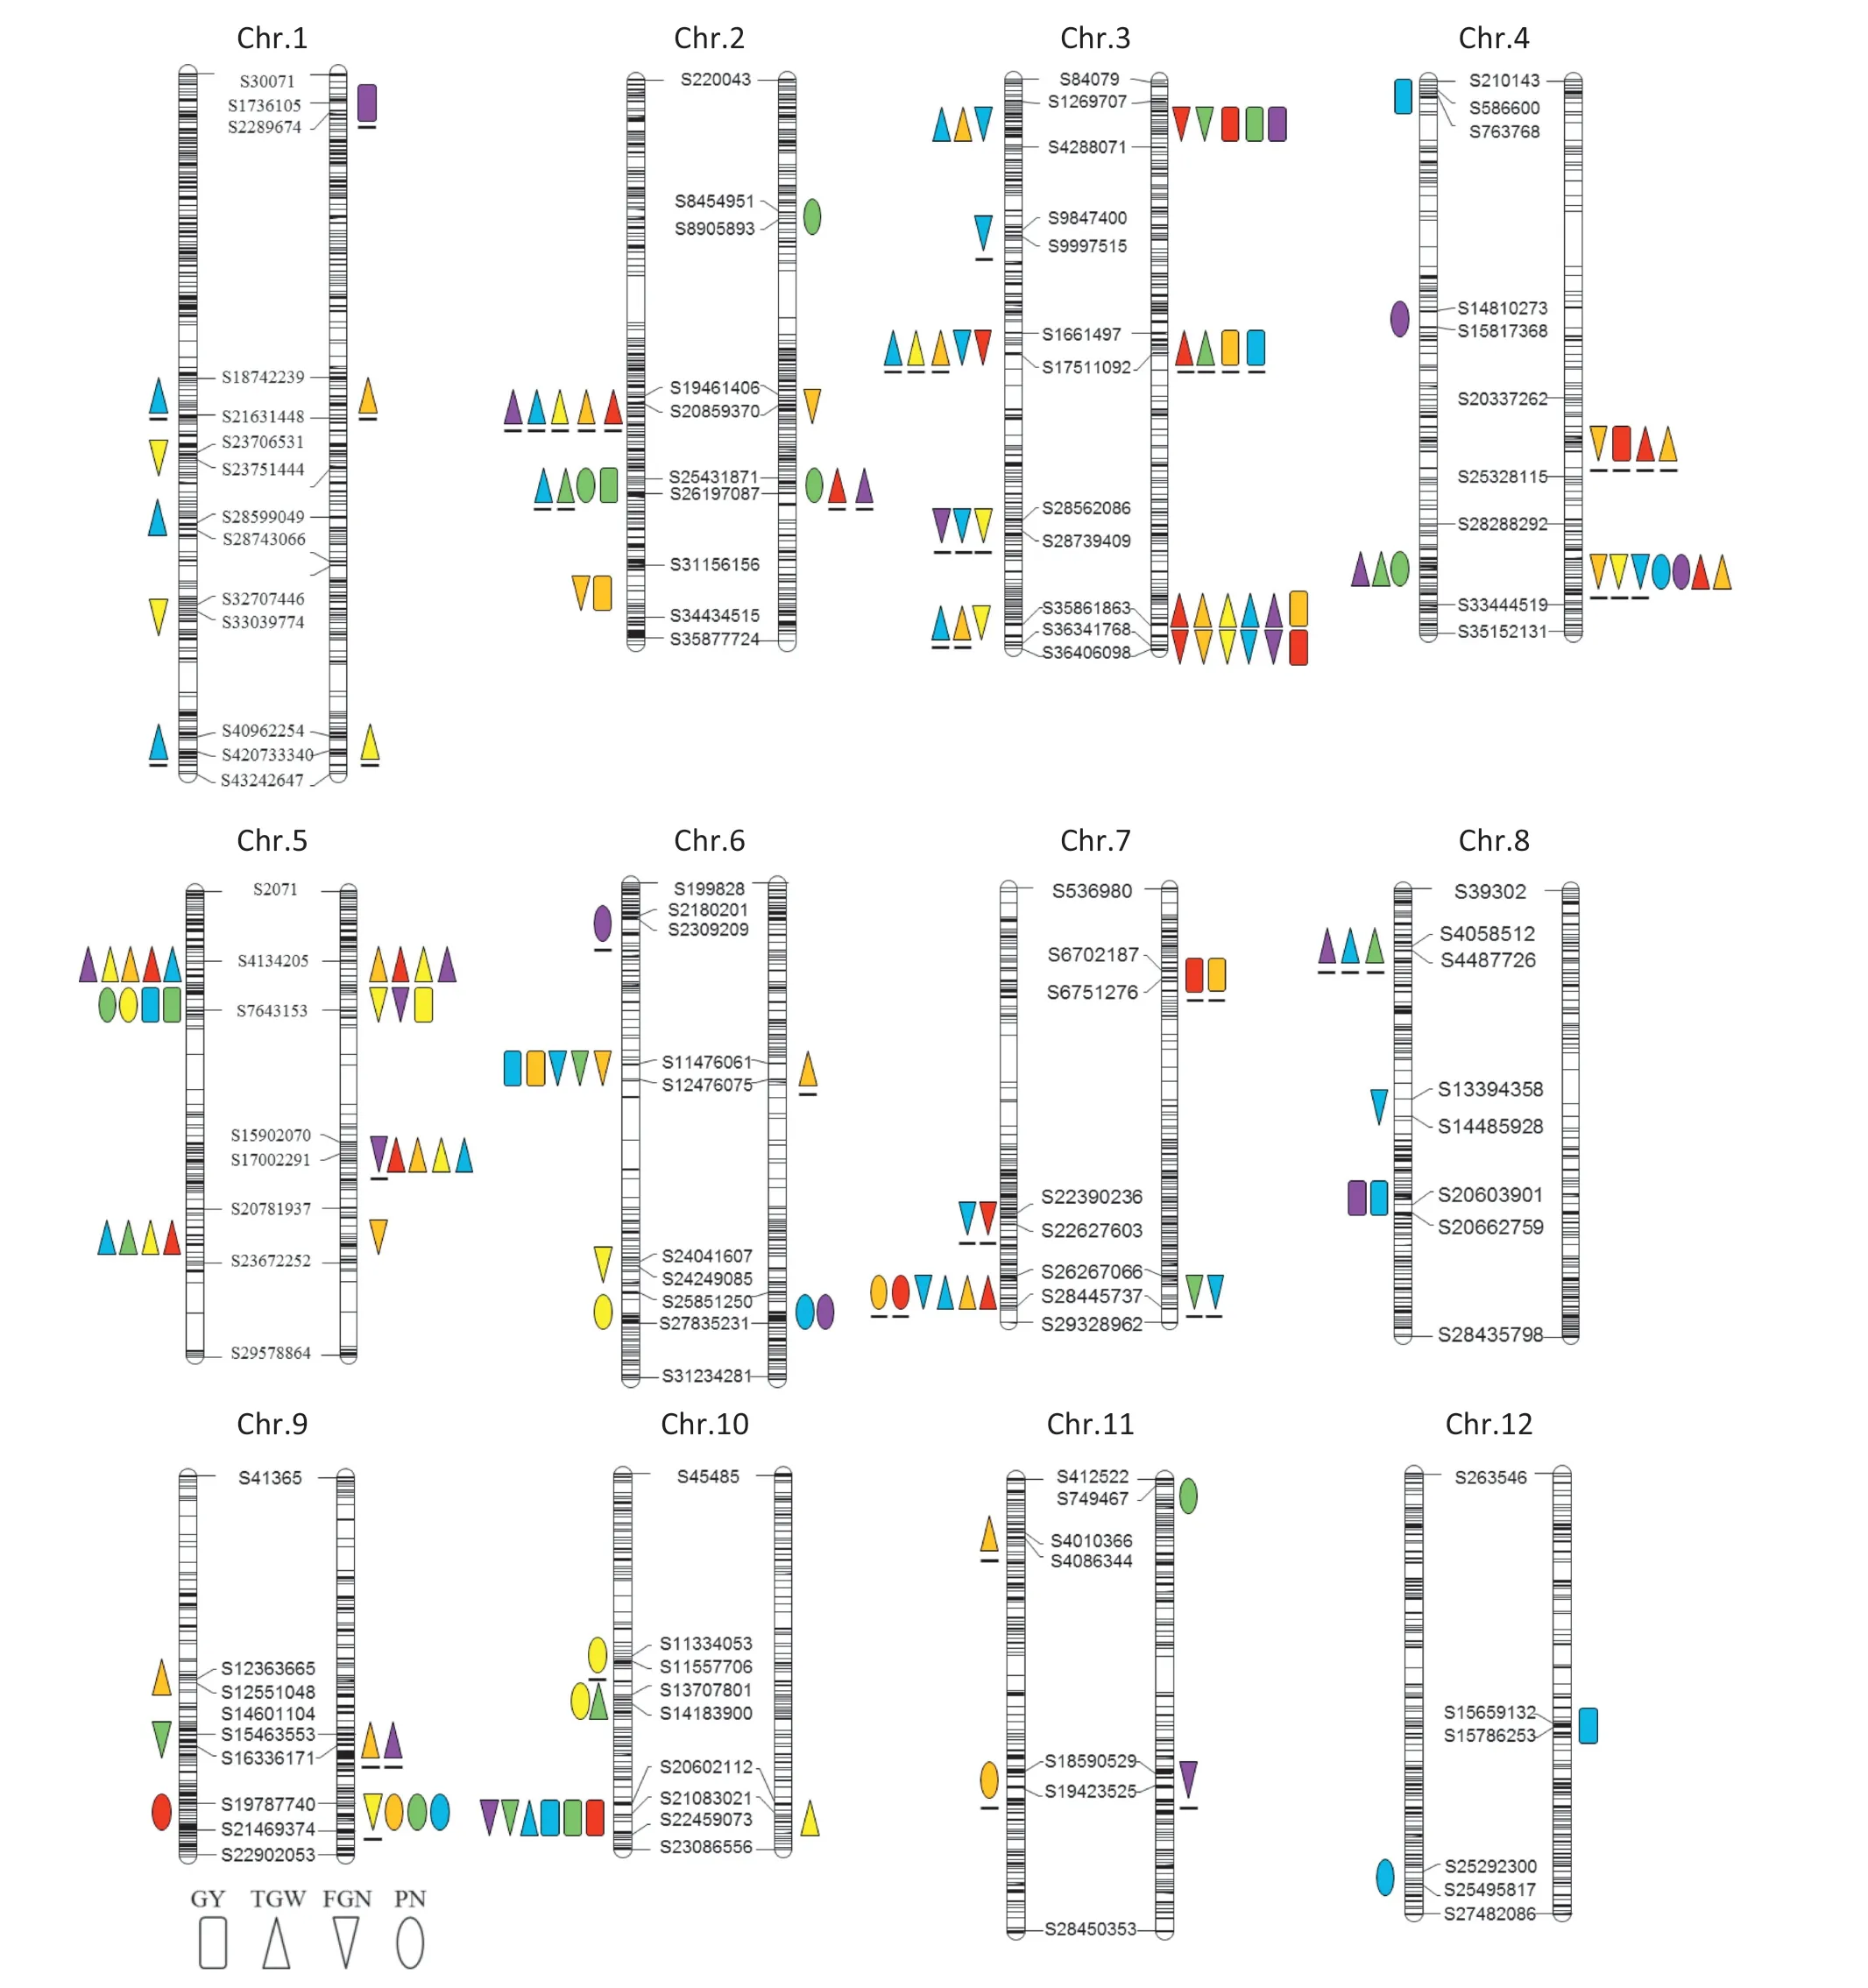
Fig.2-QTLs affecting yield and its component traits detected in LT-ILs(right)and TQ-ILs(left)across six environments.Shapes filled with yellow,red,green,blue,purple,and orange colors represent QTLs detected in 06HN,07BJ,10HN,11HN,11GX,and 12BJ,respectively.Shapes with underline represent alleles with increasing trait values from Lemont.
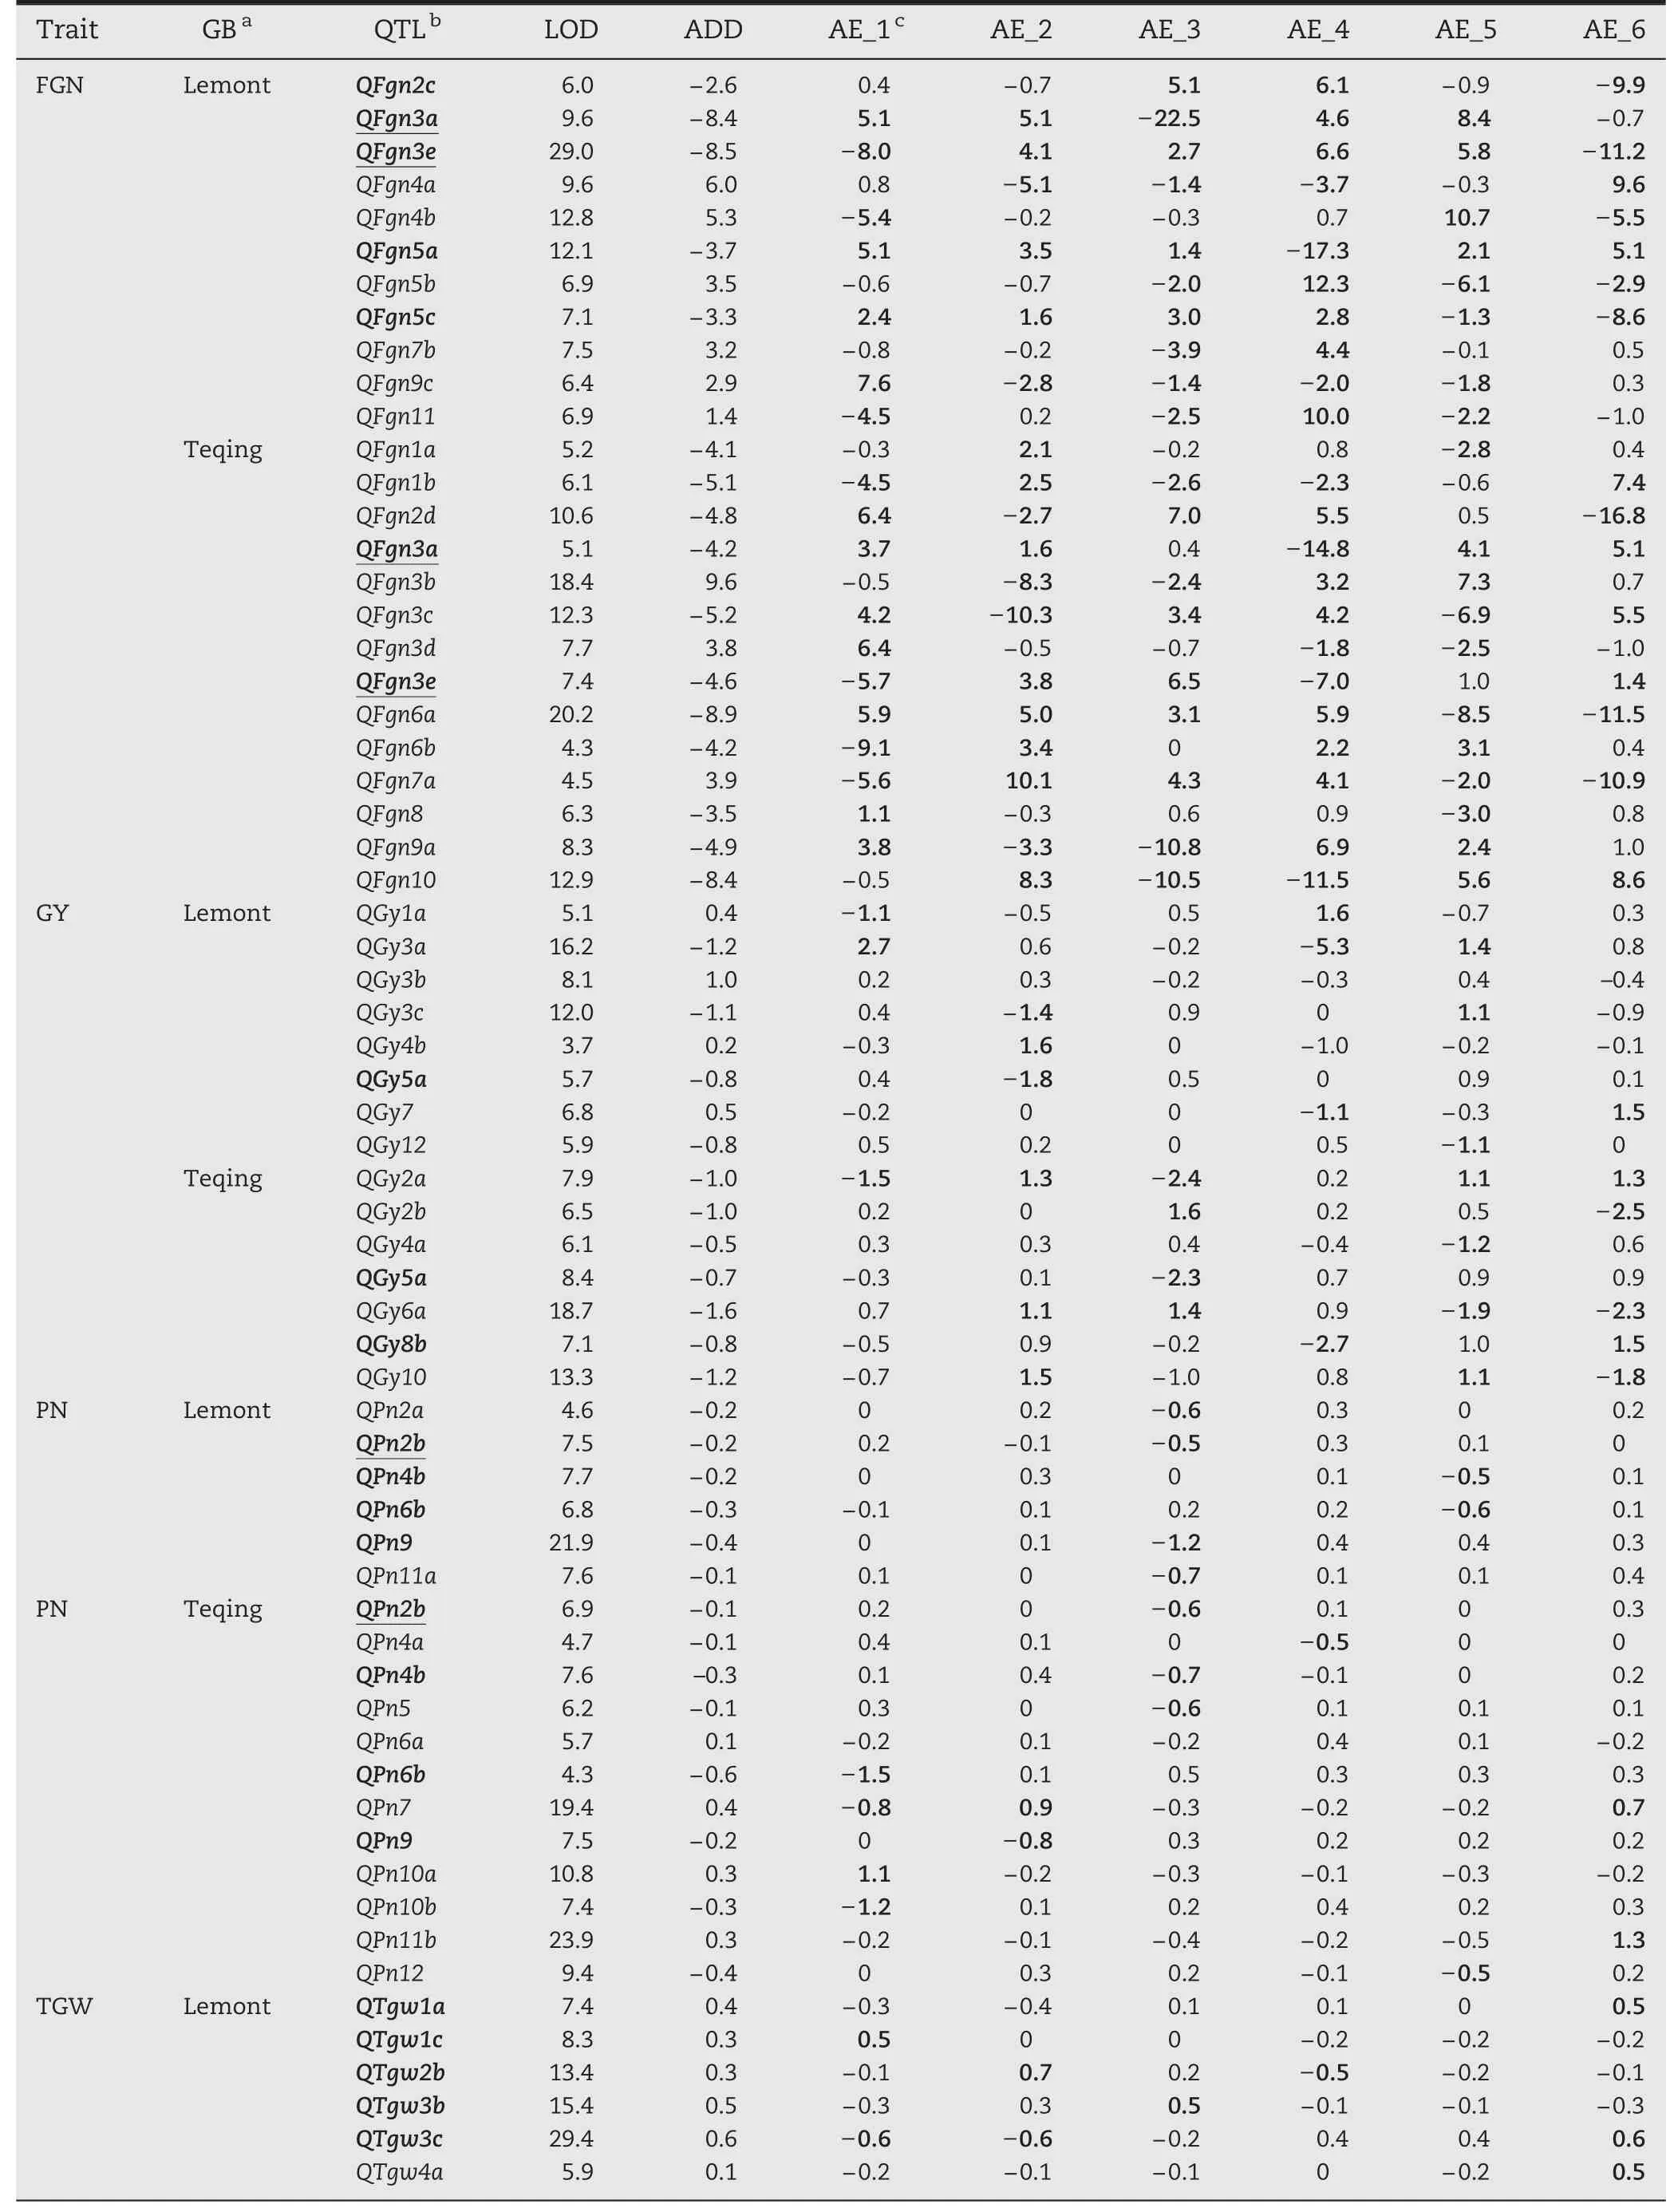
Table 6-QTL × environment interactions affecting yield and its component traits detected in the LT-ILs and TQ-ILs in Beijing(07BJ,12BJ),Hainan(06HN,10HN,and 11HN),and Guangxi(11GX).
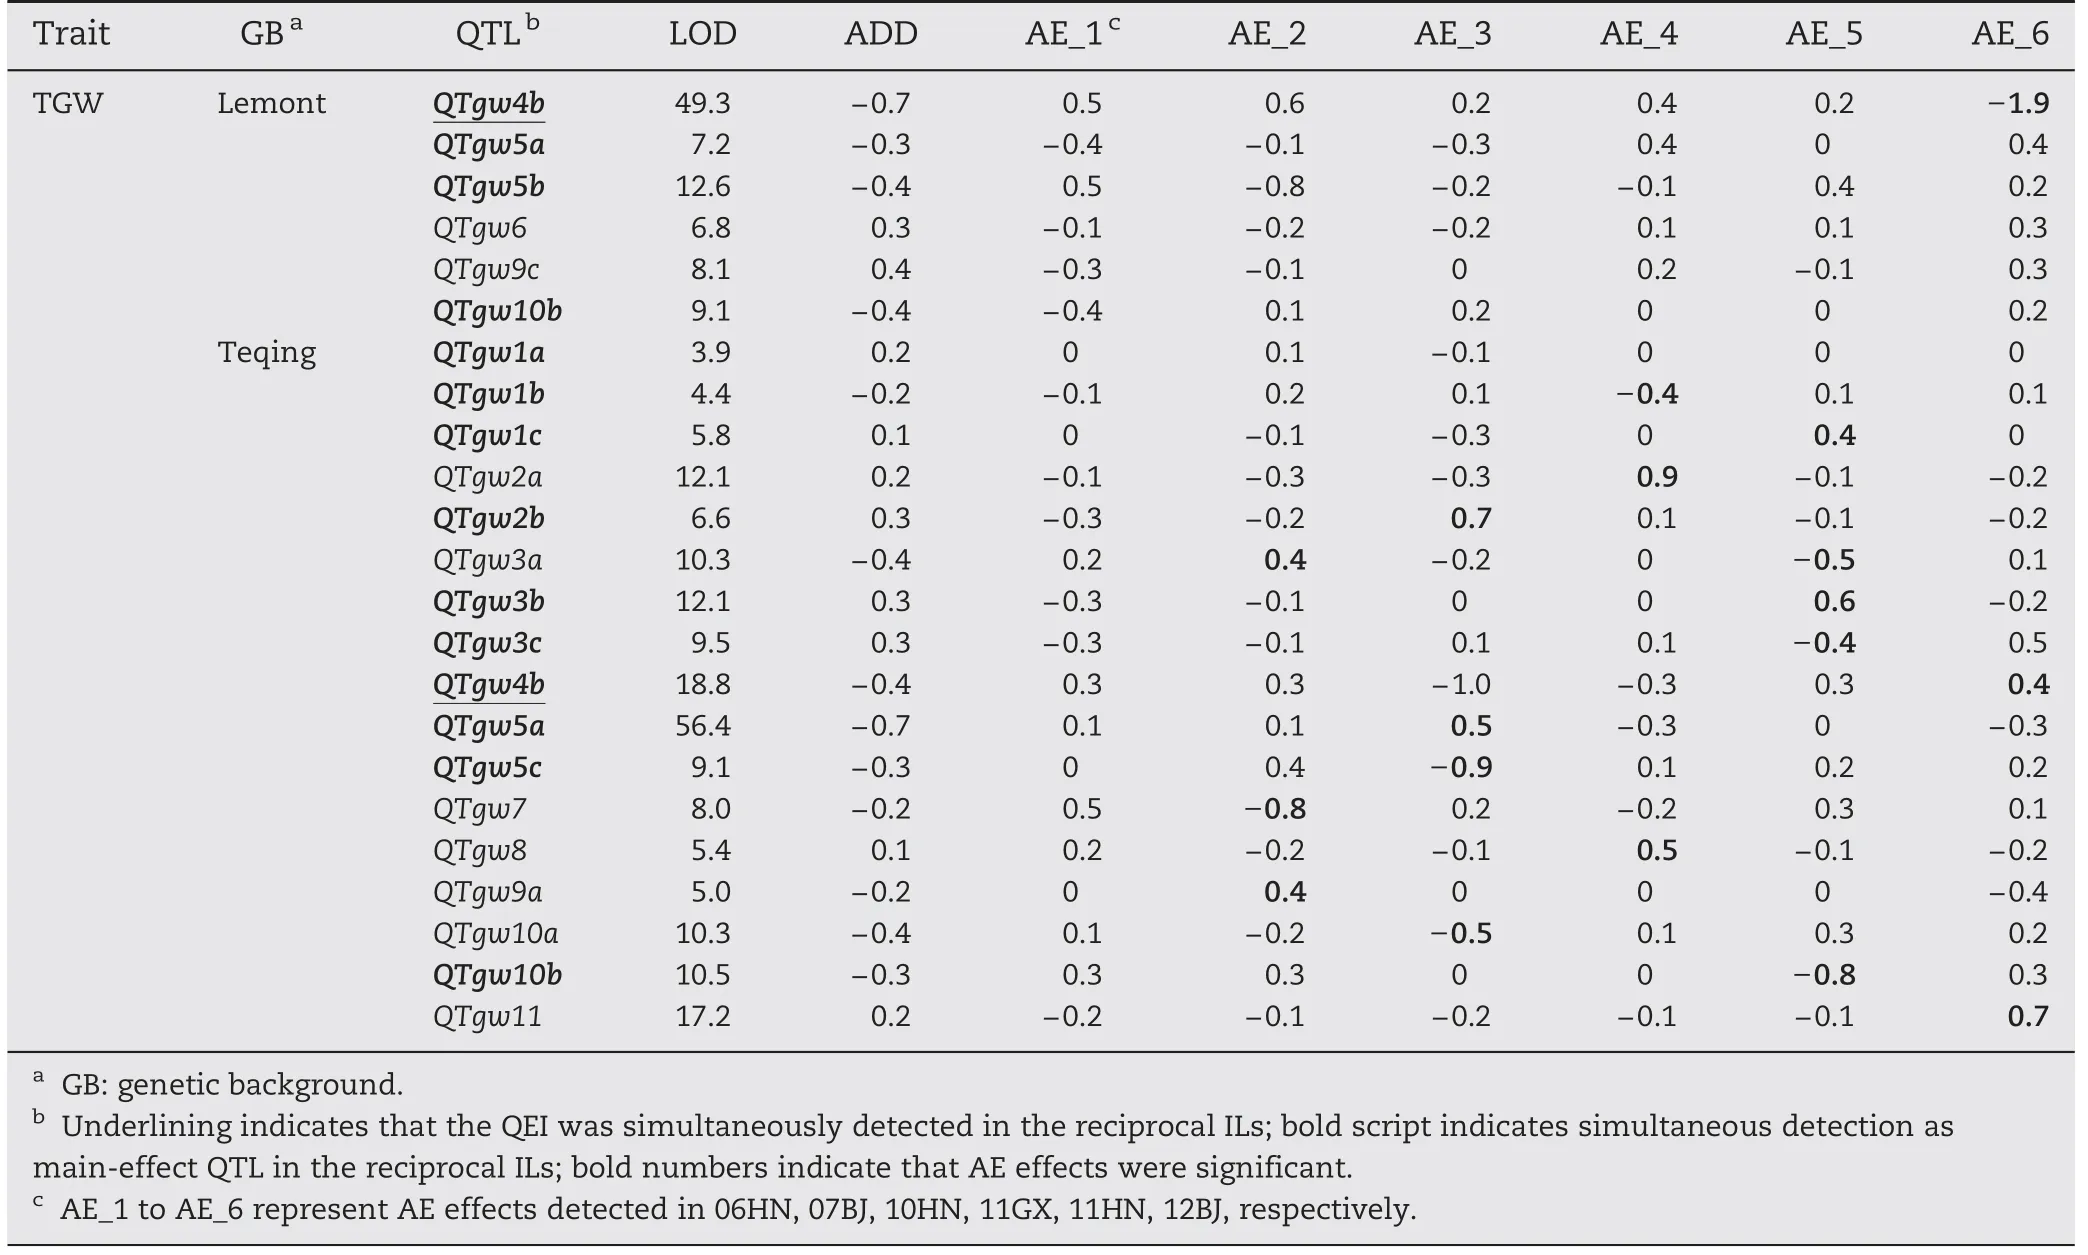
Table 6(continued)
4.4.Implications for breeding high yield potential rice
The efficiency of marker-assisted introgression of QTL from a donor line into a recipient line depends on the stability of QTL expression.Identification of QTL with GB independency and environmental stability is essential because GY and its component traits are sensitive to GB and environment.QFgn3a and QGy3a,QTgw3b and QGy3b,QFgn3e and QGy3c,and QTgw5a and QGy5a were detected in the different populations and represent GB-independent and environmentally stable QTL.They could therefore be used to improve GY indirectly by improving the component traits FGN and TGW by MAS.For example,introgression of the Teqing allele at QTgw5a into Lemont background by MAS could increase TGW thus probably resulting in improved GY.
Apart from main effects of QTL,QTL × environment interaction effects can enhance or counteract phenotype when MAS is applied in a specific environment.For instance,the Teqing alleles at QFgn3e increased FGN and GY in LT-ILs in both the 07BJ and 12BJ environments,but the QTL interaction effect increased FGN in 07BJ and decreased it in 12BJ.So efficacy of introgression of the Teqing allele at QFgn3e into Lemont background for improving FGN could be compromised in 07BJ compared to 12BJ,thus influencing the effectiveness of selection for improved GY in 07BJ.Therefore,for MAS both the QTL main effect and its environment interaction effect should be considered when improving quantitative traits in specific environments.
This research was funded by the National Natural Science Foundation(30570996),the Program of Introducing International Super Agricultural Science and Technology(from the Chinese Ministry of Agriculture(the“948”483 Project,2010-G2B),484 and the Shenzhen Peacock Plan(20130415095710361).
Supplementary material
Supplementary material related to this article can be found online at http://dx.doi.org/10.1016/j.cj.2014.06.004.Table S1 –Information on SNP markers polymorphic between Lemont and Teqing.Table S2 – Significant correlations among the panicle number (PN),1000-grain weight (TGW),filled grain number (FGN),grain yield (GY) in six environments for the reciprocal introgression lines derived from Lemont (LT) ×Teqing (TQ).Table S3 – ANOVA results of the Lemont introgression lines (LT-ILs) and Teqing introgression lines(TQ-ILs)for yield and its related traits.
[1] D.Dawe,S.Pandey,A.Nelson,Emerging trends and spatial patterns of rice production,Rice in the Global Economy:Strategic Research and Policy Issues for Food Security,International Rice Research Institute,Los Banos,Philippines,2010.15–36.
[2] G.S.Khush,What it will take to feed 5.0 billion rice consumers in 2030,Plant Mol.Biol.59(2005) 1–6.
[3] B.Burr,F.A.Burr,Recombinant inbreds for molecular mapping in maize: theoretical and practical considerations,Trends Genet.7(1991) 55–60.
[4] H.X.Lin,H.R.Qian,J.Y.Zhuang,J.Lu,S.K.Min,Z.M.Xiong,N.Huang,K.L.Zheng,RFLP mapping of QTL for yield and related characters in rice (Oryza sativa L.),Theor.Appl.Genet.92(1996) 920–927.
[5] H.W.Mei,Z.K.Li,Q.Y.Shu,L.B.Guo,Y.P.Wang,X.Q.Yu,C.S.Ying,L.J.Luo,Gene actions of QTLs affecting several agronomic traits resolved in a recombinant inbred rice population and two backcross populations,Theor.Appl.Genet.110 (2005) 649–659.
[6] P.Mu,Z.C.Li,C.P.Li,H.L.Zhang,C.M.Wu,C.Li,X.K.Wang,QTL mapping of the root traits and their correlation analysis with drought resistance using DH lines from a paddy and upland rice cross,Chin.Sci.Bull.48 (2003) 2718–2724.
[7] J.H.Tang,X.Q.Ma,W.T.Teng,J.B.Yan,W.R.Wu,J.R.Dai,J.S.Li,Detection of quantitative trait loci and heterotic loci for plant height using an immortalized F2population in maize,Chin.Sci.Bull.52(2007) 477–483.
[8] X.Y.Li,Q.Qian,Z.M.Fu,Y.H.Wang,G.S.Xiong,D.L.Zeng,X.Q.Wang,X.F.Liu,S.Teng,F.Hiroshi,M.Yuan,D.Luo,B.Han,J.Y.Li,Control of tillering in rice,Nature 422 (2003) 618–621.
[9] X.Y.Wan,J.F.Weng,H.Q.Zhai,J.K.Wang,C.L.Lei,X.L.Liu,T.Guo,L.Jiang,N.Su,J.M.Wan,Quantitative trait loci(QTL)analysis for rice grain width and fine mapping of an identified QTL allele gw-5 in a recombination hotspot region on chromosome 5,Genetics 179 (2008) 2239–2252.
[10] R.Deshmukh,A.Singh,N.Jain,S.Anand,R.Gacche,A.Singh,K.Gaikwad,T.Sharma,T.Mohapatra,N.Singh,Identification of candidate genes for grain number in rice (Oryza sativa L.),Funct.Integr.Genomics 10 (2010) 339–347.
[11] C.C.Fan,Y.Z.Xing,H.L.Mao,T.T.Lu,B.Han,C.G.Xu,X.G.Li,Q.F.Zhang,GS3,a major QTL for grain length and weight and minor QTL for grain width and thickness in rice,encodes a putative transmembrane protein,Theor.Appl.Genet.112(2006) 1164–1171.
[12] K.Ishimaru,N.Hirotsu,Y.Madoka,N.Murakami,N.Hara,H.Onodera,T.Kashiwagi,K.Ujiie,B.Shimizu,A.Onishi,H.Miyagawa,E.Katoh,Loss of function of the IAA-glucose hydrolase gene TGW6 enhances rice grain weight and increases yield,Nat.Genet.45(2013) 707–711.
[13] T.Q.Zheng,Y.Wang,A.J.Ali,L.H.Zhu,Y.Sun,H.Q.Zhai,H.W.Mei,Z.J.Xu,J.L.Xu,Z.K.Li,Genetic effects of background-independent loci for grain weight and shape identified using advanced reciprocal introgression lines from Lemont × Teqing in rice,Crop Sci.51(2011)2525–2534.
[14] Z.K.Li,S.R.Pinson,W.D.Park,A.H.Paterson,J.W.Stansel,Epistasis for three grain yield components in rice (Oryza sativa L.),Genetics 145 (1997) 453–465.
[15] C.Y.Liao,P.Wu,B.Hu,K.K.Yi,Effects of genetic background and environment on QTLs and epistasis for rice(Oryza sativa L.) panicle number,Theor.Appl.Genet.103(2001) 104–111.
[16] H.W.Mei,J.L.Xu,Z.K.Li,X.Q.Yu,L.B.Guo,Y.P.Wang,C.S.Ying,L.J.Luo,QTLs influencing panicle size detected in two reciprocal introgressive line (IL) populations in rice (Oryza sativa L.),Theor.Appl.Genet.112 (2006) 648–656.
[17] L.R.Cheng,Y.Wang,L.J.Meng,X.Hu,Y.R.Cui,Y.Sun,L.H.Zhu,J.Ali,J.H.Xu,Z.K.Li,Identification of salt-tolerant QTLs with strong genetic background effect using two sets of reciprocal introgression lines in rice,Genome 55(2012)45–55.
[18] Y.Wang,Q.Zhang,T.Q.Zheng,Y.R.Cui,W.Z.Zhang,J.L.Xu,Z.K.Li,Drought tolerance quantitative trait loci commonly detected in two sets of reciprocal introgression lines in rice,Crop Pasture Sci.65 (2014) 171–184.
[19] S.Jain,D.Marshall,Population studies in predominantly self-pollinating species.X.Variation in natural populations of Avenafatua and A.barbata,Am.Nat.101 (1967) 19–33.
[20] D.J.Li,C.Q.Sun,Y.C.Fu,C.Li,Z.F.Zhu,L.Chen,H.W.Cai,X.K.Wang,Identification and mapping of genes for improving yield from Chinese common wild rice (O.rufipogon Griff.)using advanced backcross QTL analysis,Chin.Sci.Bull.47(2002) 1533–1537.
[21] Y.Xing,Y.Tan,J.Hua,X.Sun,C.Xu,Q.Zhang,Characterization of the main effects,epistatic effects and their environmental interactions of QTLs on the genetic basis of yield traits in rice,Theor.Appl.Genet.105 (2002) 248–257.
[22] R.Baker,Differential Response to Environmental Stress,Sinauer Associates,Inc.,Sunderland MA,1998.492–504.
[23] M.Cooper,G.L.Hammer,Plant Adaptation and Crop Improvement,IRRI,Manila,The Philippines,1996..
[24] Y.C.Cho,J.P.Suh,I.S.Choi,H.C.Hong,M.K.Baek,K.H.Kang,H.P.Moon,QTLs analysis of yield and its related traits in wild rice relative Oryza rufipogon,Treat.Crop Res.4(2003)19–29.
[25] X.Hu,Y.M.Shi,J.Qian,Q.Xu,Y.Wang,K.Chen,Y.Sun,L.H.Zhu,J.L.Xu,Z.K.Li,Analyses of QTLs for rice panicle and milling quality traits and their interaction with environment,Acta Agron.Sin.37(2011)1175–1185(in Chinese with English abstract).
[26] F.Tian,D.J.Li,Q.Fu,Z.F.Zhu,Y.C.Fu,X.K.Wang,C.Q.Sun,Construction of introgression lines carrying wild rice (Oryza rufipogon Griff.) segments in cultivated rice (Oryza sativa L.)background and characterization of introgressed segments associated with yield-related traits,Theor.Appl.Genet.112(2006) 570–580.
[27] Q.Zhang,K.Chen,Y.T.Liang,L.B.Zhang,T.Q.Zheng,J.L.Xu,W.Z.Zhang,Z.K.Li,QTL mapping of sink-source related traits using two sets of reciprocal introgression lines in rice,J.Nucl.Agric.Sci.3(2013)261–271(in Chinese with English abstract).
[28] J.L.Xu,Molecular mapping of quantitative trait loci using recombinant inbred lines and near-isogenic introgression lines in rice(Oryza sativa L.),PhD Dissertation Zhejiang University,Hangzhou,China,2001.(in Chinese with English abstract).
[29] C.Wei,H.D.Chen,T.Q.Zheng,R.B.Yu,W.B.Terzaghi,Z.K.Li,X.W.Deng,J.L.Xu,H.He,A high-density SNP genotyping array for rice biology and molecular breeding,Mol.Plant 7(2014) 541–553.
[30] Statistical Analysis Systems,SAS User's Guide,Version 8.1 2000.
[31] J.K.Wang,H.H.Li,L.Y.Zhang,L.Meng,Users'Manual of QTL IciMapping v3.3,2013.
[32] Y.Zhang,Y.X.Li,Y.Wang,Z.Z.Liu,C.Liu,B.Peng,W.W.Tan,D.Wang,Y.S.Shi,B.C.Sun,Y.C.Song,T.Y.Wang,Y.Li,Stability of QTL across environments and QTL-byenvironment interactions for plant and ear height in maize,Agric.Sci.China 9(2010) 1400–1412.
[33] International Rice Genome Sequencing Project,The map-based sequence of the rice genome,Nature 436 (2005)793–800.
[34] P.M.Visscher,R.Thompson,C.S.Haley,Confidence intervals in QTL mapping by bootstrapping,Genetics 143 (1996)1013–1020.
[35] J.Li,M.Thomson,S.R.McCouch,Fine mapping of a grain-weight quantitative trait locus in the pericentromeric region of rice chromosome 3,Genetics 168 (2004)2187–2195.
[36] T.Toshiyuki,A.Shunsuke,T.S.Fumio,S.A.Yumiko,I.Norio,Y.Satoshi,H.Sakiko,T.Yojiro,Y.Utako,J.Z.Wu,M.Takashi,S.Kazuhiko,K.Katsuhiko,I.Takashi,A.Tsuyu,K.Izumi,I.Sachie,S.Ayahiko,O.Taiichiro,H.Tadashi,A natural variant of NAL1,selected in high-yield rice breeding programs,pleiotropically increases photosynthesis rate,Sci.Rep.3(2013) 2149.
[37] L.K.Fang,X.C.Sang,Z.L.Yang,Y.H.Lin,N.Wan,G.H.He,Genetic analysis and gene mapping of a rice tiller angle mutant tac2,Rice Sci.16(2009) 323–326.
[38] D.Fujita,L.A.Ebron,E.Araki,H.Kato,G.S.Khush,J.E.Sheehy,T.Lafarge,Y.Fukuta,N.Kobayashi,Fine mapping of a gene for low-tiller number,Ltn,in japonica rice (Oryza sativa L.)variety Aikawa 1,Theor.Appl.Genet.120 (2010) 1233–1240.
[39] X.J.Wei,J.F.Xu,H.N.G.L.Jiang,S.H.Chen,C.Y.Yu,Z.L.Zhou,P.S.Hu,H.Q.Zhai,J.M.Wan,DTH8 suppresses flowering in rice,influencing plant height and yield potential simultaneously,Plant Physiol.153 (2010) 1747–1758.
[40] N.Ahmadi,L.Albar,G.Pressoir,A.Pinel,D.Fargette,A.Ghesquière,Genetic basis and mapping of the resistance to rice yellow mottle virus: III.Analysis of QTL efficiency in introgressed progenies confirmed the hypothesis of complementary epistasis between two resistance QTLs,Theor.Appl.Genet.103 (2001) 1084–1092.
[41] R.Berloo,H.Aalbers,A.Werkman,R.E.Niks,Resistance QTL confirmed through development of QTL-NILs for barley leaf rust resistance,Mol.Breed.8 (2001) 187–195.
[42] A.M.Sebolt,R.C.Shoemaker,B.W.Diers,Analysis of a quantitative trait locus allele from wild soybean that increases seed protein concentration in soybean,Crop Sci.40(2000) 1438–1444.
[43] G.G.Yousef,J.A.Juvik,Enhancement of seedling emergence in sweet corn by marker-assisted backcrossing of beneficial QTL,Crop Sci.42(2002) 96–104.
[44] X.W.Xie,M.R.Xu,J.P.Zang,Y.Sun,L.H.Zhu,J.L.Xu,Y.L.Zhou,Z.K.Li,Genetic background and environmental effects on QTL for sheath blight resistance revealed by reciprocal introgression lines in rice,Acta Agron.Sin.34 (2008)1885–1893 (in Chinese with English abstract).
[45] J.Yang,Y.Sun,L.R.Cheng,Z.Zhou,Y.Wang,L.H.Zhu,J.Cang,J.L.Xu,Z.K.Li,Genetic background effect on QTL mapping for salt tolerance revealed by a set of reciprocal introgression line populations in rice,Acta Agron.Sin.35(2009) 974–982 (in Chinese with English abstract).
[46] S.Tanksley,J.Nelson,Advanced backcross QTL analysis: a method for the simultaneous discovery and transfer of valuable QTLs from unadapted germplasm into elite breeding lines,Theor.Appl.Genet.92 (1996) 191–203.
[47] Z.K.Li,B.Y.Fu,Y.M.Gao,J.L.Xu,J.Ali,H.R.Lafitte,Y.Z.Jiang,J.D.Rey,C.H.M.Vijayakumar,R.Maghirang,T.Q.Zheng,L.H.Zhu,Genome-wide introgression lines and their use in genetic and molecular dissection of complex phenotypes in rice (Oryza sativa L.),Plant Mol.Biol.59(2005) 33–52.
[48] R.Venuprasad,C.O.Dalid,M.D.Valle,D.Zhao,M.Espiritu,M.T.Cruz,M.Amante,A.Kumar,G.N.Atlin,Identification and characterization of large-effect quantitative trait loci for grain yield under lowland drought stress in rice using bulk-segregant analysis,Theor.Appl.Genet.120(2009)177–190.
- The Crop Journal的其它文章
- Maize forage aptitude: Combining ability of inbred lines and stability of hybrids
- Molecular detection of Xanthomonas oryzae pv.oryzae,Xanthomonas oryzae pv.oryzicola,and Burkholderia glumae in infected rice seeds and leaves
- Growth,photosynthesis and nitrogen metabolism in soybean varieties after exclusion of the UV-B and UV-A/B components of solar radiation
- Differences between soybean genotypes in physiological response to sequential soil drying and rewetting
- Mapping and validation of a dominant salt tolerance gene in the cultivated soybean(Glycine max) variety Tiefeng 8
- Brief Guide for Authors

