双电层电容器电化学阻抗谱的实验研究
孙现众 黄 博 张 熊 张大成 张海涛 马衍伟
(中国科学院电工研究所应用超导重点实验室,北京100190)
1 Introduction
Electrochemical impedance spectroscopy(EIS)is a powerful tool to study the electrochemical behaviors of electrical double layer capacitors(EDLCs).1,2EDLC stores electrostatic energy in a polarized electrode/electrolyte interface layer.Fig.1(a)shows the schematic structure of an EDLC,containing two electrodes which are separated from electric contact by a porous separator.Both electrodes and separator are immersed in an electrolyte,which allows the flow of the ionic current between the electrodes and through the separator.Active materials(e.g.,activated carbon,AC),conductive additives,and polymer binder are used for electrode construction.
The ideal Nyquist plot of impedance spectra for an EDLC includes a straight line with a slope of close to 45°at high-middle frequency region and an almost vertical line at low frequency range,3as shown in Fig.1(b).The inclined 45°line is ascribed to the consequence of the distributed resistance and capacitance in porous carbon electrode,which is called the transmission line model with pore size distribution(TLM-PSD).4-6The nearly vertical line at low frequency range is a typical capacitive feature of EDLCs.The slight deviation from the ideal vertical line can be interpreted as a result from the pore size distribution of porous carbon materials.5However,in our previous works we have noticed that semicircle loops at high frequency regions exist for the AC-based EDLCs with both aqueous and nonaqueous electrolytes,7-9which are different from the classic Nyquist plots.This semicircle loop can also be observed in literature published by several other groups as well.10-16Various hypotheses have been proposed to explain the cause of this semicircle loop:(i)the porous structures of AC electrode with complex network of distributed capacitive and resistive elements;(ii)the charge transfer resistance of possible pseudocapacity and kinetic leakage processes,due to the interfacial redox reactions of impurities and surface functional groups;(iii)interfacial resistance between current collector and AC electrode;and(iv)inter-particle contact resistance(i.e.,ACAC orAC-conductive additives).10,14,17,18

Fig.1 (a)Schematic structure of an EDLC;(b)ideal and experimental Nyquist plots of impedance spectra for EDLCs
In the present work,an equivalent model based on TLM-PSD model is proposed for EDLCs and depicted in the inset of Fig.1(b).19,20In Nyquist plot,the intercept of the curve at high frequency region is ascribed toRs,representing the device series resistance including intrinsic resistance of electrolyte,separator and Ohmic resistance of current collector.10The slope line close to 45°at middle frequency region and the slope line close to 90°at low frequency region can be explained by the TLM-PSD model.Correspondingly,the semicircle loop at high frequency region is attributed toRcandCc,which are ascribed to the contact resistance and the contact capacitance between particles(AC-AC or AC-conductive additives),and between AC electrode and current collector.Moreover,the influences of several factors on the EIS spectra of EDLCs,especially on the semicircle loops,have been extensively examined.The factors are charging process,active material,conductive additive,polymer binder,nonaqueous electrolyte,porous separator,mass loading,and exerted pressure on electrode.
2 Experimental
2.1 Materials
Commercially available AC powders were purchased from Dachaolin Co.(DCL,China)and Kuraray Chemical Co.(YP-50F,Japan),and were used without further treatment.Carbon black(CB)powders(Super C45,from Timcal,Switzerland)served as conductive additives.Sodium carboxymethl cellulose(CMC,from Nippon Paper Group,Japan)and styrene-butadiene rubber(SBR,from JSR,Japan)were adopted as binders.Three types of electrolytes were used in this work.1 mol∙L-1tetraethylammonium tetrafluoroborate in acetonitrile(TEABF4/AN,denoted as AN)and 1 mol∙L-1tetraethylammonium tetrafluoroborate in propylene carbonate(TEABF4/PC,denoted as PC)were purchased from Capchem Co.,China.1 mol∙L-1triethylmethylammonium tetrafluoroborate in mixed solvent of acetonitrile and propylene carbonate(1:1 in mass ratio)(MeEt3NBF4/(AN+PC),denoted as ME)was provided by Chemical Reagent Beijing Co.,China.An etched aluminum foil(20 μm in thickness,from JCC,Japan)served as a current collector.TF4030(30µm in thickness,from NKK,Japan),TF4050(50µm in thickness,from NKK,Japan),and Celgard 2400(25µm in thickness,from Celgard Co.,USA)were chosen as separators.
2.2 Electrode preparation
AC powders,conductive additives,and binder were mixed with deionized water by a ball milling process to obtain homogeneous slurry.Then the slurry was coated onto aluminumfoils by a doctorblade and dried thoroughly at 80 °C.Rectangle pieces(35 mm ×40 mm)were punched out from the electrodes and then assembled into a sandwich-type two-electrode cell with the AC electrodes separated by a separator.The assembly was inserted into an aluminum-plastic soft package.After electrolyte was added in a glove box(MBraun,Germany)in which the content of water and oxygen were no more than 0.1 μL∙L-1,the soft package was sealed under vacuum.Mass loadings of the two electrodes in one cell were equal.The capacitor parameters in each experiment were shown in Table 1.
2.3 Characterization
Electrochemical impedance spectroscopy was carried out using an Autolab PGSTAT302N electrochemistry station.The EIS spectra of cells were obtained in the frequency range from 10-2to 105Hz at the open-circuit voltage(Voc)of 0 V,and the amplitude of AC signal was 5 mV.The galvanostatic charge-discharge measurement was performed using an Arbin MSTAT 4 system.Electronic conductivity of AC powder was measured on a compacted pellet(contain 2%(w)poly(tetrafluoroethylene))by standard four-probe resistance using physical property measurement system(PPMS).The carbon species on the surface of AC electrodes were studied by X-ray photoelectron spectroscopy(XPS)measurements on a PHI-5300 spectrometer at 1.9×10⁻⁶Pa usingAlKαradiation.
3 Results and discussion
3.1 Charging process
Firstly,the cells were charged and discharged for 10 cycles at a current density of 0.1A∙g-1with various cut-off voltages of 2.4-3.1 V,respectively.Then,EIS measurements were conducted with the open-circuit voltage of 0 V for each cell.Fig.2 shows the effect of charging process on impedance spectra.It is observed that the size of the high-frequency semicircle loop increases obviously with the increase of charging cut-off voltage.Meanwhile,the near-vertical line deviates increasingly from the ideal angle.These impedance behaviors are the characteristic of electrochemical fading which can be explained by the decomposition reactions of the trace water and the electrolyte under the catalysis of AC with oxygen-containing functional groups at the cell voltage higher than 2.5 V.21-23For example,anion ioncan be oxidized to BFxin the presence of water and oxygenated surface functionalities on AC surface.23These processes may lead to a partial surface passivation of the electrodes and an increase in the contact resistance.24When the voltage cut-off increases,the passivation effects enhance accordingly.
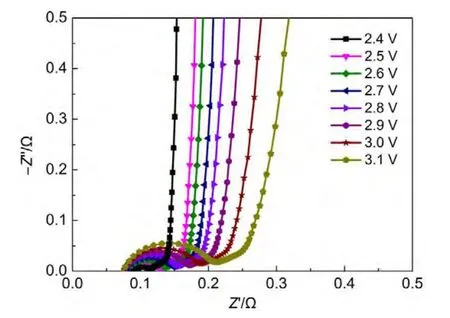
Fig.2 Nyquist plots of cells with various charging cut-off voltages from 2.4 to 3.1 V
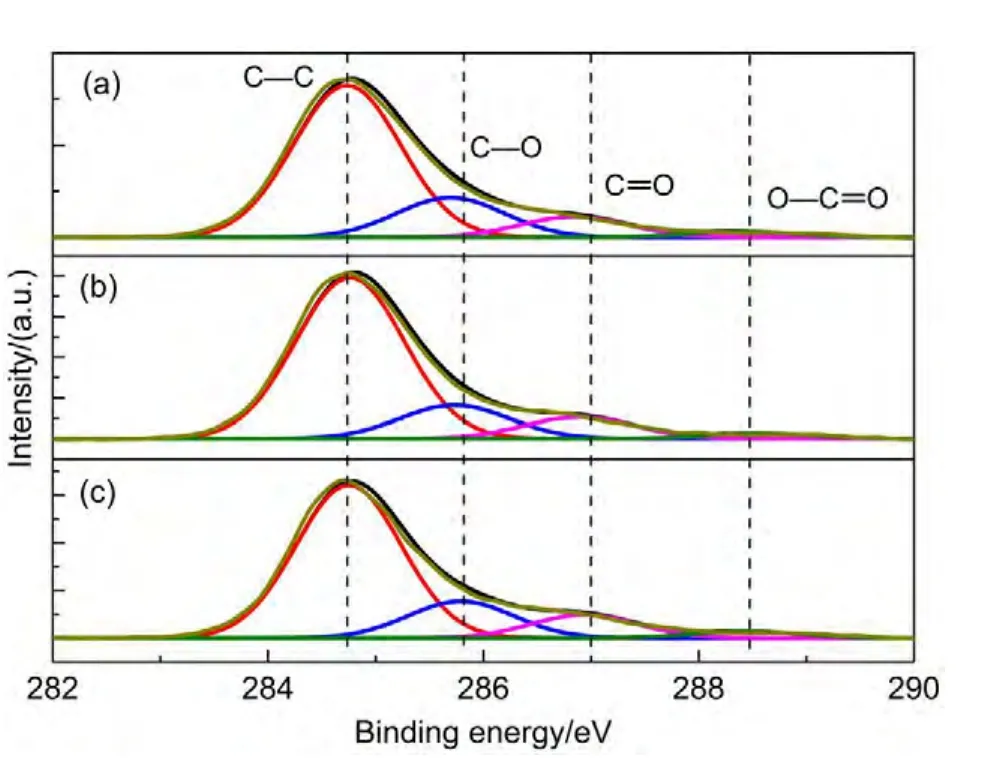
Fig.3 Fitted peaks of C 1s XPS spectra

Table 1 Capacitor parameters in each experiment
The C 1sXPS spectra of AC electrode prior to and after 10 charge-discharge cycles with a cut-off voltage of 3.1 V are shown inFig.3.ThefunctionalgroupsofC―C,C―O,C=O,andO―C=O can be observed on the surface of each electrode.25,26The C 1sspectra ranging from 280 to 291 eV were fitted and the relative amounts of different carbon species calculated from the deconvolution of the C 1sXPS peaks of the electrodes are listed in Table 2.The atomic percentage of C―O specie on the positive electrode is slightly higher than that on the as-prepared and negative electrodes.However,the contents of C=O specie for both positive and negative electrodes decrease after cycling.These results imply that some redox reactions may occur onAC surface.Moreover,during the charging process,aluminum foil can be passivated in electrolyte,forming the surface oxidized or fluorinated thin passivation films.27,28To avoid bringing in the influences of charging process,in the following experiments the impedance spectra were measured before any charging operation.
3.2 Electrode components
Fig.4 shows the Nyquist plots of cells with different activated carbons(ACs).The shapes of 45°slope line and the near-vertical line are the same but the sizes of semicircle loop are significantly different.The difference of semicircle loop can be correlated to AC conductivity.The four-probe measurements indicate that the conductivities of DCL and YP-50F are 1.05 and 0.37 S∙m-1,respectively.In other words,the intrinsic electrical resistivity ofYP-50F is about three times of that of DCL.The AC electrode with high-conductivity DCL leads to a smaller electrode resistance and smaller high-frequency impedance semicircle,which agrees well with the impedance results.
Fig.5 shows the Nyquist plots of cells with different conductive additive contents(carbon black,CB).The CB contents are 3%(w),5%(w),7%(w)and 10%(w),respectively.The relationship between semicircle diameter and CB content is shown in Fig.6.The semicircle size increases with the decrease of CB content.Especially,when CB content is lower than 5%(w),the semicircle size increases greatly.Furthermore,we studied the relation between electrode resistivity and CB content.We cut the electrodes(without aluminum current collector)into squares with a size of 3 mm×3 mm,and measured their resistivity using PPMS.The electrode resistivity with different CB contents is also shown in Fig.6.It can be seen that the semicircle size is nearly in proportion to the electrode resistivity.
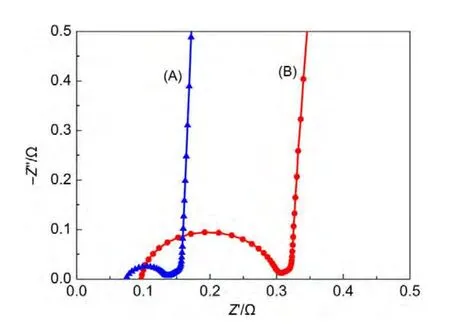
Fig.4 Nyquist plots of cells with different activated carbons(A)DCL;(B)YP-50F
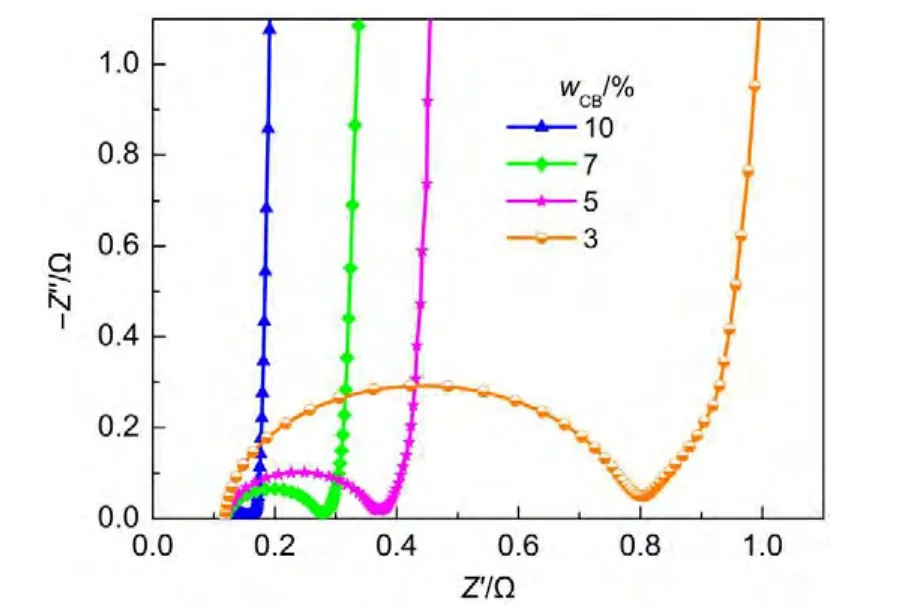
Fig.5 Nyquist plots of cells with different CB contents
Fig.7 shows the Nyquist plots of cells with different binder contents.CMC content is 1%(w),and SBR content varies from 4%(w)to 10%(w).With the increase of SBR content,the semicircle size increases apparently.As polymer binders are insulating substances,less amounts of binder should be used during electrode preparation.The SBR content should be no more than 6%(w).
Based on the aforementioned experiments,it can be found that both AC conductivity and contents of conductive additive and binders are related to electrode conductivity.These factors can affect the inter-particle contact resistance and contact capacitance in electrode.As a result,the semicircle size of impedance spectra changes accordingly.
3.3 Capacitor components and fabrication
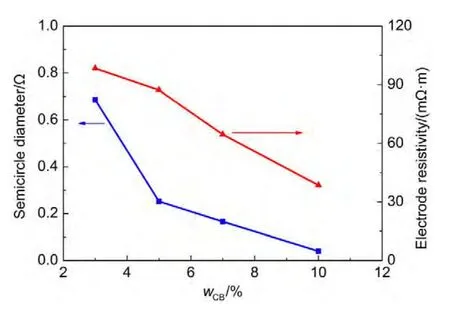
Fig.6 Variation of semicircle diameter and electrode resistivity with CB content

Table 2 Relative atomic percentages of various functional groups obtained from the deconvolution of the C 1s peaks
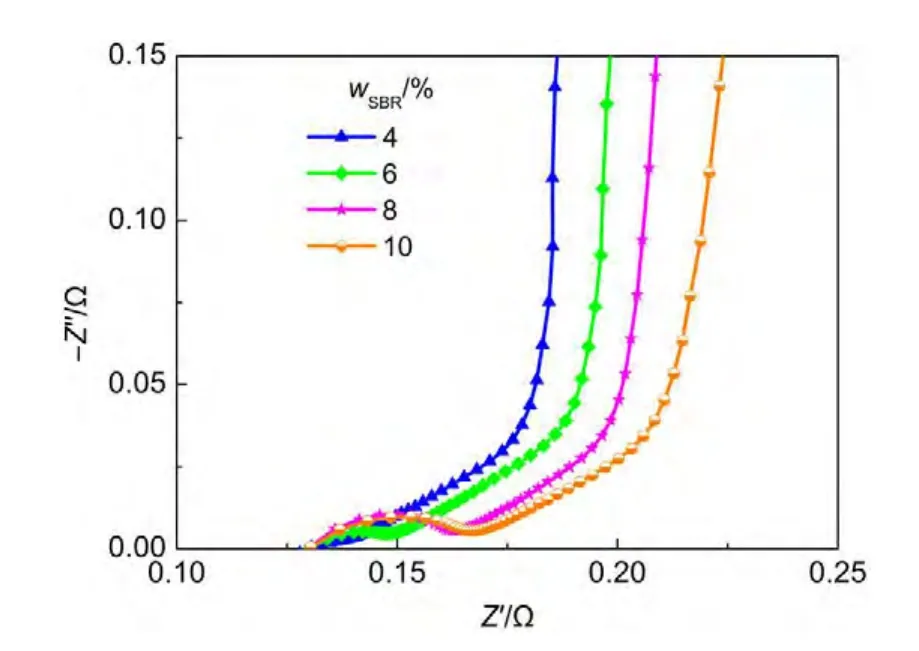
Fig.7 Nyquist plots of cells with different SBR contents
Fig.8 shows the Nyquist plots of cells with different nonaqueous electrolytes.The ionic conductivities are 55.2,40.0,and 13.4 mS∙m-1for AN,ME,and PC electrolytes,respectively(provided by suppliers).As the 45°line is mainly due to the frequency dependent resistance associate with the electrolyte penetration of the electrode pores,10,29this part can be obviously affected by ionic conductivity of electrolyte.This agrees well with the fact that the length of 45°line for the cell withAN electrolyte is the shortest and the one for the case of PC electrolyte is the longest.On the other hand,the electrolyte has little effect on the shapes of semicircle loop and the near-vertical line.
Fig.9 shows the Nyquist plots of cells with different separators,i.e.,TF4030,TF4050,and Celgard2400.It reveals that no obvious differences can be found in the semicircle loop,45°line and the near-vertical line.However,the device series resistanceRsshows some difference,due to the different ionic conductivities of separators which result in the different ionic resistances.30

Fig.8 Nyquist plots of cells with different nonaqueous electrolytes
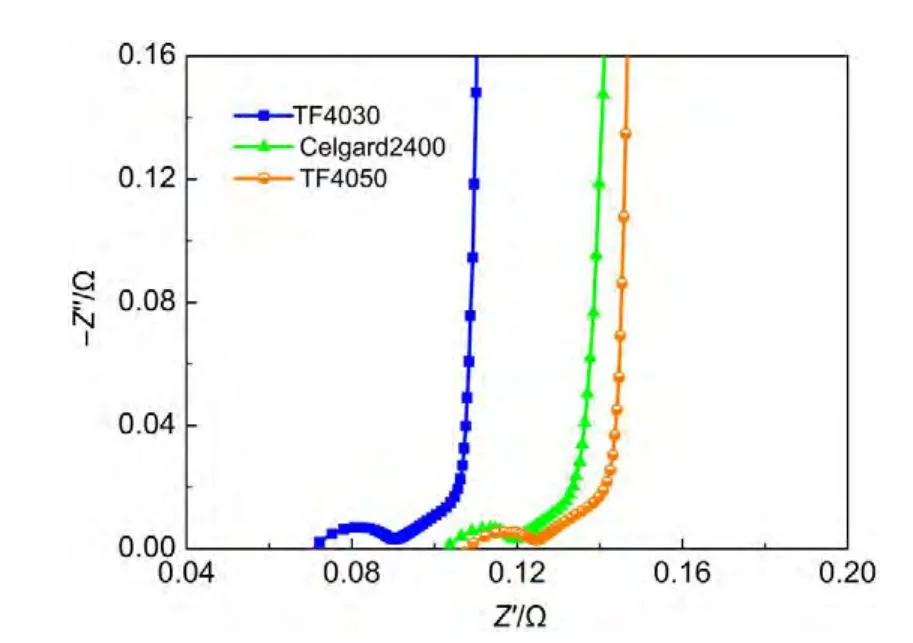
Fig.9 Nyquist plots of cells with different separators
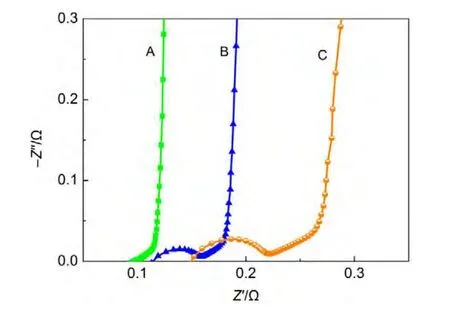
Fig.10 Nyquist plots of cells with different areal mass loadings
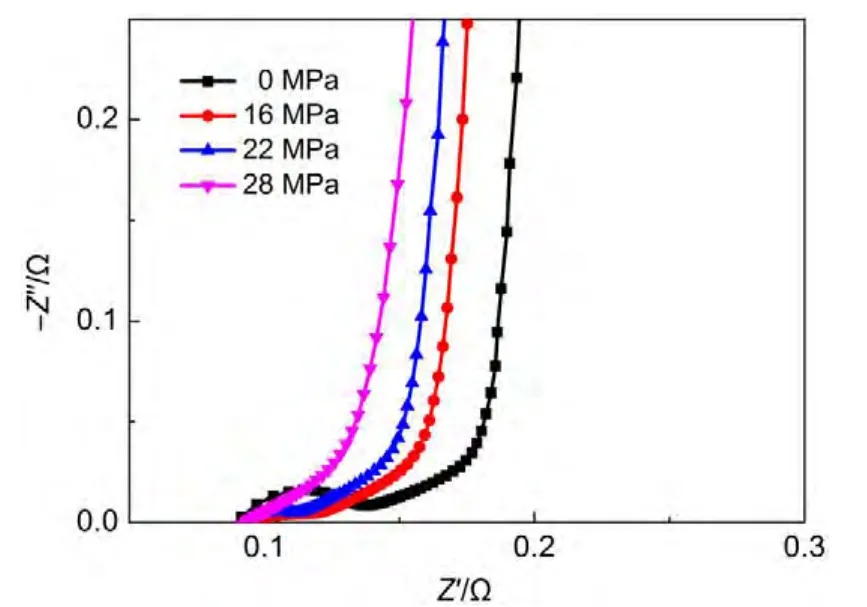
Fig.11 Nyquist plots of cells with electrode treated with different pressures
Fig.10 reveals the Nyquist plots of cells with different areal mass loadings(or thicknesses).It can be found that 45°slope line increases with the increase of areal mass loading.This can be related to the distributed capacitance and distributed resistance in pores.On the other hand,as the film thickness increases,the internal stress increases and the adhesive strength(critical load)decreases.31These lead to the increase of contact resistance between electrode and current collector,and the increase of semicircle size accordingly.
Another important factor is the exerted pressure to electrode.We treated the electrode with pressures of 0,60,90,and 120 MPa,respectively.As shown in Fig.11,no obvious changes of 45°slope line and the near-vertical line can be detected.However,the semicircle loop becomes smaller when pressure increases.With a greater exerted pressure,a better inter-particle and electrodecurrent collector contact can be obtained,resulting in a decrease of internal resistance inAC electrode.
4 Conclusions
In this work,an equivalent model was proposed to explain the semicircle loop at high frequency region.The semicircle loop was attributed to the contact resistance and the contact capacitance of inter-particles(AC-AC or AC-conductive additives),and of the interface between AC electrode and current collector.Experimental analyses show that the most important influencing factors on the semicircle loop are the charging cut-off voltage,conductivity of activated carbon,content of conductive additive and the exerted pressure.The optimum contents of CB,CMC and SBR are 10%(w),1%(w),and 4%-5%(w),respectively.In addition,AC electrode should be compacted to improve the particle to particle contact and the electrode to current collector contact.
(1) Musiani,M.;Orazem,M.;Tribollet,B.;Vivier,V.Electrochim.Acta2011,56,8014.doi:10.1016/j.electacta.2010.12.004
(2) Taberna,P.;Simon,P.;Fauvarque,J.F.J.Electrochem.Soc.2003,150,A292.
(3)Aurbach,D.;Markovsky,B.;Weissman,I.;Levi,E.;Ein-Eli,Y.Electrochim.Acta1999,45,67.doi:10.1016/S0013-4686(99)00194-2
(4) de Levie,R.Electrochim.Acta1963,8,751.doi:10.1016/0013-4686(63)80042-0
(5) Song,H.K.;Jung,Y.H.;Lee,K.H.;Dao,L.H.Electrochim.Acta1999,44,3513.doi:10.1016/S0013-4686(99)00121-8
(6) Song,H.K.;Sung,J.H.;Jung,Y.H.;Lee,K.H.;Dao,L.H.;Kim,M.H.;Kim,H.N.J.Electrochem.Soc.2004,151,E102.
(7)Sun,X.Z.;Zhang,X.;Zhang,H.T.;Zhang,D.C.;Ma,Y.W.J.Solid State Electrochem.2012,16,2597.doi:10.1007/s10008-012-1678-7
(8)Sun,X.Z.;Zhang,X.;Zhang,H.T.;Huang,B.;Ma,Y.W.J.Solid State Electrochem.2013,17,2035.doi:10.1007/s10008-013-2051-1
运力保障提上去,自9月1日起至10月16日,全省农用柴油配送量达到21.5万吨。其中,9月单月配送量为14.5万吨,单日柴油最高配送量达到6490吨,与往年相比都略有增长。
(9)Sun,X.Z.;Zhang,X.;Huang,B.;Ma,Y.W.Acta Phys.-Chim.Sin.2014,30,485.[孙现众,张 熊,黄 博,马衍伟.物理化学学报,2014,30,485.]doi:10.3866/PKU.WHXB201401131
(10) Lewandowski,A.;Olejniczak,A.;Galinski,M.;Stepniak,I.J.Power Sources2010,195,5814.doi:10.1016/j.jpowsour.2010.03.082
(11)Qu,Q.T.;Wang,B.;Yang,L.C.;Shi,Y.;Tian,S.;Wu,Y.P.Electrochem.Commun.2008,10,1652.doi:10.1016/j.elecom.2008.08.020
(12) Ruch,P.W.;Cericola,D.;Foelske-Schmitz,A.;Kötz,R.;Wokaun,A.Electrochim.Acta2010,55,4412.doi:10.1016/j.electacta.2010.02.064
(13) Kossyrev,P.J.Power Sources2012,201,347.doi:10.1016/j.jpowsour.2011.10.106
(14) Dsoke,S.;Tian,X.;Taubert,C.;Schluter,S.;Wohlfahrt-Mehrens,M.J.Power Sources2013,238,422.doi:10.1016/j.jpowsour.2013.04.031
(15)Zhong,H.X.;Zhao,C.B.;Luo,H.;Zhang,L.Z.Acta Phys.-Chim.Sin.2012,28,2641.[仲皓想,赵春宝,骆 浩,张灵志.物理化学学报,2012,28,2641.]doi:10.3866/PKU.WHXB201207181
(17) Conway,B.E.Electrochemical Supercapacitors:Scientific Fundamentals and Technological Applications;Kluwer Academic/Plenum Publishers:New York,1999.
(18) Nian,Y.R.;Teng,H.J.Electroanal.Chem.2003,540,119.doi:10.1016/S0022-0728(02)01299-8
(19)Huang,C.W.;Hsu,C.H.;Kuo,P.L.;Hsieh,C.T.;Teng,H.Carbon2011,49,895.doi:10.1016/j.carbon.2010.10.053
(20)Huang,C.W.;Chuang,C.M.;Ting,J.M.;Teng,H.J.Power Sources2008,183,406.doi:10.1016/j.jpowsour.2008.04.075
(21)Takeuchi,M.;Koike,K.;Mogami,A.;Maruyama,T.Electric Double-layer Capacitor and Carbon Material Therefor.US PatentApplication.20020039275A1,2002-04-04.
(22) Cericola,D.;Ruch,P.W.;Foelske-Schmitz,A.;Weingarth,D.;Kötz,R.Int.J.Electrochem.Sci.2011,6,988.
(23) Azaïs,P.;Duclaux,L.;Florian,P.;Massiot,D.;Lillo-Rodenas,M.A.;Linares-Solano,A.;Peres,J.P.;Jehoulet,C.;Béguin,F.J.Power Sources2007,171,1046.doi:10.1016/j.jpowsour.2007.07.001
(24)Ruch,P.W.;Cericola,D.;Foelske,A.;Kötz,R.;Wokaun,A.Electrochim.Acta2010,55,2352.doi:10.1016/j.electacta.2009.11.098
(25)Chen,Y.;Zhang,X.;Yu,P.;Ma,Y.W.Chem.Commun.2009,4527.
(26)Xu,B.;Yue,S.F.;Sui,Z.Y.;Zhang,X.T.;Hou,S.S.;Cao,G.P.;Yang,Y.S.Energ.Environ.Sci.2011,4,2826.doi:10.1039/c1ee01198g
(27) Kötz,R.;Ruch,P.W.;Cericola,D.J.Power Sources2010,195,923.doi:10.1016/j.jpowsour.2009.08.045
(28)Bittner,A.M.;Zhu,M.;Yang,Y.;Waibel,H.F.;Konuma,M.;Starke,U.;Weber,C.J.J.Power Sources2012,203,262.doi:10.1016/j.jpowsour.2011.10.083
(29) Portet,C.;Taberna,P.;Simon,P.;Laberty-Robert,C.Electrochim.Acta2004,49,905.doi:10.1016/j.electacta.2003.09.043
(30) Huang,X.J.Power Sources2014,256,96.doi:10.1016/j.jpowsour.2014.01.080
(31) Sheeja,D.;Tay,B.;Leong,K.;Lee,C.Diam.Relat.Mater.2002,11,1643.doi:10.1016/S0925-9635(02)00109-7

