
Water use efficiency in an arid watershed: a case study
2013-10-09 08:10DamarisOrphanopoulosKoenVerbistAlvaroChavezGuidoSoto
Damaris Orphanopoulos , Koen Verbist , Alvaro Chavez , Guido Soto
1. Rodhos Consulting, Vaticano 4026 B, Santiago, Chile
2. UNESCO-International Hydrological Programme, 1 Rue Miolis, Paris, France
3. Centro del Agua para Zonas Áridas y Semiáridas de América Latina y el Caribe (CAZALAC), Benavente 980, La Serena, Chile
1 Introduction
Some dryland areas in Chile are characterized by a very high agricultural production potential that is mainly limited by a lack of water resources. Additionally, there is competition for water resources by different water users, such as potable water, agriculture, mining, hydropower generation and minimum environmental flows, which makes water a highly valued resource. This demand drives a process of optimizing water use efficiency, in order to optimally benefit from this scarce resource. This concept, however, can be approached from different angles. Indeed, efficiency can be improved at the individual water user level, or farm in the case of agricultural production, by increasing the crop yield per water unit, as well as the use of all available water. Respectively, this would be defined as economical and physical efficiency. At the intermediate level, the objective is to facilitate the effective distribution of water, by employing efficient organization, and increasing its efficient allocation,with the least possible losses, which means administrative efficiency. On the other hand, the basin or watershed level aims at optimizing the physical and economical efficiency of all uses present in the basin. The water use efficiency at this level is important, to make sure that not only individual users are efficient, but also the watershed as a whole. This could mean that inefficiencies at the individual level could even be beneficial to other users downstream, and as such contribute to higher basin efficiency, when the whole watershed area is considered. This already indicates that the interaction of these different levels is complex and needs to be taken into account.
A case study is presented here of an arid catchment located in the central northern area of Chile in the Coquimbo Region, where a water efficiency analysis of all levels was performed using an integrated modeling tool called MAGIC.This modeling tool has different advantages, as it allows for multiple interacting data sets to be considered, such as surface water and groundwater resources, different water usages, as well as different diagnostic levels, within a river basin. The question remains of how such an integrated water resource model is capable of representing the different fluxes observed in the watershed. Therefore, a detailed calibration of the MAGIC model is presented here, comparing model outputs with different observed data sets. The second objective of this study was to evaluate water use efficiency,both at the field level and for the watershed as a whole, to establish a baseline for future improvements. Finally, four of such future scenarios were evaluated, to determine optimal strategies for improved water use efficiencies in the arid Elqui Valley.
2 Study area
The Elqui River catchment is located in the Coquimbo Region, which is part of the central northern area of Chile. In Figure 1, the Elqui drainage basin is presented, showing the main river and its tributaries, as well as associated aquifers.For modeling purposes, different irrigation sectors were defined, and wells identified from which groundwater resources are extracted.
The study area has an arid Mediterranean climate using the Aridity Index (Verbistet al., 2010b), and is characterized by (1) an average annual precipitation of 99.2 mm, of which more than 70% is produced in the southern winter season; (2)moderate temperatures, with an absolute minimum of 2 °C(June) and an absolute maximum of 30 °C (March); (3) a high relative humidity (80%) with frequent cloudiness only near the ocean; (4) an average annual solar radiation of 4,075 cal/(cm2·d), resulting in a water deficit of 800 to 1,000 mm/a (Miller, 1976).

Figure 1 Location of the Elqui Valley in the Coquimbo Region, with indications of the Elqui River, aquifers,irrigation sectors, and groundwater extraction wells
3 Modeling framework
3.1 Model setup
To obtain results on the water use efficiency in the watershed, a Chilean water balance model called MAGIC(Modelación Analítica Genérica Integrada de Cuencas) was used. This tool was developed to visualize all relevant data sets in one environment, to allow an improved understanding of the interactions between water resources, and to evaluate demand versus water availability and its efficient allocation. Specifically, the tool was designed to answer questions on the (1) water resource usage inside the watershed,(2) the interaction between surface and subsurface waters,(3) the behavior of aquifers under climatic variability and increased exploitation, (4) visualization of the level of irrigation water security, (5) the return flows in the system,and (6) water resources lost to the ocean.
The MAGIC water balance model consists of the following components: contributing sub-watersheds, rivers,aquifers, reservoirs and irrigation sectors. The model simulates all hydrological processes between these elements,as well as consumptive and non-consumptive fluxes that are produced from nodes and aquifers or between nodes,and reports on all the interrelated fluxes between these elements.
Figure 2 depicts the different components considered for the specific model developed for this case study. Each of the components of this model will be described in the following sections.
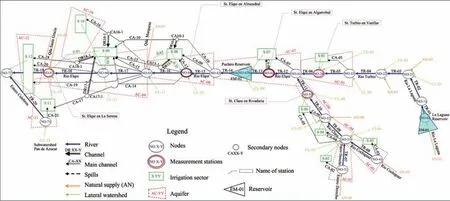
Figure 2 Topological scheme of the Elqui Model, with indication of river stretches, (measured) discharge nodes, irrigation sectors and aquifers, as well as the two reservoirs present, La Laguna and Puclaro
3.1.1 Discharge in river segments
Discharge in river segments is an important input to the model structure and is obtained from different data sources.Measurement data from five gaging stations were available and were directly applied in the model (indicated by red circles in Figure 2). For sub-watersheds without gaging stations that contribute to the main river section, a non-linear runoff-infiltration model (MPL) was used. For sub-watersheds with snow regime, gaging stations were used, and where these were not available, discharge was estimated from the nearby measuring station by weighing altitude and precipitation of the ungagged sub-watershed. As such, it was possible to estimate the discharge of the whole basin.
3.1.2 Groundwater resources
Twelve aquifers were identified in the watershed, with volumes of half a million to 188 million cubic meters. Locations of the aquifers in the study area are indicated in Figure 1. Monitored aquifer wells in the study area represent the volume of water that users extract from the subsurface.Twenty nine extraction wells were identified that provide a groundwater resource for mining operations, irrigation,agro-industries and for drinking water.
3.1.3 Irrigation channels and sectors
Twenty main irrigation channels were considered in the model, five of them having secondary channels. The irrigation sectors were identified using existing horticultural data bases, fruit plantation cadastres and aerial photography, defining twelve independent areas. Each of these areas has different crops associated and use specific irrigation practices. For each of the forty crops observed in the watershed,time variable crop growth factors were determined for usage inside the FAO evapotranspiration model (Allenet al., 1998).The efficiency of the different irrigation techniques used in the area were quantified (INIA Intihuasi, 1997) and ranged from 0.30 (flooding) to 0.90 (drip irrigation).
3.1.4 Potential evapotranspiration and precipitation
Potential evapotranspiration of each irrigation sector was estimated from the climatic measurement stations available in the watershed (CIREN, 1990). Precipitation is very scarce in the region (80–120 mm on average) and has limited effect on the required agricultural water demand, as rainfall is concentrated in the winter months. On the other hand, winter precipitation in the form of snow on higher altitudes is an important contribution to the region’s summer water resources.
3.1.5 Reservoirs
Two main reservoirs are present in the watershed. The La Laguna Reservoir is located in the Andes mountain range at 3,250 m and has a maximum storage volume of 40×106m3. The second, larger Puclaro Reservoir is located halfway downstream on the Elqui River and has a maximum storage capacity of 201×106m3. Monthly potential evaporation was estimated for both reservoirs, as a water loss, and reaches a minimum in winter (75 mm/month) and a maximum of 300 mm/month during summer. Other characteristics considered were filtration, their level and maximum discharge in function of their volume.
3.1.6 Other losses/gains
Two other water losses were considered in the model.Firstly, losses from evaporation in open water bodies were estimated for nine locations. Secondly, losses from drinking water resources leaving the river system were also modeled.On the other hand, gains of four wastewater treatment plants that contribute water to the river with modest discharge were also accounted for. The main two cities near the coast, La Serena and Coquimbo discharge their treated waters directly into the ocean.
3.2 Model calibration
A first important objective was to calibrate the MAGIC model to adequately reflect water balance in the Elqui Valley,in line with observed fluxes and volumes in the river and aquifers. The control points selected for model calibration correspond to nodes previously defined at the location of gaged stream-flow stations (Figure 2). The selection of a calibration station was based on the duration, continuity and overall quality of the stream-flow record, resulting in five calibration data sets.
As the river hydrology has changed with the implementation of the Puclaro Reservoir that became operational in 1999, the calibration period was selected to represent the current situation as accurately as possible, covering the period of 1999–2004.
As there was no automatic procedure in place to calibrate the model, parameters of the different model components were individually calibrated:
(1) River sections: To regulate the discharge lost to percolation in the model in these river sections, the depth of the permeable layer and the coefficients of vertical permeability were calibrated.
(2) Irrigation areas: The ratios of spilled and percolated water are assigned for each of the twelve irrigation areas, as a function of the irrigation efficiency and nature of the soil in each section. Internally, the model calculates the weighted irrigation efficiencies for each irrigation zone.
(3) Aquifers: The parameters used to calibrate water levels in the aquifers refer to the geometry and characteristics of the aquifers, which are defined by storage coefficient,horizontal hydraulic conductivity in the entry and exit section, and representative shape of the aquifers (rectangular or triangular).
(4) Reservoirs: The reservoir level and release are not calibrated, and act as such, as a tool to visualize the model’s performance.
3.3 Diagnostics of water use efficiency
The present study was developed to answer some of the questions regarding the availability of water resources in the region, which are difficult to analyze without an integrated water balance model:
(1) The effective or consumptive use of available water resources, and water reuse.
(2) The interaction between surface and groundwater.
(3) The behavior of the aquifers.
(4) The irrigation satisfaction index.
(5) Return fluxes and losses to the ocean.
As the Elqui Valley is mainly an agricultural basin, the irrigation satisfaction index is the most relevant to the analyst. This index is calculated as the percentage of years that have satisfied at least 90% of the irrigation demand in all but one month of the year, with that month satisfying at least 80% of demand.
From the model results, different water use efficiency indicators can also be calculated for each irrigation sector:(1) the irrigation efficiency, calculated as the demand from crops compared to the demand at the entrance of the irrigation sector, and (2) total water use efficiency, calculated as the discharge received by the crops compared to the discharge captured at the river intake.
3.4 Scenario analysis
One of the benefits of using an integrated water management model is the ability to formulate different alternative scenarios, and evaluate their impact on water availability,irrigation security and water use efficiency. Out of a set of 19 calculated scenarios for the Elqui watershed, four will be discussed in detail.
The first scenario aims at optimizing the water transport efficiency in the irrigation regions below the Puclaro Reservoir (areas 9–12), by using irrigation tubes instead of irrigation channels. As such, transportation losses are nonexistent in this scenario. The second scenario focuses on increasing the irrigation efficiency in downstream areas that currently have the lowest efficiencies, and evaluate its impact. In the third scenario the current legal limits of groundwater extraction for irrigation are lifted for downstream areas, to assess its impact on the irrigation security index. Finally, a future increase of the total irrigation area is evaluated, to determine the sustainability of such a scenario under current water resources availability. The increase in irrigation area was subject to the available area in the irrigation sectors (Table 1),and it is expected that drip irrigation will be used as the sole irrigation technique in these newly acquired areas.

Table 1 Irrigation zones and their current and increased area under this scenario
4 Results
4.1 Calibration
4.1.1 Calibration of surface water
The calibration of surface water fluxes consisted in the adjustment of simulated river discharges to their observations at certain control points (Figure 2). Figure 3 shows two examples of observed and modeled discharges, after calibration. As can be observed, the model simulated the discharges in the control points relatively well, although it slightly underestimated the peak observed during the very wet season of 2002,which corresponds to an El Nino event (Verbistet al., 2010a).

Figure 3 Comparison between observed and simulated discharge for two calibrated river nodes: (a) at the exit of La Laguna Reservoir and (b) at Varillar
4.1.2 Calibration of groundwater
The variations of the piezometric water levels of the aquifers were also calibrated. As presented in Figure 1, a set of wells are monitored in the region that can be used to represent corresponding aquifer levels. Although the MAGIC model is a water balance model that has no detailed representation of the physical aquifer characteristics, adjustments were made to optimally represent aquifer water levels,within an acceptable range. Besides a very good calibration of aquifer levels, it was observed that variation in the aquifers is almost nonexistent during the observation period,which indicates that the aquifers were not overexploited during this period.
4.1.3 Calibration of reservoir water levels
The behavior of the previously calibrated model can be verified by the functioning of the reservoirs. When the extractions are known, as well as its level, the extractions that are simulated can be compared with water demands downstream and the simulated level of the reservoir as a difference between input and output.
For both the La Laguna and Puclaro reservoirs, observed and simulated values of input and output discharge were compared (Figure 4). It can be observed that the model represents the highs and lows, showing an acceptable representation of reality.
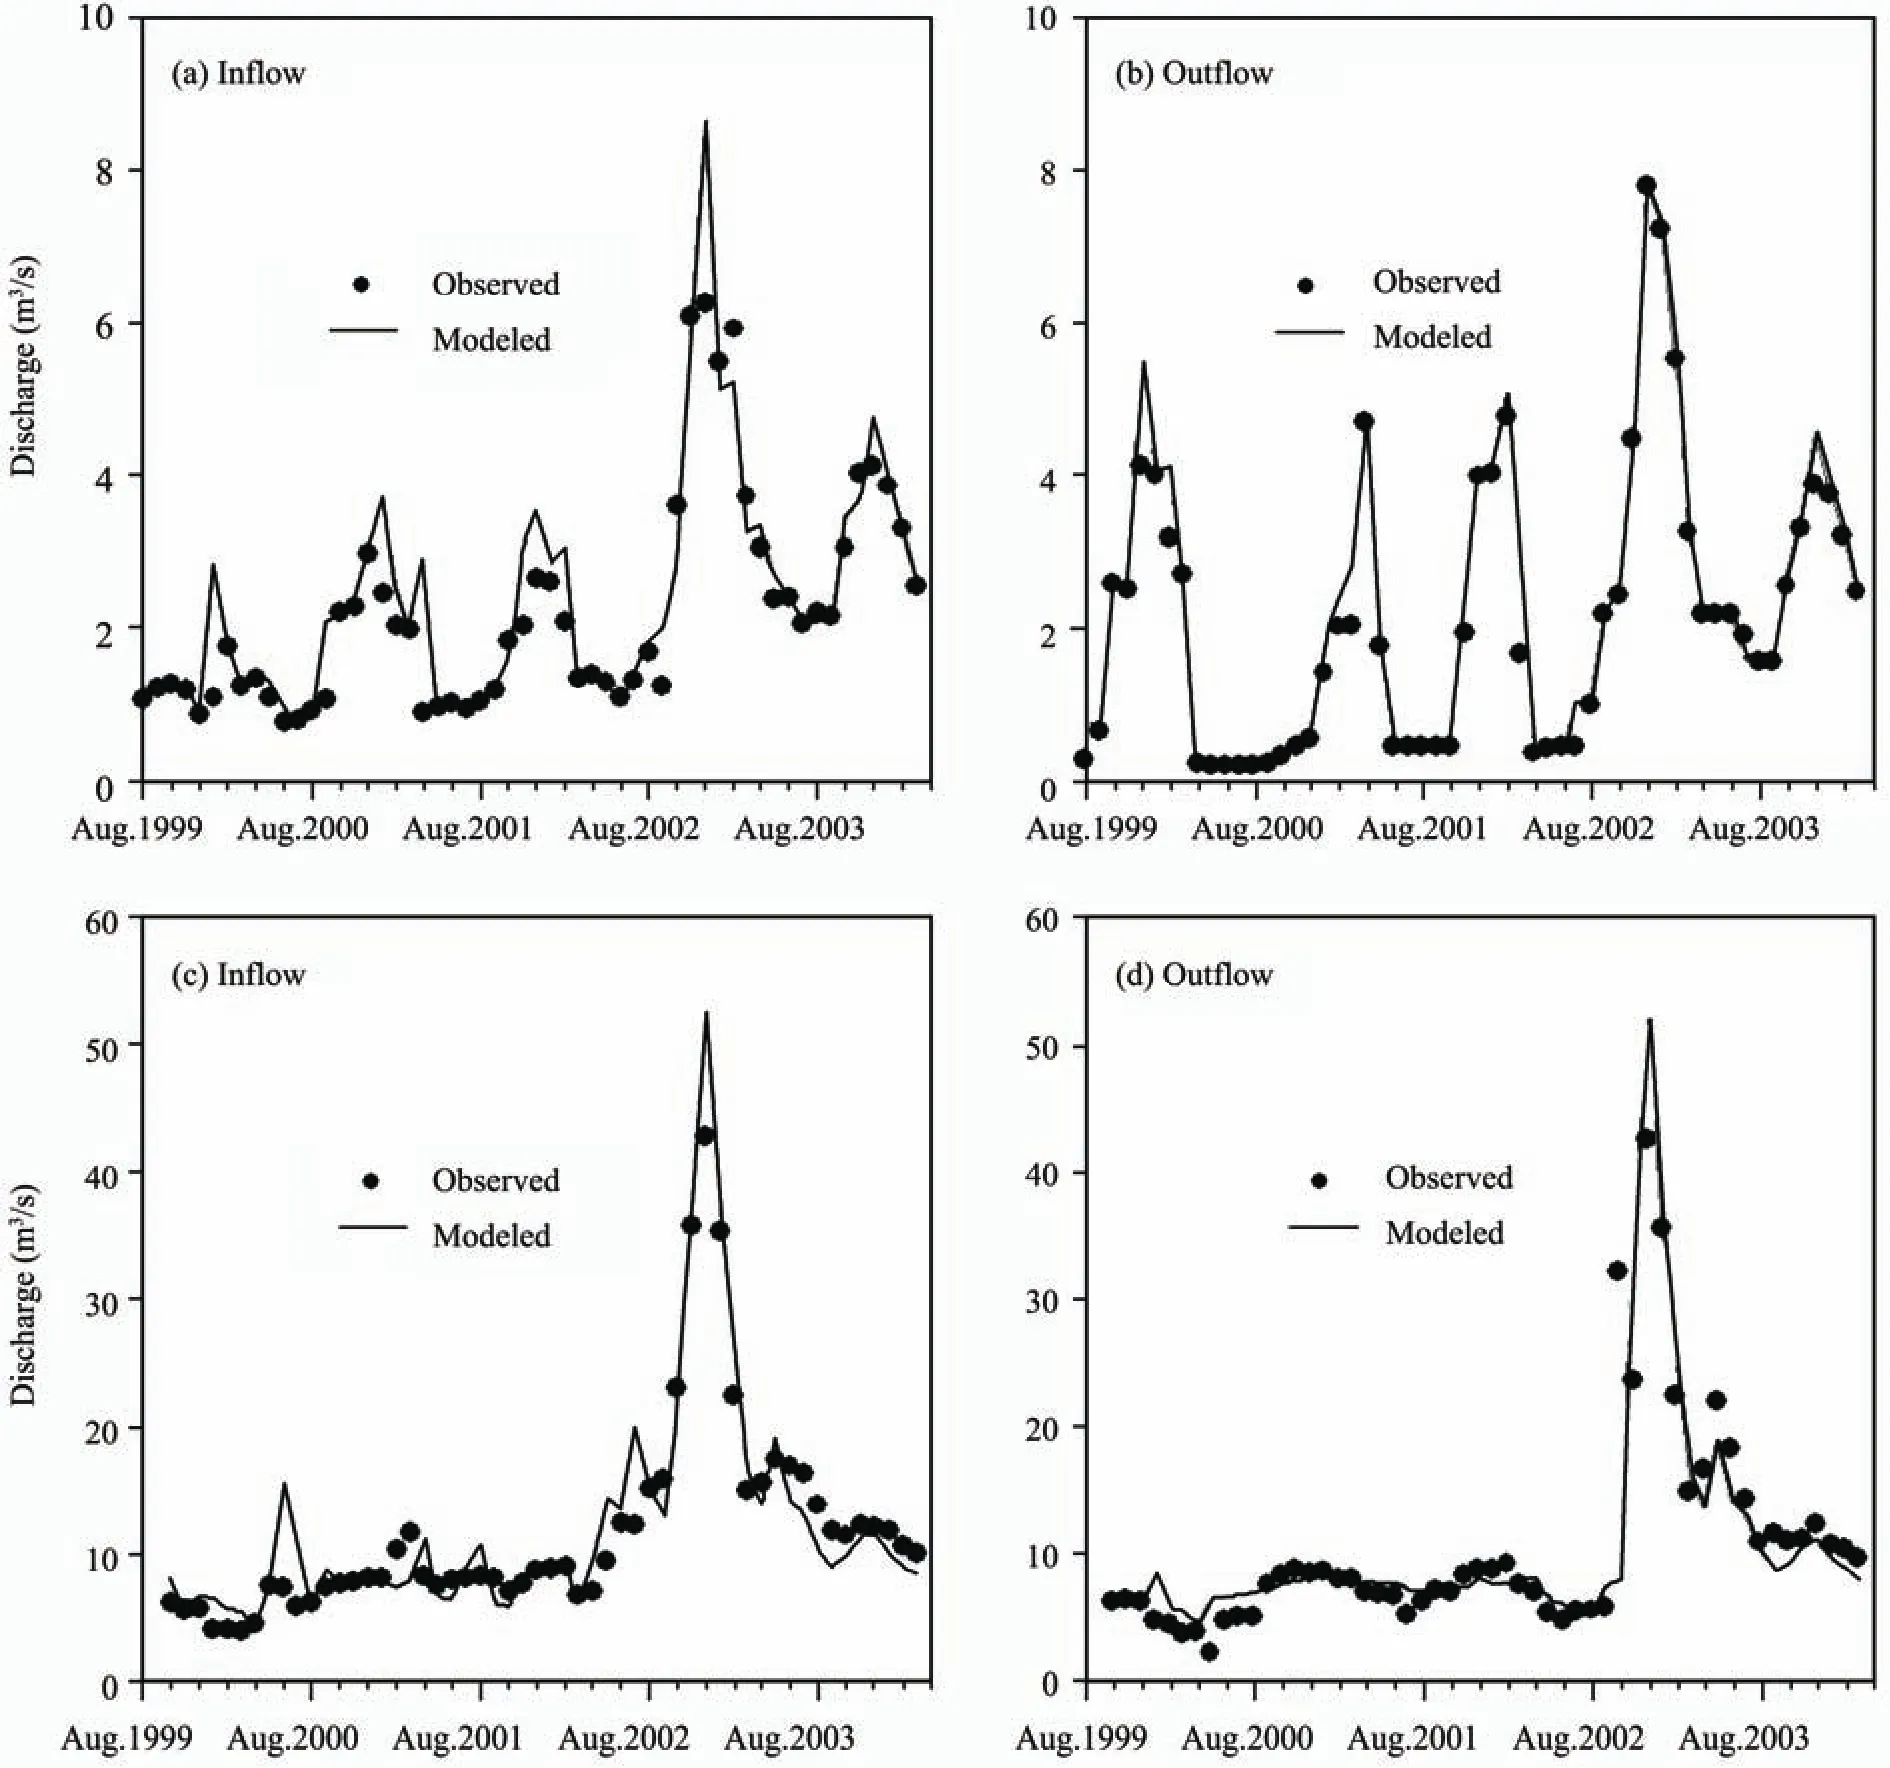
Figure 4 Comparison of modeled and observed inflow and outflow of (a, b) the La Laguna Reservoir and (c, d) the Puclaro Reservoir
4.2 Diagnostics of water use efficiency
4.2.1 Irrigation satisfaction index
In the Coquimbo Region two specific cases were observed to assess the satisfaction of water demand for the irrigation sector. In the irrigation areas between the two reservoirs, abundant surface water resources are available to supply the required demand (Figure 5a). But in area downstream of the Puclaro Reservoir (Figure 5b), the demand could not be met completely during any of the years considered. The irrigation satisfaction index remained between 50%–70% during the observed period for these sectors. This can be explained by two observations. First, during the initial operation phase of the new Puclaro Reservoir, there were no operation rules yet in place to manage it. As a result, the reservoir was held full for a long period of time, overflowed and did not meet demands properly. The second observation was that there were large amounts of agricultural land that were cultivated only in wet years. This area then stands for the 30%–50% whose demand is not satisfied in normal years.
The irrigation security index for the different irrigation sectors is presented in Table 2. This index is defined as years that have satisfied irrigation demand in all but one month of the year, with that month satisfying at least 80% of demand.It is clear that irrigation sectors with the lowest irrigation security are found downstream of the Puclaro Dam, with one irrigation sector upstream as the exception (ZR-02).That sector has lower availability of surface water than the other irrigation sectors above the reservoir, which reduces its irrigation security.
These differences can also be explained by the differences in the amount of water rights per hectare held by farmers in the upper area of the watershed, compared to those on the downstream end. Table 2 also shows the water rights per hectare for the different irrigation sectors, and corresponding water availability per hectare.
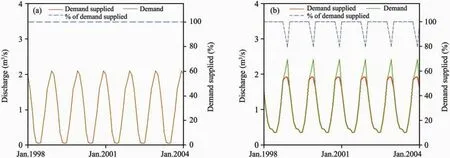
Figure 5 Inter-annual variation of demand, demand supplied and percentage of demand supplied for (a) the irrigation sector 8 and (b) the irrigation sector 12
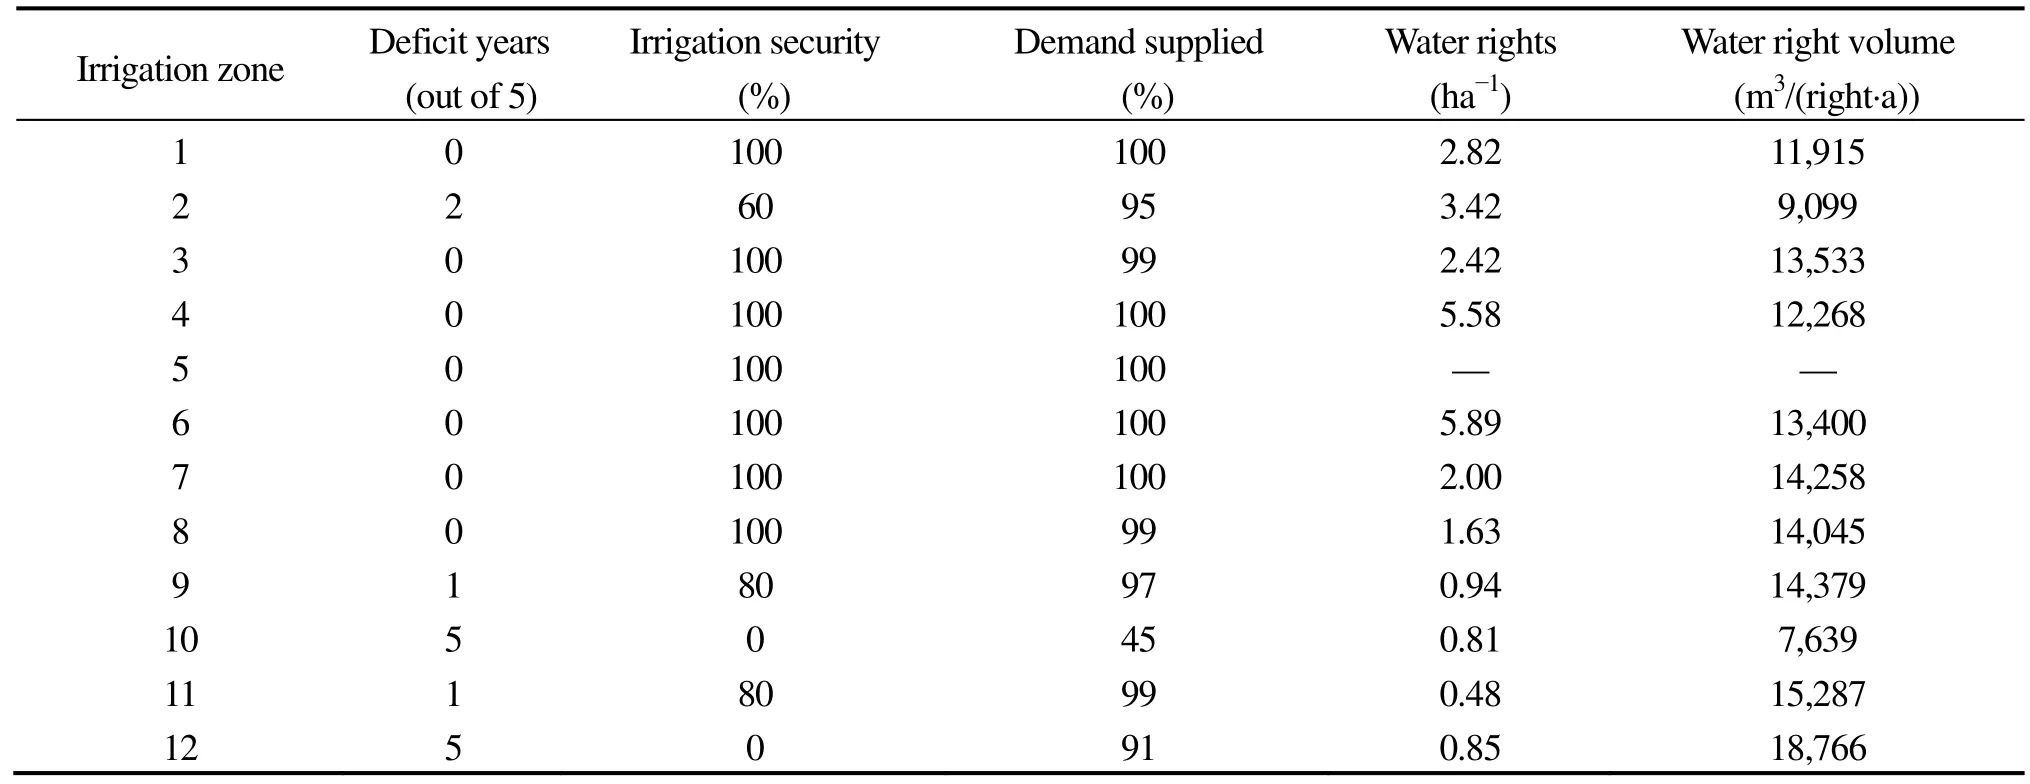
Table 2 Irrigation zones and their corresponding irrigation security and demand supplied
As more agricultural land is available below the Puclaro Dam, this result in a higher water demand and less water rights per hectare for the downstream irrigation sectors(9–12) compared to the upstream sectors (1–8). The available water resources for irrigation are accordingly, as the average water volume per water right is similar to the mean for most irrigation sectors. Only sectors 2 and 10 have significantly lower volumes per action, due to the low water resources volumes available for distribution.
4.2.2 Water use efficiency
Irrigation efficiency and total water use efficiency are presented in Table 3. It can be observed that the irrigation efficiency is higher for upstream areas of the watershed,but since these areas account for more water rights per hectare, the total water use efficiency is much lower. As such, operating factor of the water captured is only 14%–26%, while the remainder is released back to the river system. On the other hand, irrigation efficiency decreases towards downstream areas, since farmers have less technologically sophisticated irrigation systems in those areas. The total efficiency, on the other hand, is higher, as limited resources are applied more effectively. These areas also use wells to supply some of the demand, which exhibit less water losses as well.
From these efficiencies, the global watershed efficiency can be calculated, which relates the supplied discharge to the consumptive demand in the watershed as a whole. For the Elqui Valley, total average consumptive demand is calculated as 193 million cubic meters of water, with an available discharge volume of 312 million cubic meters, which indicates a net efficiency of 56%.
This results in a loss of available resources of 44% that is observed as discharge into the ocean, as losses from the coastal aquifers to the ocean and as discharges of the water treatment plants to the ocean. Some of these lost water resources could be utilized, by transforming them into consumptive demands, which will be further explored in the scenario analyses.

Table 3 Water use efficiencies for the different irrigation sectors
4.3 Scenario analysis
4.3.1 Increase in water use and irrigation efficiency
In the first two scenarios, the irrigation areas downstream of the main reservoir are managed more optimally.The first scenario assumes that all open irrigation channels in that area are replaced by closed-circuit irrigation pipes. It further leads water use efficiency in that area to increasing from 26%–40% (Table 3) to 100%. The resulted increase in irrigation security can be observed in Figure 6b, where the scenario results in a more optimized demand supplied when compared to the base case (Figure 6a), except for the driest year simulated (1996), where the demand still exceeds the supply. As a result, the average supplied demand in the watershed increases under this scenario from 94% to 97%.
In the second scenario, irrigation efficiency in these irrigation areas is improved, by opting for low loss methods,such as drip irrigation, instead of furrow irrigation which is currently applied. This scenario shows only a slight improvement of the supplied demand to 95% (Figure 6c), but improves the situation considerably in areas 9 and 12, and shows only one remaining year with a marked deficit during the drought year.
4.3.2 Use of aquifers to supply demand
In the scenario where aquifers are allowed to alleviate water demands in drought years, significant changes are observed when compared to the base case (Figure 7a). The most significant observation is that almost all deficits can be relieved using ground water in this scenario. Only in irrigation zone 2, water resources are still insufficient to supply demand, even when using the scarce aquifer resources. Six out of fifteen years are deficient for this sector, which is only a small improvement over the base case.
The irrigation of zones 9 to 12 leads to a major groundwater exploitation in supplying this demand. This results show decreases in the aquifer levels in drought years (e.g.,1996), however, within the limits of recovery in subsequent wetter instances.
This shows that the aquifers are an additional source of water resources that could be utilized in drought years to reach an irrigation security of 100% in the whole valley,except for irrigation areas 2 and 10 where only exhibit such security for half of its area.
4.3.3 Increase of agricultural area
In this scenario, the agricultural area was increased to 37% compared to the actual situation. This causes a larger stress on available reservoirs and aquifers to supply the increased demand (Figure 8). This was particularly observed in the downstream areas, where a more intensified exploitation of the aquifers was observed, reaching the maximum permitted by extraction rights currently in place for most aquifers, without supplying the demand in drought years completely.
As a result of this scenario only presenting irrigation sectors 1, 4 and 6, it did not present supply deficits, while the remaining sectors could not irrigate their complete(increased) area, or with reduced irrigation security. For the watershed as a whole, only 91% of the demand could be supplied.
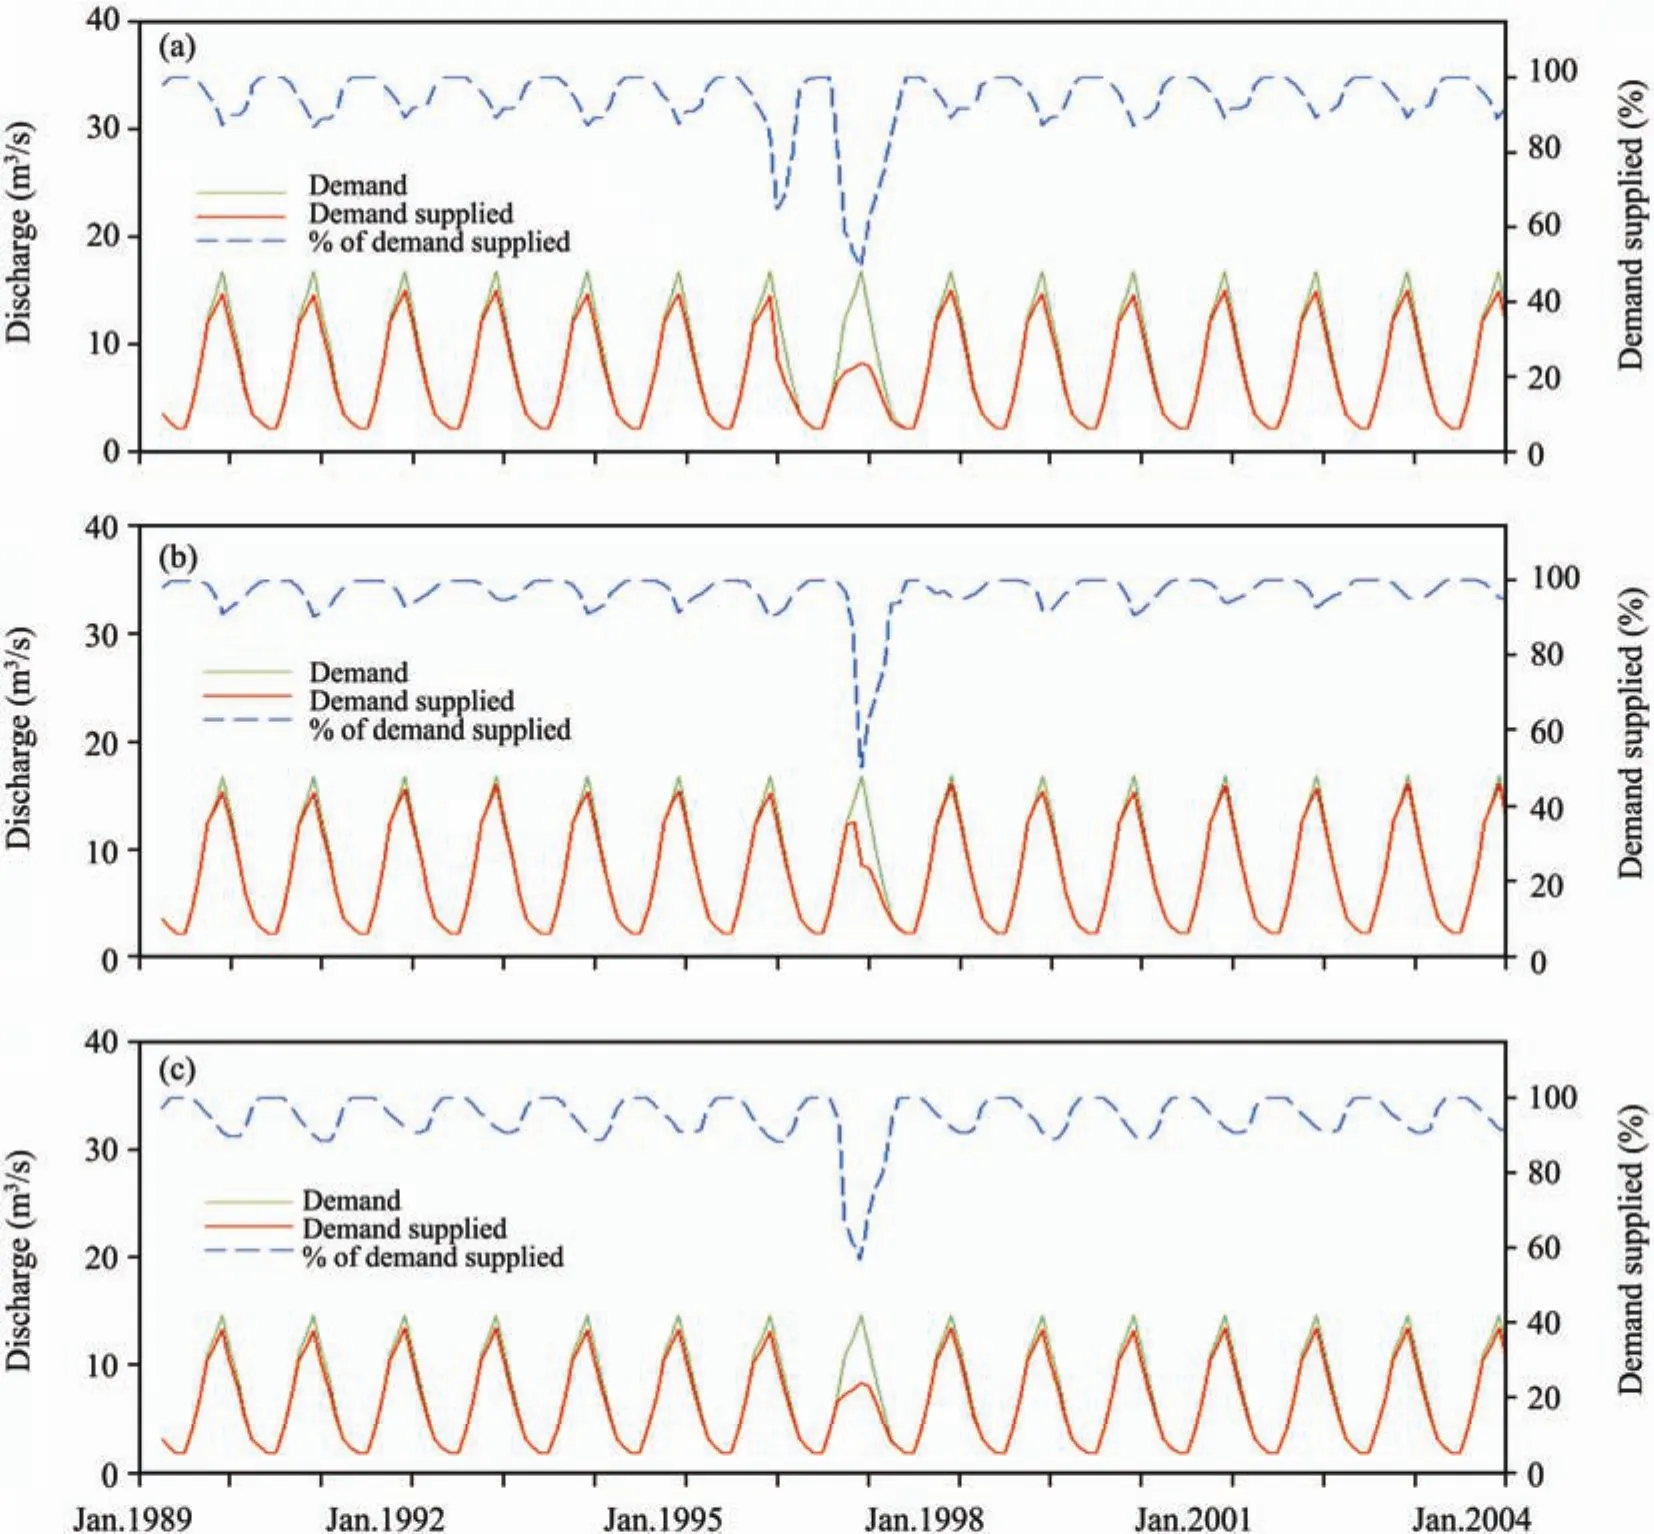
Figure 6 Inter-annual variation of demand, demand supplied and percentage of demand supplied for the (a) base case,(b) scenario of increased water transport efficiency, and (c) scenario of increased irrigation efficiency

Figure 7 (a) Inter-annual variation of demand, demand supplied and percentage of demand supplied for the scenario of increased aquifer usage, and (b) associated aquifer levels
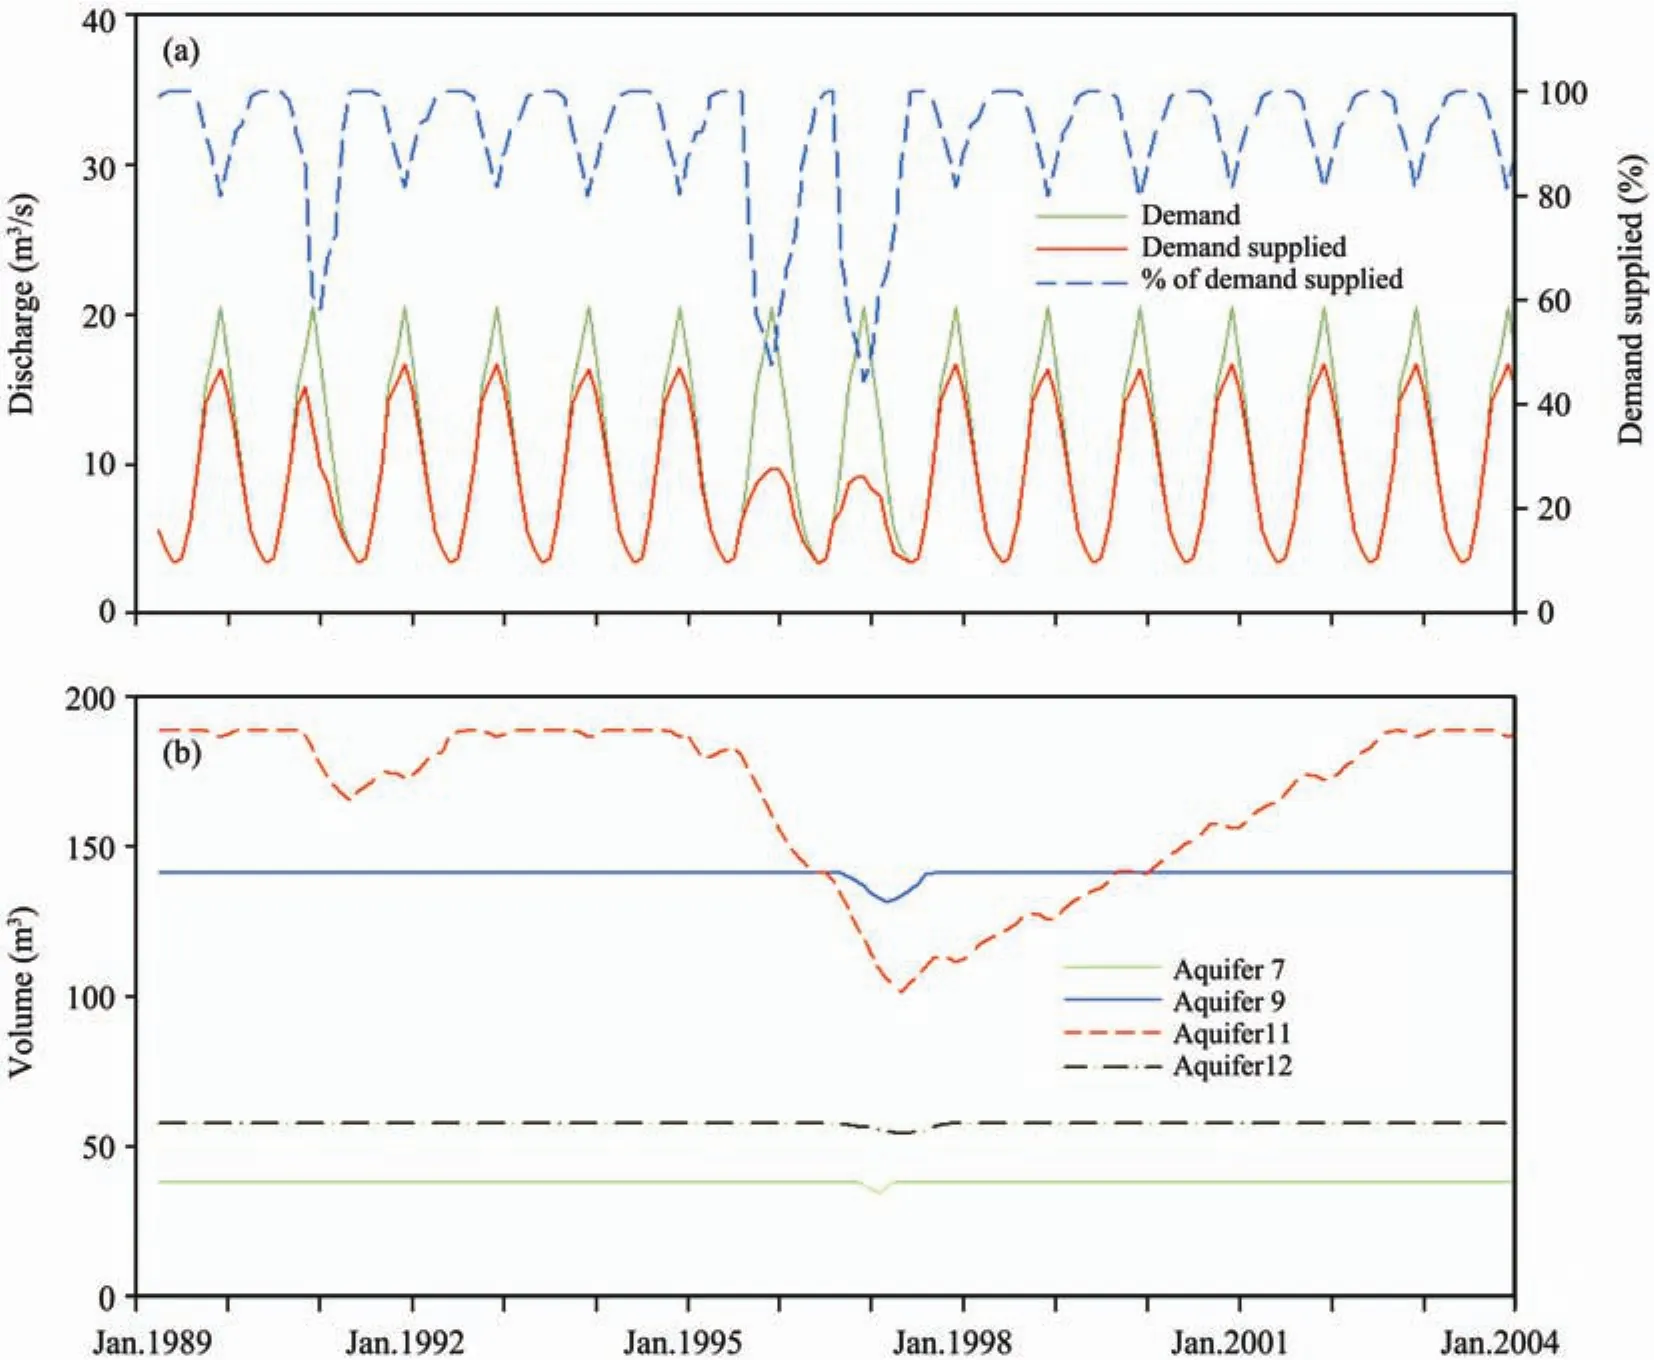
Figure 8 (a) Inter-annual variation of demand, demand supplied and percentage of demand supplied for the scenario of increased agricultural area, and (b) associated aquifer levels
5 Conclusions
In this paper, an integrated watershed management model was applied to identify water use efficiency in an arid watershed of central-northern Chile. The case study showed the capability of the MAGIC model to represent different components of the water supply and demand, after calibration of its parameters. Discharges in different measurement stations were adequately represented, as well as reservoir inputs and outputs, and aquifer levels.
The model allowed further determinations of water use efficiencies for the different irrigation sectors to be made.Clear differences were found for sectors below and above the main Puclaro Reservoir. The upstream areas showed higher irrigation efficiencies, due to the use of drip irrigation systems, but showed lower total water efficiency. This was explained by the differences in water rights between these two areas, with upstream sectors accounting for significantly more water rights per hectare. Therefore irrigation security was also much higher upstream of the Puclaro Reservoir,except for one irrigation sector, while the irrigation sectors downstream show water deficits in dry years.
Different scenarios were applied for the Elqui Valley,showing potential solutions to the current deficits in drought years. Two scenarios showed the impact of increasing water use efficiency on the reduction of water deficits in affected areas. By using pipes to typically reduce losses in open water channels, a significant improvement of the irrigation security can be achieved. When improving irrigation efficiency,less impact is achieved in the overall irrigation security,compared to the base case, but some areas show significant improvements, indicating that technical development of irrigation infrastructure is a valuable addition to management options. As such, these two scenarios show the importance of increased water use efficiency, by reducing both transportation and irrigation losses, to re-mediate part of the water deficiency in arid watersheds. Under drought conditions, however, surface water resources are still insufficient to supply all demand.
When the aquifers are allowed to supply the demand when surface water is deficient, it can be observed that most demand is met, even in drought years. Only one irrigation sector with limited groundwater resources was not in this case, with a water supply deficit persisting during part of the year. This supports the concept that integrated water resource management can be applied to resolve water deficits experienced in all but one irrigation sector of the watershed.The use of modeling tools, such as the one presented in this paper, in combination with a detailed accounting of water resources, can effectively support a better allocation of available water resources to alleviate the current water deficits in the Elqui Valley.
A final observation made by this study was that there are limited possibilities to expand agricultural areas in this basin using existing surface water and groundwater rights. Great expansion would be only possible by increasing groundwater rights, but such an option might be unsustainable in the long term, with groundwater levels falling severely in drier years, which would be unlikely to recover soon, under normal rainfall conditions. As such, this scenario is not considered to be a viable management option.
This study was funded through a FNDR grant from the Chilean Government. The authors would like to thank the Chilean Water Authority for access to their datasets for the purpose of this study.
Allen RG, Pereira LS, Raes D, Smith M, 1998. Crop Evapotranspiration:Guidelines for Computing Crop Requirements. Irrigation and Drainage Paper No. 56, FAO, Rome, Italy, pp. 326.
CIREN (Centro de Información de Recursos Naturales), 1990. Atlas Agroclimático de Chile, Regiones IV a IX, Publicación CIREN Nr 87,Santiago, Chile, pp. 66.
INIA Intihuasi (Instituto de Investigaciones Agropecuarias), 1997. Proyecto PROMM-IV Región, Cartilla Divulgativa Nº10. INIA-CRI Intihuasi, La Serena, pp. 23.
Miller A, 1976. The climate of Chile. In: Schwerdfeger W (ed.). World Survey of Climatology, Climates of Central and South America, Vol. 12.Elsevier Scientific Publ., Amsterdam, Netherlands, pp. 113–145.
Verbist K, Robertson AW, Cornelis WM, Gabriels D, 2010a. Seasonal predictability of daily rainfall characteristics in central northern Chile for dry-land management. J. Appl. Meteor. Climat., 49: 1938–1955.
Verbist K, Santibañez F, Santibañez P, Gabriels D, Soto G, 2010b. Atlas of Arid Zones in Latin America and the Caribbean UNESCO International Hydrological Programme, Montevideo, Uruguay, pp. 56.
 Sciences in Cold and Arid Regions2013年1期
- Sciences in Cold and Arid Regions的其它文章
- G-WADI––the first decade
- G-WADI PERSIANN-CCS GeoServer for extreme precipitation event monitoring
- Wavelet analysis of the hydrological time series of Dalai Lake, Inner Mongolia, China
- Time-series analysis of monthly rainfall data for the Mahanadi River Basin, India
- Precipitation-runoff simulation for a Himalayan River Basin,India using artificial neural network algorithms
- Coping with water scarcity in Kashafroud G-WADI Basin,Iran: climate change or growing demands?