
G-WADI PERSIANN-CCS GeoServer for extreme precipitation event monitoring
2013-10-09 08:10KuolinHsuScottSellarsPhuNguyenDanBraithwaiteWeiChu
Kuolin Hsu , Scott Sellars, Phu Nguyen, Dan Braithwaite, Wei Chu
Department of Civil and Environmental Engineering and Center for Hydrometeorology and Remote Sensing, University of California-Irvine, Irvine, CA 92697-2175, USA
1 Introduction
Society understands that one of the most important aspects of human survival is the ability to observe, monitor and adapt to extreme and/or catastrophic events. Meteorological phenomena causing extreme weather events continue to directly impact society with heavy precipitation potentially causing infrastructure damage, flash floods and regional flooding. Anticipating and understanding these extreme weather events and their impacts on society using state-of-the-art tools, models and visualization products give emergency managers and planners the information they need to alert the public of an occurring extreme weather event and potential impacts. Having been developed under the collaboration of the Center for Hydrometeorology and Remote Sensing (CHRS) and the UNESCO International Hydrological Program (IHP)-Water and Development Information for Arid Lands—a Global Network (G-WADI) program, the G-WADI Precipitation Estimation from Remotely Sensed Information using Artificial Neural Networks—Cloud Classification System (PERSIANN-CCS) GeoServer (G-WADI GeoServer) is a state-of-the-art tool that harnesses remotely sensed information to observe, monitor and analyze extreme weather events as they occur. The G-WADI GeoServer can display near real-time global coverage (60°N to 60°S) high-resolution precipitation, even in remote areas and over oceans where observations are limited (http://hydis.eng.uci.edu/gwadi/).
Remotely sensed data provides us with an excellent window into global precipitation. Ground based observations lack the spatial and temporal uniformity that characterizes the true nature of precipitation events. Satellites have emerged as a solution to limited aerial coverage and lower temporal resolution of ground based observations. High spatial and temporal resolutions of satellite estimates and ob-servations are the main advantages of remotely sensed precipitation estimates over in-situ measurements. To provide precipitation data to users around the world, the CHRS at the University of California, Irvine has developed a publicly available Web-based GeoServer to host and serve our precipitation estimates at near real-time. Our precipitation product,PERSIANN-CCS, is derived using neural network techniques to estimate precipitation rates from geostationary infrared satellite data with calibration from microwave imagery.
The G-WADI GeoServer has a number of advanced features for quick access to precipitation event information.The user interface allows the user to zoom into a region for high-resolution views of occurring local precipitation. Geographical layers can be added to the region of interest. These additional layers can include country and watershed boundaries, rivers and topography. Additionally, the interface provides access to various precipitation accumulations. A further discussion on the available options provided by the G-WADI GeoServer is provided below.
In this paper, we describe the PERSIANN-CCS algorithm and data product and use of the G-WADI GeoServer interface for interactive visualization of near real-time extreme events. The paper is organized as follows. Section 2 describes details of the PERSIANN-CCS algorithm and precipitation estimates. In addition, the G-WADI GeoServer is introduced and is used for monitoring an extreme flood event in Beijing, China during July 21, 2012. Section 3 will discuss a validation study conducted with a dense network of rain gauges in Thailand during July of 2011. Finally, we will conclude in Section 4 with a summary of the main concepts of the paper.
2 Remotely sensed precipitation and the G-WADI PERSIANN-CCS GeoServer
2.1 CHRS global precipitation measurements
CHRS has long been involved in research related to satellite-based estimations of precipitation with the goal of achieving an accuracy and spatio-temporal resolution suitable for hydrological research and applications. Through continuous efforts and investigations, we have developed the PERSIANN algorithm (Hsuet al., 1997, 1999; Sorooshianet al., 2000, 2002). Some relevant activities have been: (1)development of an adaptive precipitation retrieval algorithm version using Artificial Neural Networks (Hsuet al.,1997, 1999; Sorooshianet al., 2000); (2) cloud classifications from individual cloud pixels to individual cloud patches based on the PERSIANN-Cloud Classification System (Honget al., 2004; Hsuet al., 2007; Behrangiet al.,2010a); (3) improvement of precipitation estimates using enhanced multi-spectral data from the GOES-R satellite(PERSIANN-MSA: Behrangiet al., 2010a,b); (4) development of precipitation estimates based on cloud patch dynamic tracking (LMODEL: Bellerbyet al., 2009; Hsuet al.,2009); and (5) development of precipitation estimates based on the combination of Low Earth Orbit (LEO) and Geostationary Earth Orbit (GEO) satellite information (REFAME:Behrangiet al., 2010c, 2012).
The collaboration between CHRS and UNESCO’s International Hydrological Program has produced the development of several online precipitation mapping resources.The most advanced of these resources is the G-WADI PERSIANN-CCS GeoServer, which is a near real-time global precipitation visualization and data server providing near-global mapping of satellite-based precipitation estimates at 0.04°×0.04° spatial resolution using a real-time implementation of the PERSIANN-CCS algorithm (accessible at http://hydis.eng.uci.edu/gwadi/).
PERSIANN-CCS implements image processing and pattern classification techniques based on the analysis of longwave infrared images from geostationary satellites. The input satellite images go through an image segmentation step to separate cloud patches from their image background using a "watershed segmentation process" (Vincent and Soille, 1991; Dobrinet al., 1994). Cloud patches are treated as independent objects and described by object features. For each cloud patch, features such as cloud patch coldness, size,shape, and texture are extracted. These cloud patch objects are separately classified based on an unsupervised self-organizing feature map-clustering scheme. Finally, each classified patch’s precipitation distribution is determined using the appropriate set of GEO longwave brightness temperature to precipitation rate (Tb-R) functions. These PERSIANN-CCS steps are diagramed in Figure 1.
In the initial training stage, precipitation data from radar and passive microwave satellites are assigned to classified patch groups and the empirical relationships are estimated between cloud patch properties and precipitation. This relationship is non-linear as cloud properties and rain rates incorporate many complexities. Parameters for each of the nonlinearTb-Rfunctions are calibrated from the spatial and temporal co-located satellite image and radar/PMW precipitation map pixel values. Detailed descriptions of PERSIANN-CCS can be found from Honget al.(2004) and Hsuet al.(2007).
2.2 G-WADI PERSIANN-CCS GeoServer
As a member of UNESCO’s program for G-WADI,CHRS supports the broad vision and objectives of G-WADI in improving the understanding of the hydrologic systems’specific characteristics and water management needs in arid areas. Development of the G-WADI GeoServer further extends to the public, both the data and experience.
The G-WADI GeoServer is designed to provide user-friendly Web-based visualization and mapping of satellite-based precipitation estimates. The server utilizes the open-source MapServer technology (http://mapserver.org//)from the University of Minnesota to provide real-time visualization of precipitation for the most recent 3, 6, 12, 24, 48 and 72-hour accumulation periods, mapped over various basemaps and overlaid with layered vector information, such as country, state and watershed boundaries. The server also provides updated precipitation summaries for each watershed, including minimum, mean, maximum and average precipitation within the rain-area, while updating and populating database tables with this data. Figure 2 shows the G-WADI GeoServer interface, which consists of (1) a map layer control menu, (2) an interactive reference map, (3)map navigation and query menu, (4) a map canvas, and (5) a location bar. The layer control menu includes four sections that allow the user to add one or more vector overlays,choose the PERSIANN-CCS data accumulated period and select a baseline image map.
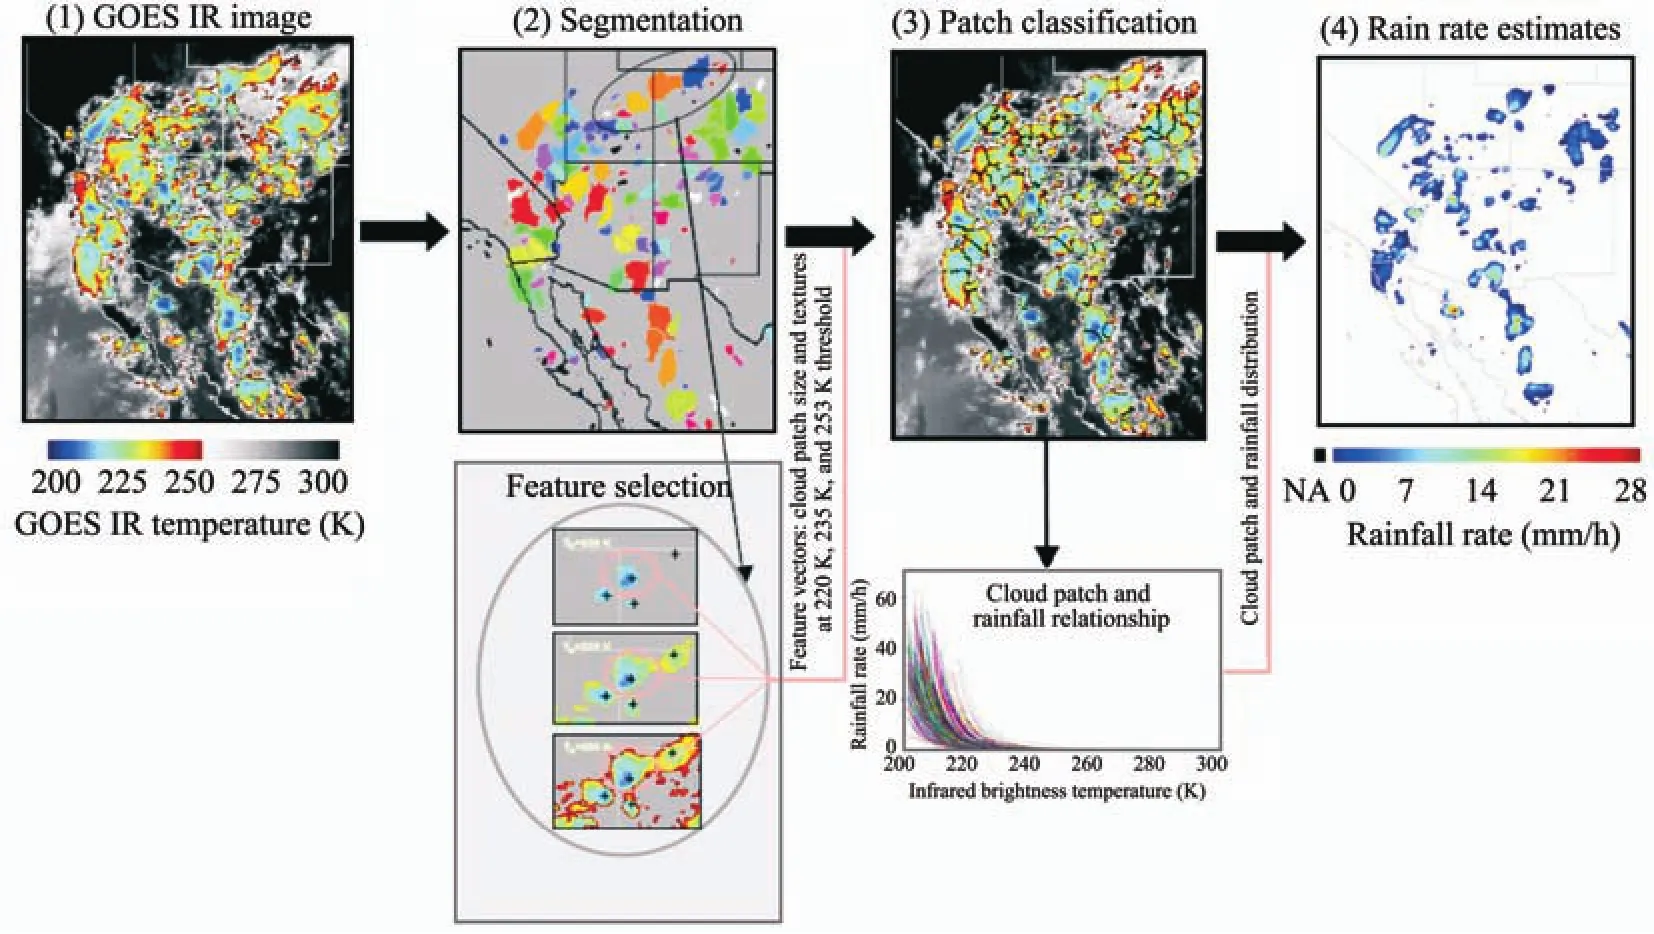
Figure 1 Cloud image segmentation, feature extraction, classification, and precipitation estimation of the PERSIANN-CCS algorithm. Precipitation estimation using the PERSIANN-CCS algorithm consists of four major steps: (1) GEO-IR cloud image segmentation, (2) feature extraction from GEO-IR cloud patches, (3) patch feature classification to cloud type,and (4) precipitation estimation according to cloud type
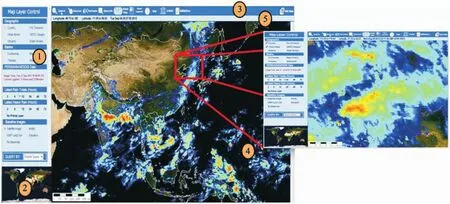
Figure 2 Components of the G-WADI GeoServer web-interface, including: (1) map layer control menu, (2) interactive reference map, (3) map navigation and query menu, (4) map canvas, and (5) location bar
From the initial global view, a user can zoom and pan to an area or event of interest. An event can be tracked by showing successive accumulation periods up to 72 hours.The3hrwill show the most recent three hours of accumulated precipitation. Clicking on the6hrwill show you what happened for the three hours before the event and how the weather system has moved. The high spatial resolution(0.04°×0.04°) of the PERSIANN-CCS data allows for many levels of zoom, down to a very fine scale. Overlaying the basin boundaries and streams will help a user visualize how runoff will contribute to flooding potential. Another helpful feature of the G-WADI GeoServer is the ability to query by pixel, basin, political division or country. Each query produces a report page showing not only the recent precipitation accumulations, but also including areas with the heaviest precipitation, climate information, basemap data such as aridity and elevation, and even a link to download precipitation data. Once a desired area is defined, the data for all the various accumulation totals can be easily downloaded using the "get data"button. The user can manually adjust the bounding coordinates before submitting the selection, and the server will provide links for each accumulation total for the chosen subset area.
One important aspect of the G-WADI GeoServer is that all of the software and technical work is done on the server and the user, whether they are a GIS expert using a workstation or a farmer using a simple personal computer, only needs to have a modern browser and internet access to take advantage of all of the tools available on the G-WADI GeoServer. With quick and easy access to precipitation data over remote regions,extreme weather events can be observed. These observations provide the user with critical information for planning purposes. A tutorial describing the functions of G-WADI is made available in several languages (English, Farsi, Chinese, and Spanish), which can be found at URL address: http://persiann.eng.uci.edu/gwadi_tutorial_videos.html.
2.3 G-WADI GeoServer for extreme event monitoring
Emergency managers play a critical role in alerting and informing the public on potential severe weather and extreme precipitation events. Considering that precipitation is such a challenging meteorological variable to observe and monitor, especially in remote regions, the use of satellite information and derived precipitation estimates give emergency managers access too much needed extreme precipitation observations. The extreme precipitation event over Beijing, China on July 21, 2012, described below, will be used to showcase the functionality of the G-WADI GeoServer.
Starting in the early morning of July 21, 2012, and continuing throughout the afternoon, a series of severe thunderstorms developed over Beijing and surrounding districts. By the morning of the July 22, news reports stated that upwards of 170 mm of precipitation fell, on average, over the entire region of Beijing. Local news reports suggested point source daily precipitation totals over 300 mm and upwards of 450 mm occurred during the extreme precipitation event. Widespread flooding in Beijing and surrounding districts was observed and is considered to be the worst flooding event in over 60 years. A minimum of 77 people died and over 700,000 residents were evacuated.
To illustrate the functionality of the G-WADI GeoServer from the perspective of the emergency manager monitoring the event, the web-interface (Figure 2) allows the user to zoom in to display the current extreme event over Beijing.Figure 3 shows a near real-time precipitation accumulation total for the three hours prior to 12:00 UTC on July 21, 2012.This 3-hour period was during the flooding event and showed the accumulations across western portions of Beijing. Because this event lasted roughly more than 12 hours, a user might then choose to view additional accumulation totals (such as the 24-hour accumulation) to gain further insight into the extreme precipitation event.
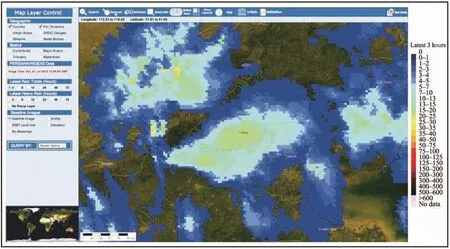
Figure 3 G-WADI GeoServer visualization of 3-hour accumulated precipitation totals in millimeters (mm)on July 21, 2012 at 12:00 UTC, centered over Beijing, China
The user or emergency manager can quickly access past 24-hour precipitation accumulation totals prior to the extreme Beijing event (24-hour period from 12:00 UTC,July 20, 2012 to 12:00 UTC, July 21, 2012) to assess the potential for flooding (Figure 4) and visualize the spatial patterns of precipitation over his or her district. In Figure 4,we can see that there is substantial precipitation over the western districts of Beijing, which may prompt the emergency manager to undertake further analysis of the region.After the extreme precipitation event disipates, the user can display 24-hour (up to 72-hour) accumulation totals (Figure 5), which would allow them to view the accumulated precipitation generated from the the last 24 hours of the event. Data from the Beijing extreme precipiation event can be downloaded from the G-WADI GeoServer site using the "get data"icon in the top right hand corner of the tool bar.
Through the combination of near real-time precipitation visualization and monitoring, event evaluation, watershed reports, and data access, the G-WADI GeoServer gives the user quick access to visualizing precipitation data and the ability to download the data for future analysis.
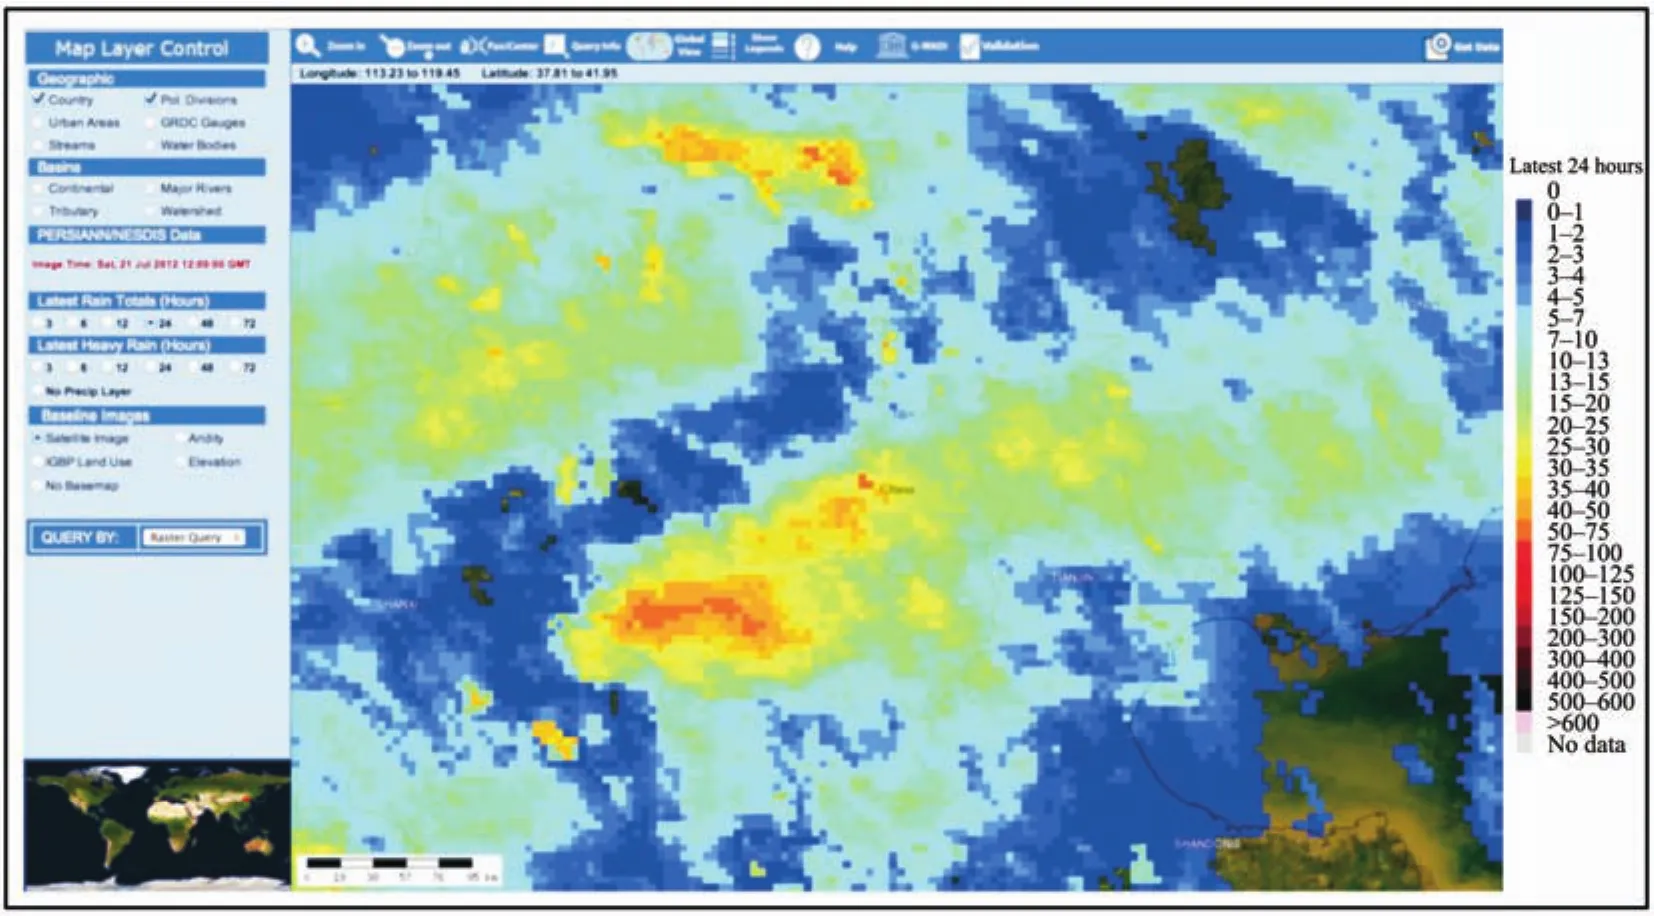
Figure 4 G-WADI GeoServer visualization of 24-hour accumulated precipitation totals in millimeters (mm) from 12:00 UTC on July 20, 2012 to 12:00 UTC on July 21, 2012, centered over Beijing, China. This time period reflects most of the precipitation that occurred before the extreme event that caused the catastrophic flooding

Figure 5 G-WADI GeoServer visualization of 24-hour accumulated precipitation totals in millimeters (mm) from 22:00 UTC on July 21, 2012 to 22:00 UTC on July 22, 2012, displaying widespread heavy precipitation across Beijing, China and surrounding districts
3 Evaluation of GWADI PERSIANN-CCS precipitation: 2011 Thailand flood event
Floods are among the most devastating natural disasters for Thailand. Tropical storm Nock-Ten formed to the east of the Philippines on July 22, 2011. Nock-Ten propagated westwards to impact the Philippines, China, Vietnam, Laos and finally Thailand. By July 30, 2011, Nock-Ten began impacting Thailand (see Figure 6). Nock-Ten was ranked as one of the most severe natural disasters in terms of number of people affected and economic costs. Over eight million people were affected (reported by MRC, 2011) and economic damages totaled $45.7 billion (estimated by World Bank, 2011). In this case study, satellite-based PERSIANN-CCS precipitation data is evaluated using data from a network of rain gauges across Thailand.

Figure 6 G-WADI GeoServer visualization of Nock-Ten storm 72-hour accumulated precipitation totals in millimeters (mm) from 00:00 UTC on July 29, 2011 to 00:00 UTC on August 1, 2011, displaying widespread heavy precipitation across Thailand and surrounding counties
This evaluation was carried out over Thailand with an area of more than 500,000 km2(Figure 7). Three months(July to September, 2011) of daily precipitation data from 119 rain gauge stations were obtained from the Thailand Meteorological Department. On average, there is a single rain gauge per 60×60 km2area. Figure 7 shows the rain gauge locations, which are relatively uniformly distributed over the country. Daily precipitation data was collected each day at 07:00 am local time (which equates to 00:00 UTC)for the previous 24 hours. Daily PERSIANN-CCS data was collected for the same three-month period.
Three evaluation statistics are used for evaluating the PERSIANN-CCS precipitation estimates over Thailand: (1)Correlation Coefficient (CORR), (2) Root Mean Square Error (RMSE) and (3) Bias (BIAS). A scatter plot of the mean daily gauge precipitation accumulations versus co-located mean daily PERSIANN-CCS precipitation accumulations for the 3-month period is illustrated in Figure 8a. The correlation coefficient of gauge and PERSIANN-CCS mean daily precipitation is 0.8. Accordingly, the root mean square error is 3.68 mm and the bias value is -0.13. Figure 8b shows the same data as a time series plot of mean daily precipitation for both PERSIANN-CCS and gauge data for the 3-month period. In these graphs, the mean daily PERSIANN-CCS data compares well with the mean daily rain gauge data for the study area and selected time period.
Figure 9 shows the interpolated spatial distribution of CORR for PERSIANN-CCS and gauge data during the 3-month time period. The CORR is calculated at each gauge point based on the daily precipitation total from the gauge and corresponding PERSIANN-CCS precipitation point estimates for the 3-month period. The calculated point CORRs are then extended to the whole study area using the Inverse Distance Weighted (IDW) method. CORR values range from 0 (no correlation) in some regions to 0.8 in the northern regions of the country. The spatial distribution of CORR suggests PERSIANN-CCS data compares well in some parts of northern Thailand and less well in the southern portions of Thailand during July through September of 2011.
Because of the complex nature of the southwest monsoon that impacts Thailand (May–November), extremely wet conditions can persist for months with intermittent extreme precipitation events embedded within the climatologically wet season. The flooding of 2011 in Thailand is partially blamed on the Nock-Ten storm. One of the intermittent extreme events occurred on September 10 to 11,2011, producing even higher mean precipitation totals. The two peak precipitation events occurred on July 31, 2011 and September 11, 2011, highlighted in Figure 8b. These two specific events are evaluated to see the performance of PERSIANN-CCS estimates.

Figure 7 Study area and rain gauge locations

Figure 8 (a) Scatter plot of mean daily PERSIANN-CCS precipitation point estimates and corresponding mean daily precipitation gauge estimates. (b) Time series of mean daily PERSIANN-CCS precipitation point estimates and corresponding mean daily precipitation gauge estimates from July 1 to September 31, 2011. The two peak precipitation events are highlighted with dashed blue lines on July 31, 2011 and September 11, 2011

Figure 9 Spatial distribution of the correlation coefficients of PERSIANN-CCS to rain gauge precipitation.The CORR is estimated at gauge points and then interpolated for the entire region using the Inverse Distance Weighted (IDW) method
Figure 10a shows the scatter plot of the 119 gauge station precipitation estimates and corresponding PERSIANN-CCS pixel values for July 31, 2011. The correlation coefficient (CORR) is 0.24. Figures 10b and 10c show the spatial distributions of PERSIANN-CCS and rain gauge data, for comparison. The gauge data are interpolated from the observation values of the 119 stations by using the Inverse Distance Weighted (IDW) method. Overall, precipitation distributions for PERSIANN-CCS and gauge estimates are similar (see Figures 10b and 10c). Precipitation intensity,on the other hand, shows that PERSIANN-CCS underestimated high precipitation amounts, while performing well for low and medium precipitation amounts from a point scale comparison.
Figure 11 shows the comparison of PERSIANN-CCS and rain gauge data on September 11, 2011. In this case,there is an improvement from the previous example with a higher correlation coefficient (CORR=0.53) (see Figure 11a). PERSIANN-CCS was capable of capturing most of the regions with heavy precipitation amounts, especially in the southern regions of Thailand (see Figures 11b and 11c).
Overall, daily mean PERSIANN-CCS precipitation estimates matched rain gauge precipitation estimates well during the study period. Daily point data evaluation present only moderate agreement for low and high precipitation amounts and somewhat overestimated medium precipitation amounts in this case. In the two examples of daily heavy precipitation events, the spatial features of the precipitation distribution were captured by satellite-based data for most regions, although point-to-point comparison results vary. The high agreement in daily mean data together with the ability to capture overall spatial distribution of daily precipitation suggest that PERSIANN-CCS daily data could be used for precipitation and flood analysis for this study region.
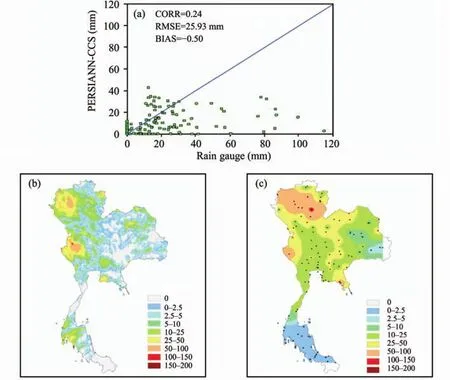
Figure 10 Comparison of PERSIANN-CCS and rain gauge data on July 31, 2011: (a) Scatter plot of PERSIANN-CCS precipitation estimates vs. rain gauge estimates in millimeters (mm), (b) spatial distribution of PERSIANN-CCS precipitation estimates,and (c) interpolated spatial distribution of rain gauge estimates, with gauge locations marked in black
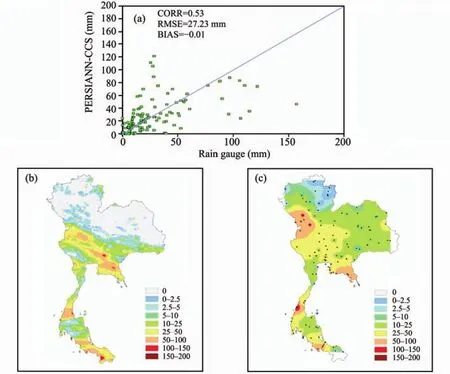
Figure 11 Comparison of PERSIANN-CCS and rain gauge data on July 31, 2011: (a) scatter plot, (b) PERSIANN-CCS,(c) rain gauge interpolated and gauge locations marked
4 Summary
This paper describes the application of the CHRS G-WADI PERSIANN-CCS GeoServer near real-time precipitation monitoring system for extreme event visualization,online mapping and data service. The precipitation data available on the G-WADI GeoServer, PERSIANN-CCS high-resolution precipitation estimates, is greatly enhanced by the user-friendly Web-based interface, providing many useful tools and options for the visualization and analysis of extreme precipitation events.
Accurate precipitation monitoring is important to improving flood forecasting and public preparedness for hazardous weather. Higher resolution precipitation data is needed for improved monitoring and prediction of extreme precipitation and floods. The goal of achieving an accurate and high spatio-temporal resolution precipitation product suitable for extreme precipitation event monitoring continues to be a challenging problem. This challenge must be confronted due to the serious consequences of not having precipitation data available in remote regions.
Flooding, caused by extreme precipitation, creates some of the most frequent and widespread natural disasters in human history, affecting an estimated hundred million people each year. PERSIANN-CCS shows great potential for helping regional planners and emergency managers around the world to address these types of extreme events by providing easy access to quality near real-time precipitation data. Our case studies demonstrated in this paper show the user-friendly G-WADI GeoServer interface and its usefulness in monitoring two extreme precipitation and flood events—in China near Beijing and in Thailand. The results demonstrated the great potential of using G-WADI PERSIANN-CCS precipitation estimates for precipitation monitoring, emergency management and hydrologic applications. Continued evolution of precipitation estimation algorithms, such as PERSIANN-CCS, must be seen as a leading area of research with many applications for remotely-sensed, global high-resolution data products. Although many problems and uncertainties continue to exist, our results give some confidence for the application and usage of our PERSIANN-CCS precipitation estimates and the G-WADI GeoServer.
The authors wish to acknowledge Prof. Soroosh Sorooshian, director of CHRS, for his support and guidance.Dr. Bisher Imam (formerly at CHRS and now at UNESCO)is to be acknowledged for his development of CHRS G-WADI website and its many unique features and ease of functionality. The authors thank Thai Meteorological Department for providing rain gauge measurement for this experiment. Partial financial support was provided by the NASA-PMM (Grant No. NNX10AK07G), the US Army Research Office project (Grant No. W911NF-11-1-0422)and National Weather Service.
Behrangi A, Hsu K, Imam B, Sorooshian S, 2010a. Daytime precipitation estimation using bi-spectral cloud classification system. Journal of Applied Meteorology and Climatology, 49(5): 1015–1031.
Behrangi A, Hsu K, Imam B, Sorooshian S, Huffman G, Kuligowski RJ,2010b. PERSIANN-MSA: A precipitation estimation method from satellite-based multi-spectral analysis. Journal of Hydrometeorology, 10(6):1414–1429.
Behrangi A, Hsu K, Sorooshian S, 2012. Summertime evaluation of REFAME for near real-time high resolution precipitation estimation over the United States. Journal of Hydrology, 456–457: 130–138.
Behrangi A, Imam B, Hsu K, Sorooshian S, Bellerby TJ, Huffman G, 2010c.Rain estimation using forward adjusted-advection of microwave estimates (REFAME). Journal of Hydrometeorology, 11: 1305–1321.
Bellerby T, Hsu K, Sorooshian S, 2009. LMODEL: A satellite precipitation algorithm using cloud development modeling and model updating, Part I:model development and calibration. Journal of Hydrometeorology, 10(5):1081–1095.
Dobrin BP, Viero TJ, Gabbouj M, 1994. Fast watershed algorithms: analysis and extensions. Nonlinear Image Processing V, 2180: 209–220.
Hong Y, Hsu K, Gao X, Sorooshian S, 2004. Precipitation estimation from remotely sensed information using an artificial neural network—cloud classification system. Journal of Applied Meteorology, 43: 1834–1852.
Hsu K, Bellerby T, Sorooshian S, 2009. LMODEL: A satellite precipitation algorithm using cloud development modeling and model updating, Part II: model updating. Journal of Hydrometeorology, 10(5): 1096–1108.
Hsu K, Gao X, Sorooshian S, Gupta HV, 1997. Precipitation estimation from remotely sensed information using artificial neural networks. Journal of Applied Meteorology, 36(9): 1176–1190.
Hsu K, Gupta HV, Gao X, Sorooshian S, 1999. Estimation of physical variables from multiple channel remotely sensed imagery using a neural network: application to rainfall estimation. Water Resources Research, 35(5):1605–1618.
Hsu K, Hong Y, Sorooshian S, 2007. Rainfall estimation using a cloud patch classification map. In: Levizzani V, Bauer P, Turk FJ (eds.). Measurement of Precipitation from Space: EURAINSAT and Future. Springer Publishing Company, pp. 329–342.
Mekong River Commission (MRC), 2011. Flood Situation Report 2011.MRC Technical Paper No. 36, November 2011.
Sorooshian S, Hsu K, Gao X, Gupta H, Imam B, Braithwaite D, 2000.Evaluation of PERSIANN system satellite-based estimates of tropical rainfall. Bulletin of the American Meteorological Society, 81(9):2035–2046.
Sorooshian S, Gao X, Hsu K, Maddox RA, Hong Y, Gupta HV, Imam B,2002. Diurnal variability of tropical rainfall retrieved from combined GOES and TRMM satellite information. Journal of Climate, 15:983–1001.
The World Bank, 2011. The World Bank supports Thailand’s post-floods recovery effort. Feature Story, December 13, 2011.
Vincent L, Soille P, 1991. Watersheds in digital spaces: an efficient algorithm based on immersion simulations. IEEE Transactions on Pattern Analysis and Machine Intelligence, 13(6): 583–598.
 Sciences in Cold and Arid Regions2013年1期
- Sciences in Cold and Arid Regions的其它文章
- G-WADI––the first decade
- Water use efficiency in an arid watershed: a case study
- Wavelet analysis of the hydrological time series of Dalai Lake, Inner Mongolia, China
- Time-series analysis of monthly rainfall data for the Mahanadi River Basin, India
- Precipitation-runoff simulation for a Himalayan River Basin,India using artificial neural network algorithms
- Coping with water scarcity in Kashafroud G-WADI Basin,Iran: climate change or growing demands?