Standardization of CPUE for Chilean Jack Mackerel (Trachurus murphyi) from Chinese Trawl Fleets in the High Seas of the Southeast Pacific Ocean
LI Gang1), 2), 3), 4), ZOU Xiaorong1), 2), 3), 4), *, CHEN Xinjun1), 2), 3), 4), ZHOU Yinqi1), 2), 3), 4),and ZHANG Min4)
Standardization of CPUE for Chilean Jack Mackerel () from Chinese Trawl Fleets in the High Seas of the Southeast Pacific Ocean
LI Gang, ZOU Xiaorong, CHEN Xinjun, ZHOU Yinqi,and ZHANG Min
1),,201306,2),,,201306,3),,,,201306,4),,201306,
The generalized linear model (GLM) and generalized additive model (GAM) were applied to the standardization of catch per unit effort (CPUE) for Chilean jack mackerel from Chinese factory trawl fishing fleets in the Southeast Pacific Ocean from 2001 to 2010 by removing the operational, environmental, spatial and temporal impacts. A total of 9 factors were selected to build the GLM and GAM,., Year, Month, Vessel, La Niña and El Niño events (ELE), Latitude, Longitude, Sea surface temperature (SST), SST anomaly (SSTA), Nino3.4 index and an interaction term between Longitude and Latitude. The first 5 factors were significant components in the GLM, which in combination explained 27.34% of the total variance in nominal CPUE. In the stepwise GAM, all factors explained 30.78% of the total variance, with Month, Year and Vessel as the main factors influencing CPUE. The higher CPUE occurred during the period April to July at a SST range of 12–15℃ and a SSTA range of 0.2–1.0℃. The CPUE was significantly higher in normal years compared with that in La Niña and El Niño years. The abundance of Chilean jack mackerel declined during 2001 and 2010, with an increase in 2007. This work provided the relative abundance index of Chilean jack mackerel for stock assessment by standardizing catch and effort data of Chinese trawl fisheries and examined the influence of temporal, spatial, environmental and fisheries operational factors on Chilean jack mackerel CPUE.
Chilean jack mackerel; standardization; CPUE; GLM; GAM
1 Introduction
The Chilean jack mackerel,, is a pelagic fish species widely distributed throughout the Southeast Pacific region, extending from Ecuador to southern Chile. It crosses the Pacific Ocean along the West Wind Drift from south-central Chile to New Zealand, which is known as the(Evseenko, 1987; Serra, 1991; Elizarov., 1993; Cubillos., 2008). The annual catch of Chilean jack mackerel in this area substantially increased from 1970 and peaked at about 4.7 million tons in 1995, followed by sharp decreases till 2010 (Fig.1; SPRFMO, 2010).
According to their allocations, there are mainly four fisheries in the Southeast Pacific region (Fig.2; SPRFMO, 2010). Of these, the northern Chile fishery operates in coastal water from the northern Chile boundary to 26˚S. The second fishery is near the central-south Chile from 26˚S to 43˚S, across the Chilean Economic Exclusive Zone (EEZ). The third fishery, referred to as the far north fishery, is close to the waters of Peru and Ecuador. The forth fishery is located in the high seas, off the center to the south of Chilean EEZ. Chilean jack mackerel was mainly caught by purse-seine fleets of Chile in the 1970s. During the 1970s–1980s, Japanese and Russian trawl fleets exploited Chilean jack mackerel in the high seas beyond the Chilean EEZ (Arcos., 2001; SPRFMO, 2010). Since 2000, international midwater trawl fleets from Belize, China, Faroe Islands, European Union, Korea, Russia, and Vanuatu have targeted Chilean jack mackerel on the high seas in the South Pacific region (SPRFMO, 2009). The first Chinese factory trawler KAIXIN carried out experimental exploitation of Chilean jack mackerel between 38˚–41˚S and outside the Chilean EEZ in 2000. Since then, Chinese trawl fleets have explored the stock in high seas (Fig.3), and the average annual catch is up to about 100 thousand tons. However, there were dramatic fluctuations in the total catch of Chilean jack mackerel during the last decade, with a total catch of 63.61 thousand tons only in 2010.
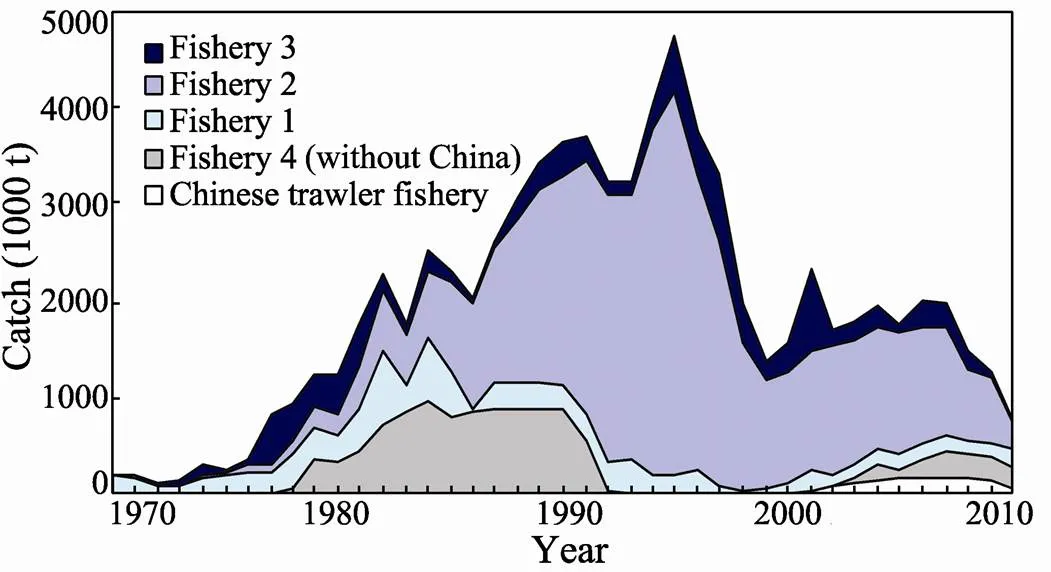
Fig.1 Total annual catch and catch components of Chilean jack mackerel in the Southeast Pacific Ocean (1970–2010).
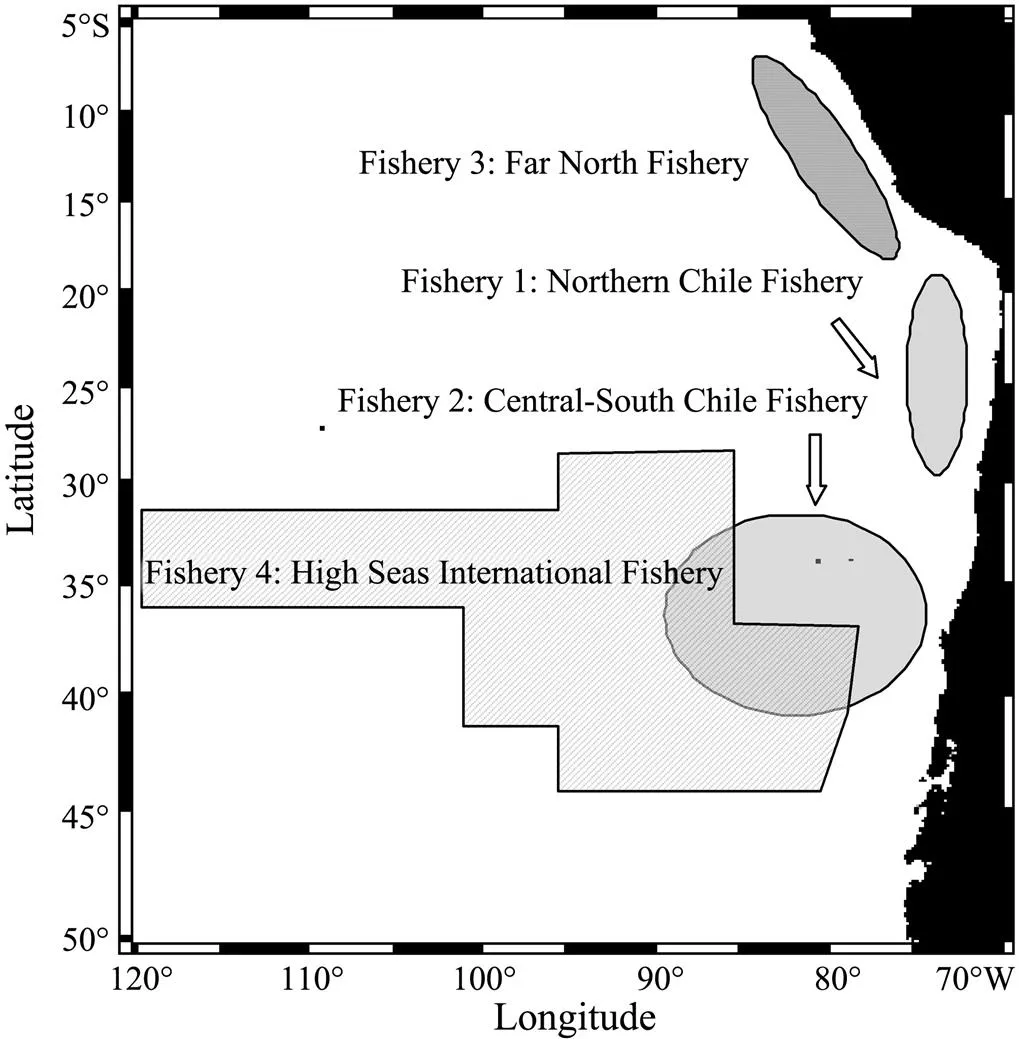
Fig.2 Location of the four Chilean jack mackerel fisheries in the Southeast Pacific Ocean.
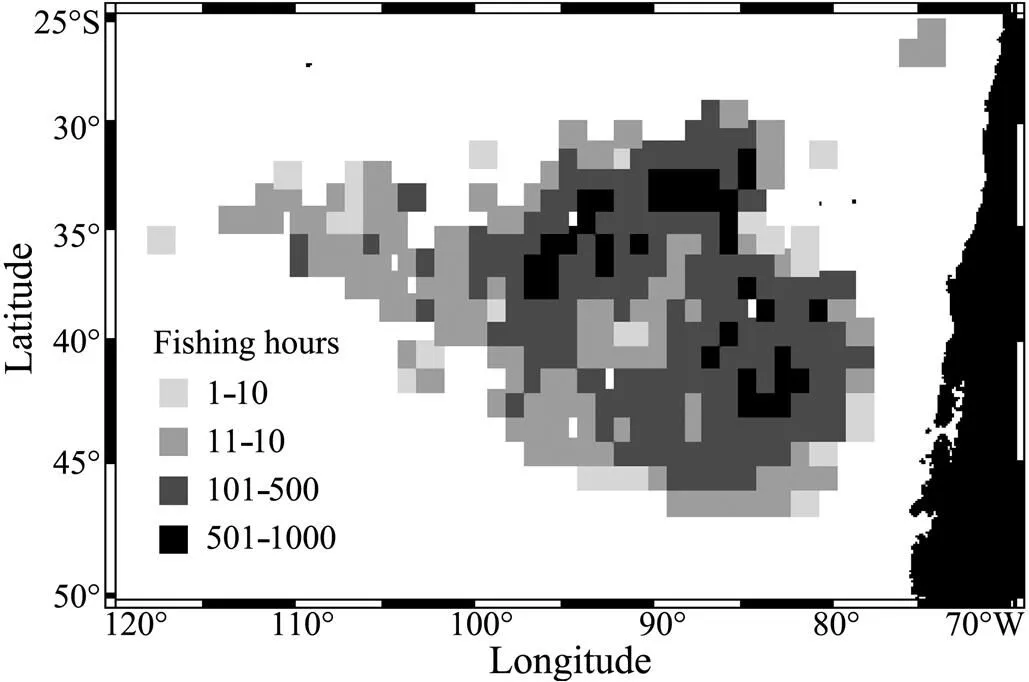
Fig.3 Spatial distribution of fishing effort (classified into four levels) by Chinese trawl fisheries during 2001–2010.
The catch per unit effort (CPUE) is a relative index of fish stock abundance (Hilborn and Walters, 2001; Nishida and Chen, 2004). It can be influenced by various factors such as fishing power and capacity (characteristics of fleet, fishing gear and equipment), environmental factors (, sea water temperature), and spatial and temporal factors (, latitude, longitude, year and month). For comparative study and fisheries management, the CPUE needs to be standardized with the impacts of relevant factors removed or minimized, allowing better reflection of the changes in fish population abundance (Maunder and Punt, 2004). A variety of methods have been developed to standardize the catch and effort data, including generalized estimating equations (GEE, Bishop., 2000), habitat-based model (Bigelow., 2002), general linear models (GLMs, Maynou., 2003), and general additive models (GAMs, Bigelow., 1999). Of these, GLMs and GAMSs are the most commonly used methods (Nishida and Chen, 2004; Campbell, 2004; Venables and Dichmont, 2004). Previous studies have indicated that the population dynamics and fishing habitat of Chilean jack mackerel are influenced by environmental variables such as sea surface temperature (SST) and El Niño phenomenon (Arcos., 2001; Torres-Peña., 2005; Cubillos., 2008; Elías., 2009; Sepúlveda., 2009). However, few studies have been reported on CPUE standardization for Chilean jack mackerel in the Southeast Pacific Ocean.
The first international consultation on establishment of the proposed South Pacific Regional Fisheries Management Organization (SPRFMO) was held in New Zealand in 2006. Chilean jack mackerel was one of the main management objects by SPRFMO, and the status of this fish resource has been assessed by Chilean Jack Mackerel sub-group (JMSG) of the Science Working Group since 2009. However, the fishery-dependent abundance index data of the international fishery used in the stock assessment model were not standardized, and large variances were observed between the estimated and observed annual CPUE of Chinese trawl fishery (SPRFMO, 2010). The SPRFMO (2011) recommended that to serve as indices of abundance, the CPUE must be standardized and adjusted for factors such as historical changes in vessels, fishing areas, seasonal fishing patterns and environmental factors. Hence, the GLM and GAM methods were employed to standardize the nominal Chilean jack mackerel CPUE of Chinese trawl fisheries. The objectives of this study were: (1) to evaluate impacts of temporal, spatial, environmental and fisheries operational variables on the catch rate; and (2) to obtain an index of relative abundance for Chilean jack mackerel in high seas by using the CPUE data from Chinese trawl fisheries, which can be used for appropriate stock assessment of Chilean jack mackerel.
2 Material and Methods
2.1 Data Collection
The CPUE data of Chilean jack mackerel were collected from the logbooks of Chinese trawl vessels (Table 1). As required by SPRFMO, the data from 2001 to 2010 were on a daily basis incorporated with name of trawlers, duration of each tow, related start point and end location in latitude and longitude, and weight of catch per tow. Effort was measured as the trawl time in hours, and CPUE was expressed as ton per hour. Therefore, monthly catch rate by vessel in the 0.5˚ gridcells was calculated as the ratio of the recorded catch to the total fishing hours.

Table 1 Technical information of the Chinese trawlers
Note: Code is a categorical index of the fishing efficiency of 7 trawlers and served a variable in the generalized linear model and generalized additive model.
In addition, environmental data, monthly SST, monthly SST anomaly (SSTA) and Nino 3.4 index (Trenberth, 1997) were assembled into the data records. The SST (9km resolution) and SSTA (1˚ resolution) were obtained from the Physical Oceanography Distributed Active Archive Center of National Aeronautics and Space Administration (http://poet.jpl.nasa.gov), and Nino 3.4 index was obtained from the Climate Prediction Center of National Oceanic and Atmospheric Administration (http://www. cpc.ncep.noaa.gov). El Niño and La Niña events (ELEs) were expressed as 1 and −1, respectively, while in normal years, the value of monthly ELE was 0. The SST data were averaged and SSTA data were interpolated to 0.5˚ grid cells to match the resolution of CPUE data.
2.2 Generalized Linear Model and Generalized Additive Model
The GLMs, formally introduced by Nelder and Wedderburn (1972) and developed by McCullough and Nelder (1989), are commonly used to standardize the CPUE data (Nishida and Chen, 2004; Maunder and Langley, 2004). It assumes that there is a linear relationship between the explanatory variables and the expected values of the response variable (Maunder and Punt, 2004):

whereis the differentiable and monotonic link function,µ(Y),Xis the vector that specifies the explanatory variables for the ith value of the response variable,is a vector of parameters, andYis theresponse.
The GAMs (Hastie., 2001) are extensions of GLMs (Maunder and Punt, 2004; Venables and Dichmont, 2004), which assume that the response variable is related to smooth additive functions of the explanatory variables (Guisan., 2002). The GAM is expressed as:

wherefis the smoother function, loess or splines smoother being commonly used (Maunder and Punt, 2004; Venables and Dichmont, 2004).
For the GLM and GAM analyses, temporal (Year and Month), spatial (Longitude and Latitude), fishing technological (Vessel code) and environmental factors (SST, SSTA and Nino3.4 index) are the explanatory variables, and the natural logarithm of the Chilean jack mackerel catch-rate +0.1 is the response variable. Constant 0.1 was added to deal with computational problem related to the undefined logarithm of zero (Maunder and Punt, 2004; Campbell, 2004; Su., 2008). Year, Month, Vessel code and ELE were the categorical variables in GLMs and the factors in GAMs, whereas the remaining five factors were used as continuous variables (covariates) in GLMs and GAMs. An interaction term between Longitude and Latitude was added to GLMs and GAMs. All analyses were based on the assumption regarding the normal distribution of log-transformed catch rate data, which was tested by plotting the frequency with fitted density curve. The identity link function was used with the Gauss distribution for the response variable ln(CPUE+0.1). The full GLM is as follows:
ln(+0.1)≈Year+Month+Vessel+Longitude+Latitude+ELE+SST+ SSTA+ Nino3.4index+Longtitude×Latitude. (3)
The full GAM is:
ln(+0.1)≈Year+Month+Vessel+ELE+(Longitude)+(Latitude)+(SST)+(SSTA)+(Nino3.4index)+(Longtitude, Latitude); (4)
where function() is the spline smoother function of the covariate.
Type III sums of squares were used to test the significance of each model parameter (Damalas., 2007). Stepwise GLM and GAM were used to identify the explanatory factors influencing CPUE, and the explanatory variables were added to GLM and GAM models one by one. Models were built by adding new variables and observing the corresponding improvement on the fit with non-significant variables omitted. Alternative model structures (different choices on the explanatory variables) were compared using the Akaike Information Criterion (AIC), pseudo-coefficient of determination (pseudo-), and adjusted pseudo-(Su., 2008). The optimal GLM or GAM was selected with the smallest AIC, largest pseudo-and adjusted pseudo-:
Pseudo-, (5)
Adjusted pseudo-=1−

3 Results
3.1 Distribution of Fishing Effort and Nominal CPUE
A total of 7011 data records were analyzed. The operational area of Chinese trawl fleets extended from outside the Chilean EEZ to 120˚W. Fishing was mostly operated on the high seas off central Chile, from 32˚S to 43˚S and 80˚W to 95˚W (Fig.3). The spatial distribution of nominal CPUE was similar to the fishing area, but other relatively higher nominal CPUEs were located in the far western region (100˚–104˚W, 37˚–41˚S; Fig.4). Fishing operation or fishing effort and nominal CPUE showed strong intra-annual variations and seasonal cycles, with peaks in the second or third quarter of each year except for 2001–2004 (Fig.5). In 2006 and 2008–2010, the CPUE and fishing effort showed consistent variation trends. The CPUE and effort were lowest in the first quarters, increased in the second quarters and approached a peak in the third quarters. During the fourth, the CPUE and effort declined sharply.
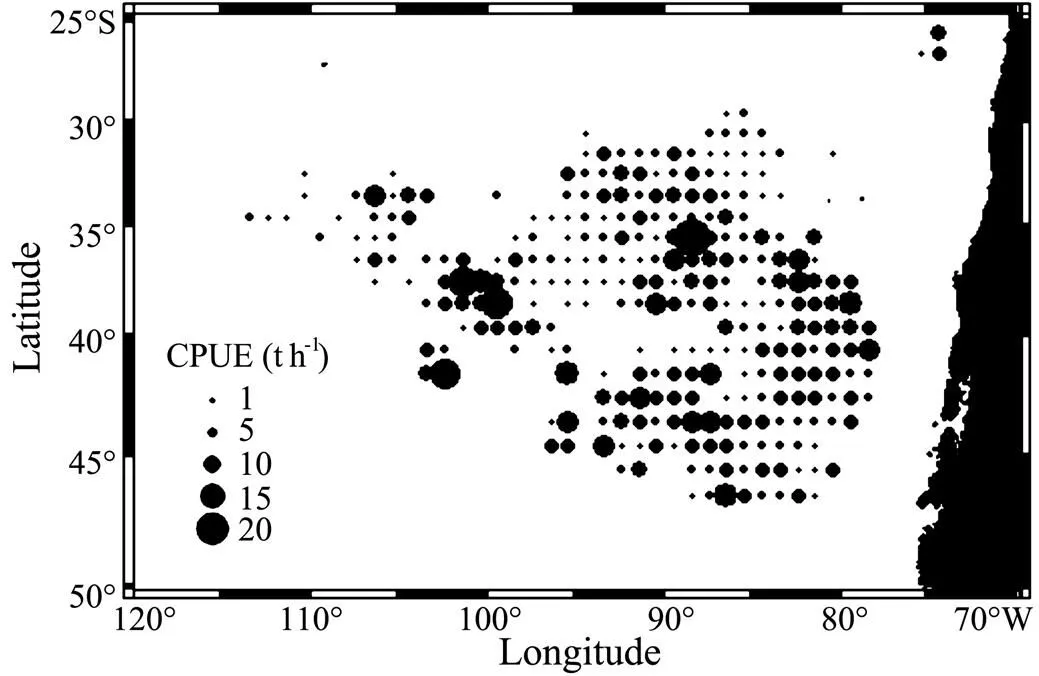
Fig.4 Geographical distribution of nominal Chilean jack mackerel CPUE (classified into five levels) of Chinese trawl fisheries during 2001–2010.
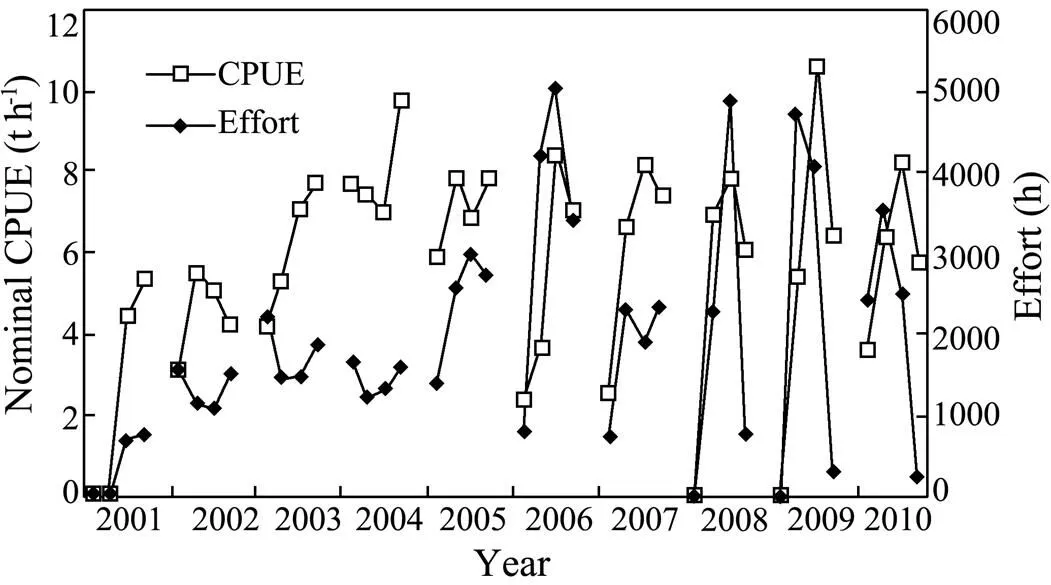
Fig.5 Monthly nominal CPUE and effort (fishing hours) of the Chinese trawl fisheries during 2001–2010.
3.2 Generalized Linear Model
The log-transformed catch rates,, ln(CPUE+0.1), showed normal distribution (=1.63,=1.14; Fig.6). Type III sums of squares analysis andtest revealed that 5 of 9 main effects, Year, Month, Vessel, ELE and Latitude were significantly different from zero at=0.01, while the other 5 variables and the interaction term were not (Table 2). Thus, these 5 factors were selected as the final explanatory variables for the GLM.
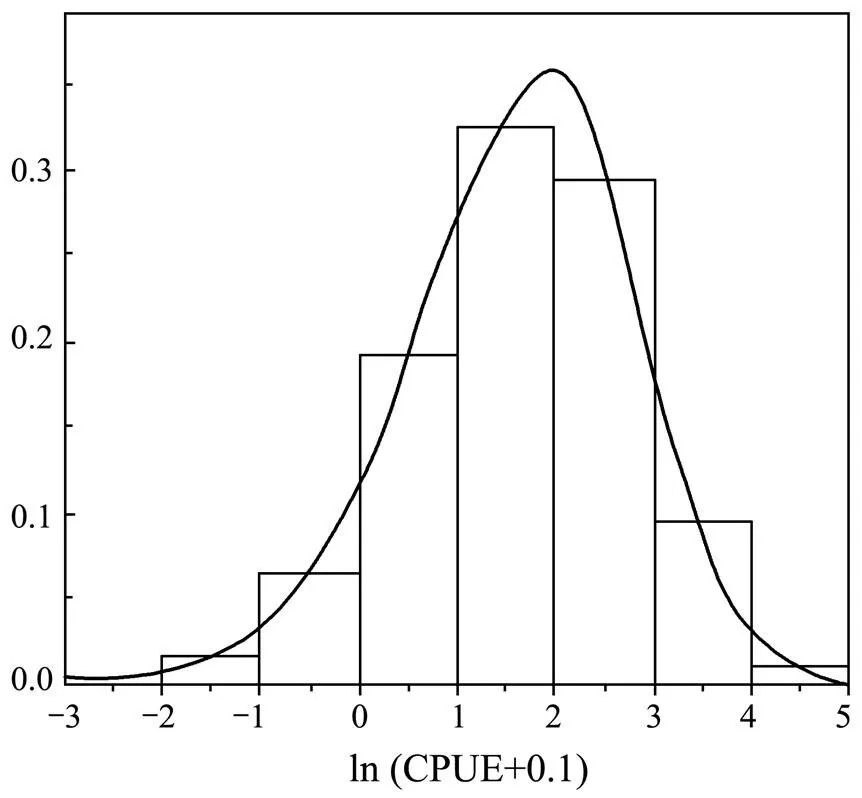
Fig.6 Frequency and fitted density curve of ln(CPUE+ 0.1).
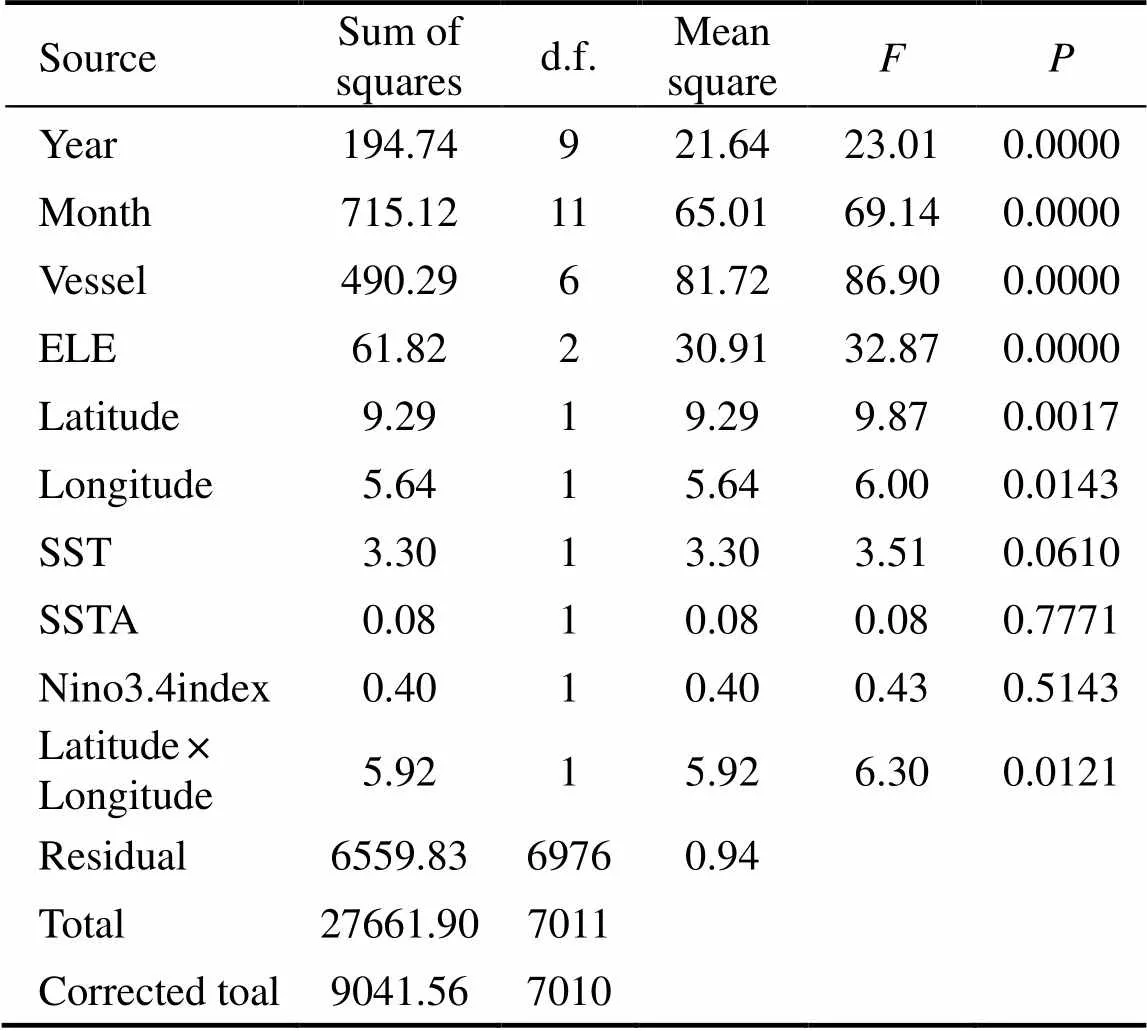
Table 2 Analysis of deviance of GLM fitted to the Chilean jack mackerel catch rate data of Chinese factory trawl fishing fleets in the Southeast Pacific Ocean during 2001–2010†
Note:GLM-dependent variable: ln(CPUE+0.1);=0.274 (adjusted=0.270).
The GLM model with five main effects explained 27.34% of the total deviance (Table 3). The variable with the highest contribution to the explained deviance was Month (16.58%), followed by Vessel (6.01%) and Year (3.33%). The explained deviance of ELE and latitude was less than 1%. Most of the explained deviance came from the temporal effects and Vessel. The GLM identified that the three categorical factors,, Year, Month and Vessel, were most influential, explaining 25.91% of the total variance in the Chilean jack mackerel CPUE. The GLM effects of predictor variables on function of ln(CPUE+ 0.1) are illustrated in Fig.7. Catch rate was increased monotonically from 45˚S to 25˚S. However, scatter plot showed an apparent non-linearity relationship between log-transformed CPUE and latitude (Fig.8).

Table 3 Stepwise GLM building for influencing factors of Chilean jack mackerel catch rate of Chinese factory trawl fishing fleets in the Southeast Pacific Ocean from 2001 to 2010
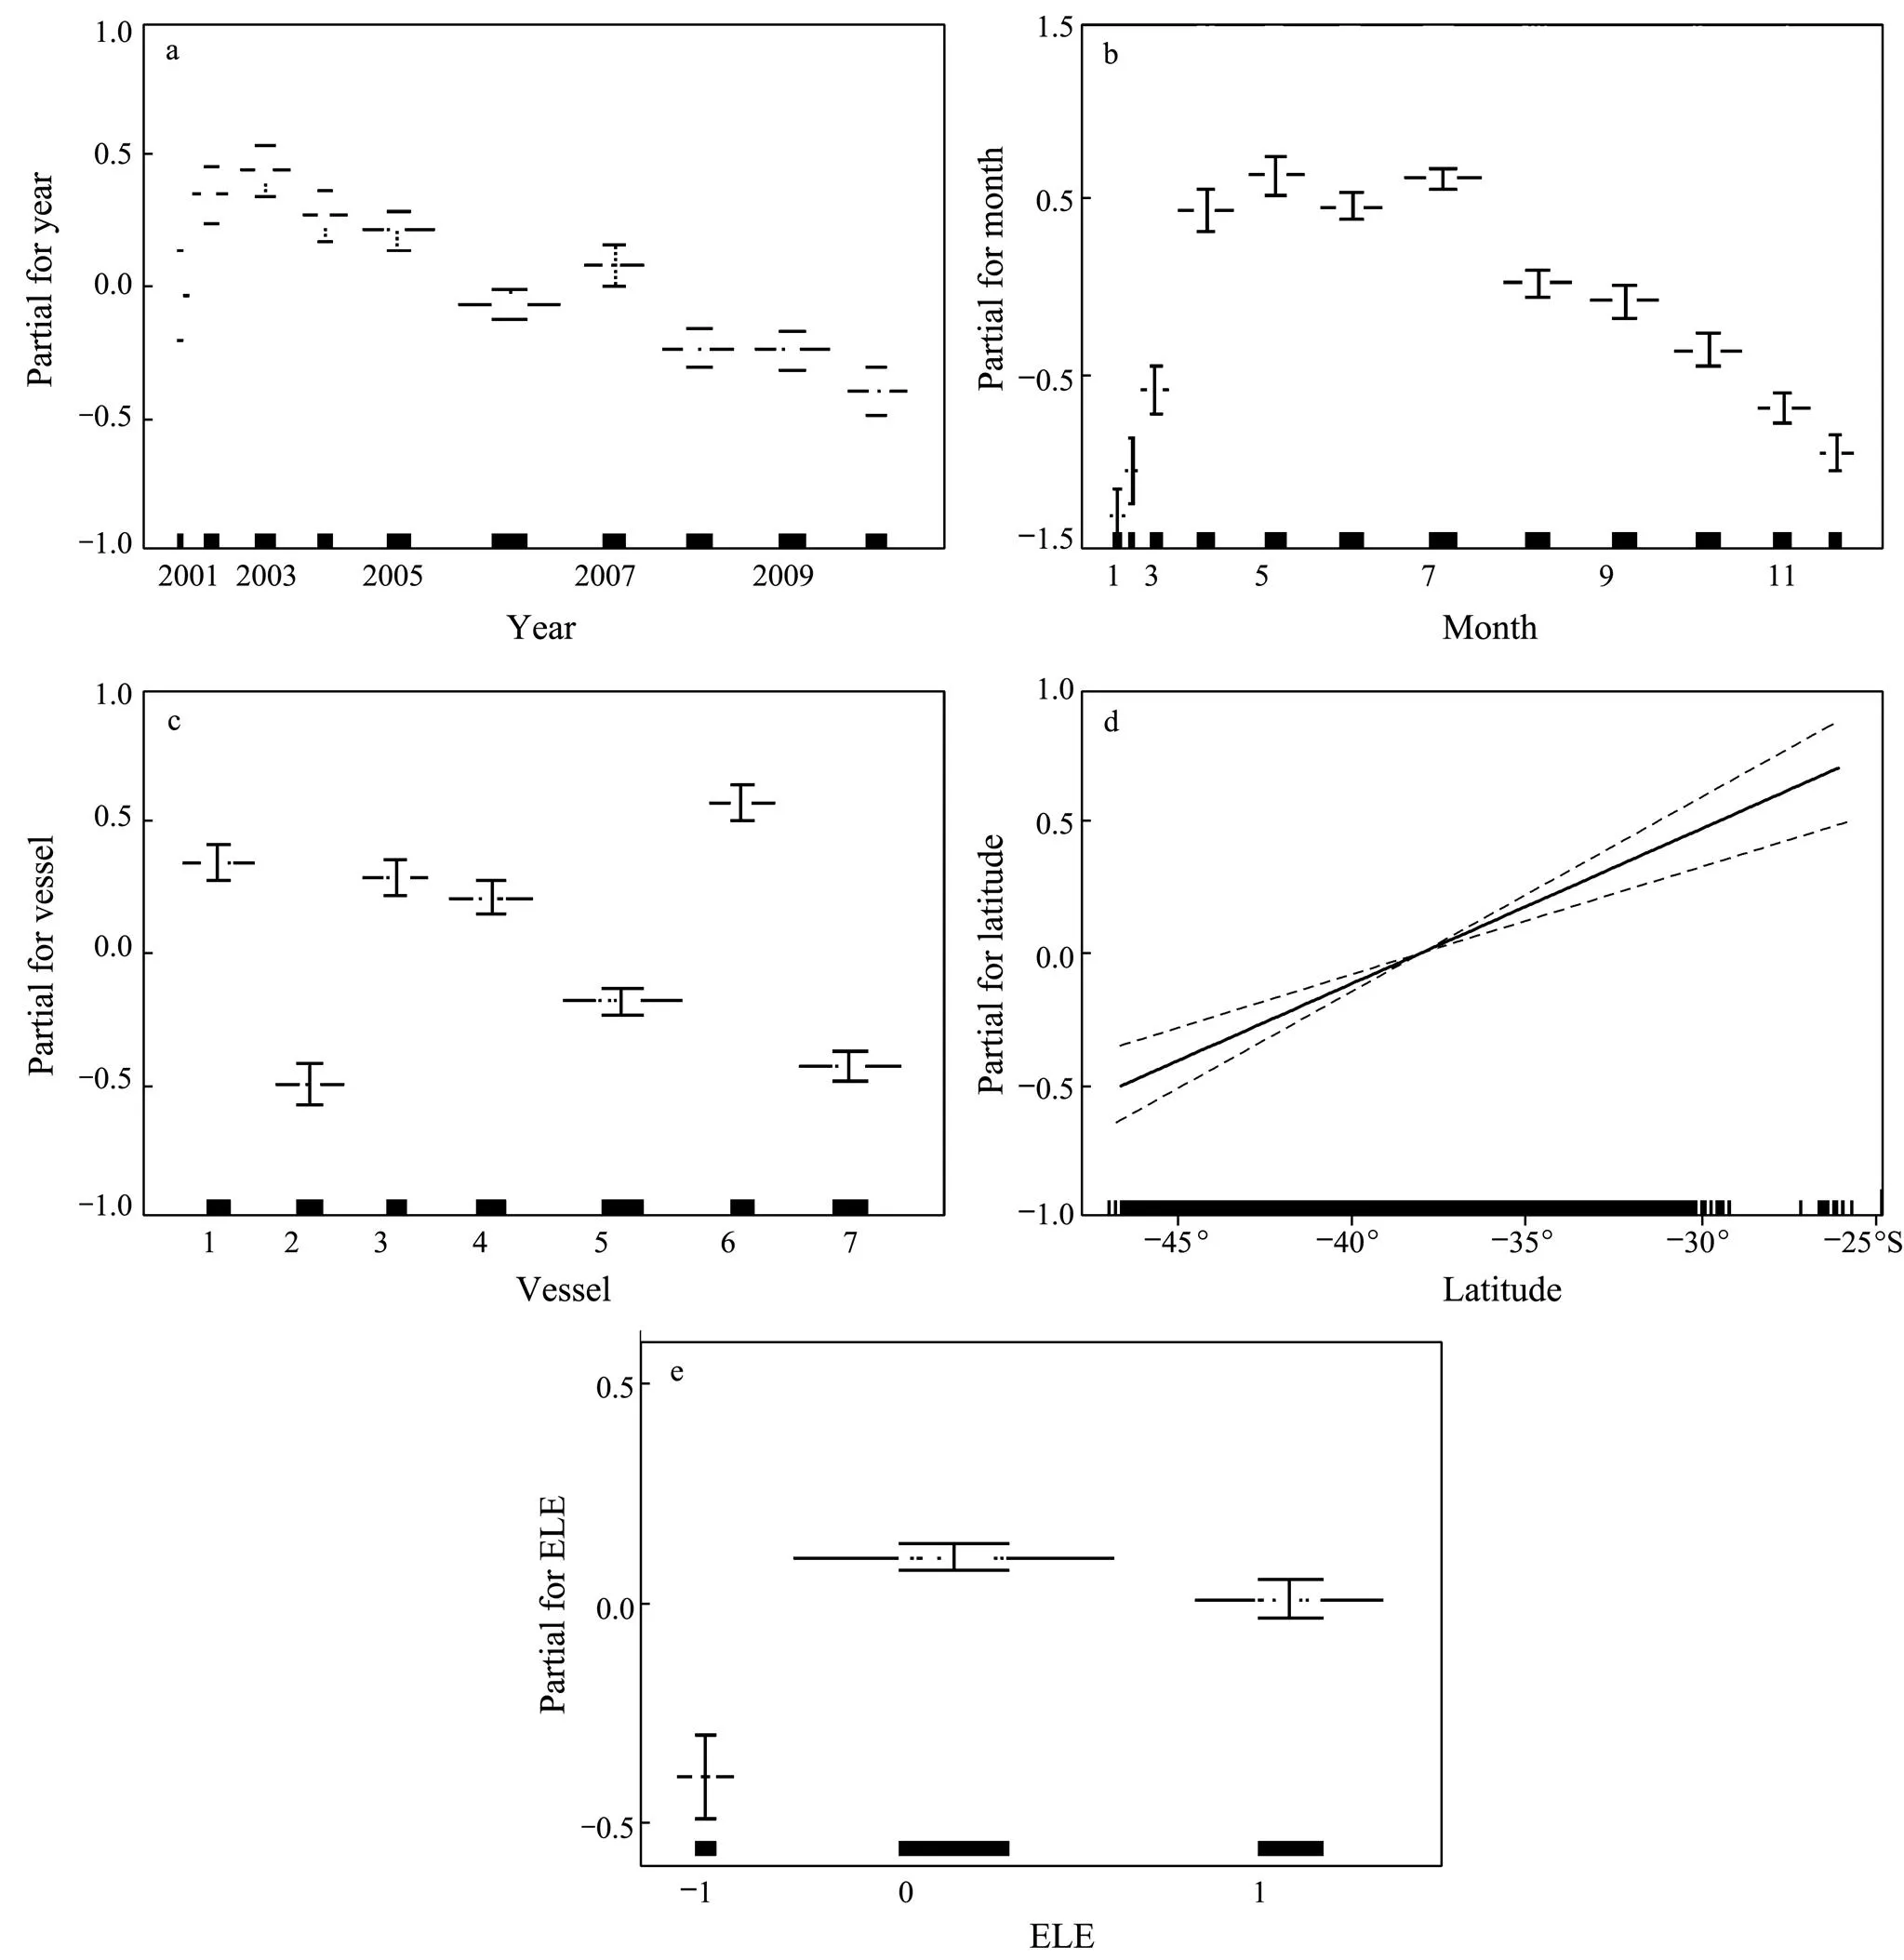
Fig.7 GLM effects of Year, Month, Vessel, ELE, and Latitude on the log-transformed catch-rate of Chilean jack mackerel of Chinese trawl fisheries in the Southeast Pacific Ocean (2001–2010).
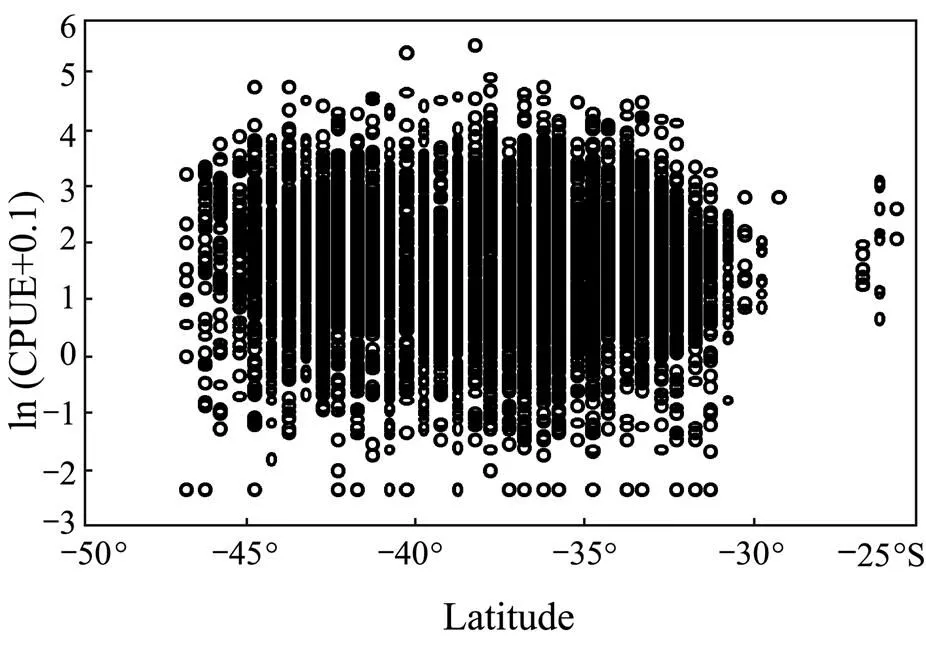
Fig.8 Scatterplot of the dependent variable (log-trans- formed CPUE) vs. Latitude for Chilean jack mackerel catch- rates in the Southeast Pacific Ocean (2001–2010).
3.3 Generalized Addictive Model
Stepwise GAM building using the AIC, pseudo-and adjusted pseudo-showed that except for the SSTA, all the explanatory variables were significant (<0.01) (Fig.9, Fig.10, and Table 4). With the explanatory variables added to the GAM model one by one, the residual deviance and AIC were significantly reduced, whereas the explained cumulative variance, pseudo-and adjusted pseudo-were increased consistently. Together these indicated that the final model with the 9 variables and the interaction term provided better fits to catch rate data.
The final GAM explained 30.78% of the variance in nominal CPUE (Table 4). The temporal factor Month was the most influential effect which explained 16.58% of the deviance in Chilean jack mackerel CPUE, followed by Vessel (6.01%), Year (3.33%) and Longitude (1.63%). The remaining effects only explained less than 1% of the total deviance.
The impact of Month on CPUE was the foremost factor, contributing to 53.9% of the total reduction in deviance. CPUE remained low in the first three months, and started increasing from April and peaked in July, followed by a monotonic decrease (Fig.9). The estimated Year effect showed a declining trend in CPUE from 2002 and 2010, except for a small increase in 2007. The CPUE declined to the lowest level in 2010. The estimated year effect in 2001 was biased due to the small sample size of catch rate data, which were retrieved from three trawlers operating brokenly during the second half-year of 2011 (Fig.9). Compared to the nominal CPUE, GLM- and GAM-stan- dardized CPUE showed obvious annual variations in the lower standardized indices. The GAM-estimated year effect on CPUE continuously declined in the annual abundance of Chilean jack mackerel on the high seas in 2000–2010 (Fig.11).
As the second most predominant influencing factor of CPUE, the fishing performance predictor Vessel explained 6.0% of the total deviance. The same type of trawler had similar impacts on Chilean jack mackerel catch rate (Table 1 and Fig.9). Vessels 1 and 6 were most successful in catching Chilean jack mackerel, followed by Vessels 3 and 4, and then 5. CPUE of Vessels 2 and 7 were the lowest, possibly due to the small engine power and hold capacity.
The GAM plot of Latitude showed a U-shaped curve. The lowest catch rate was found at 41˚S, from which CPUE values increased toward the north and south directions. Despite the increasing, high catch rate to the north of 31˚S, there was no clear longitudinal trend due to lack of data. The GAM plot of Longitude showed that the catch rate peaked at 96˚W and then decreased in easterly and westerly directions (Fig.9). Longitude and Latitude interaction effects showed that CPUE was higher in the two areas outside the Chilean EEZ, consistent with the spatial distribution of nominal CPUE (Fig.4). That is, the first area was distributed from south of central-south Chile (80˚W, 48˚S) to the westmost (120˚W, 34˚S) in a northwesterly direction, and the second area was located north of the first one (Fig.10).
The CPUE was related to SST with great fluctuations (Fig.9). Higher catch rate values were observed in colder water with temperatures from 12℃ to 15℃. Within this temperature range, 92.09% of the fishing effort and 85.65% of the total catch were deployed (Fig.12). The CPUE increased with the temperatures (18–22℃) and reached the highest values at 22℃. However, this trend remained uncertain due to large standard errors (Fig.9). The SSTA was the factor of minimum significance in GAM. The catch rate generally increased from the negative SSTA to positive SSTA with small fluctuations and larger values within the SSTA range of 0.2–1.0℃.

Table 4 Stepwise GAM building for influencing factors of the Chilean jack mackerel catch rate of Chinese factory trawl fishing fleets in the Southeast Pacific Ocean (2001–2010)
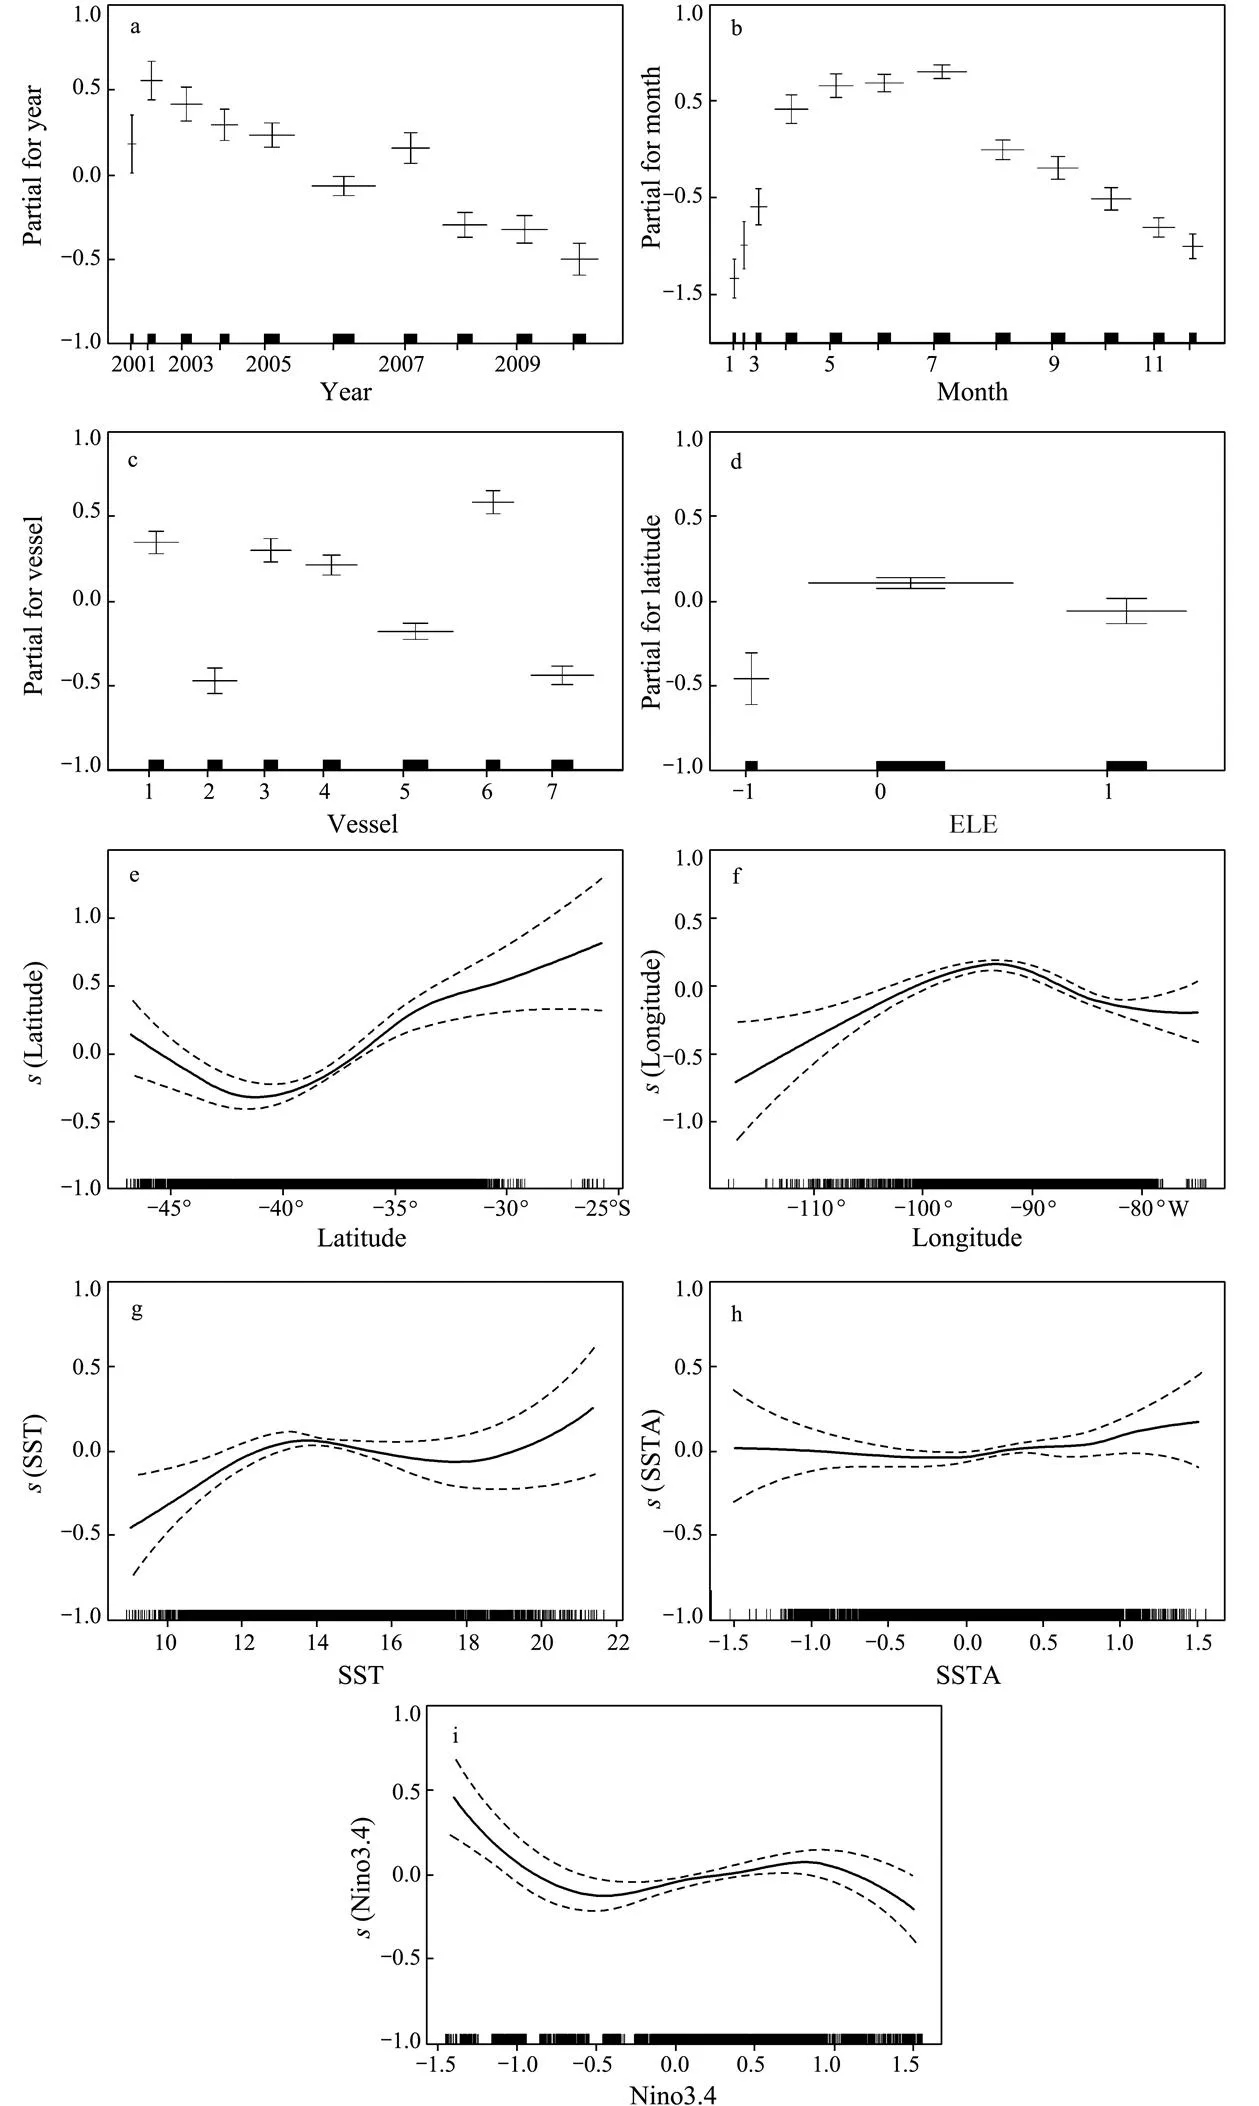
Fig.9 GAM-estimated impact of the main effects on log-transformed catch rate of Chilean jack mackerel of Chinese trawl fisheries in the Southeast Pacific Ocean (2001–2010).
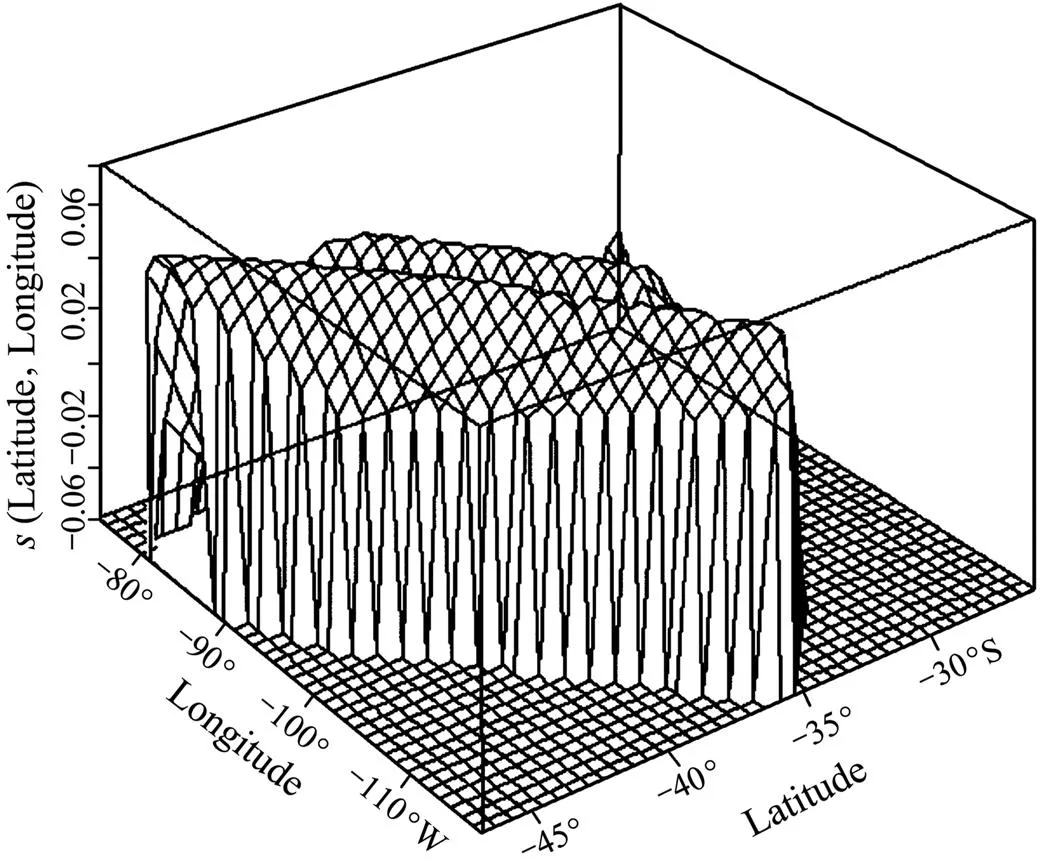
Fig.10 GAM-estimated effect of the interaction between Longitude and Latitude on the log-transformed catch rate of Chilean jack mackerel of Chinese factory trawl fishing fleets in the Southeast Pacific Ocean (2001–2010).
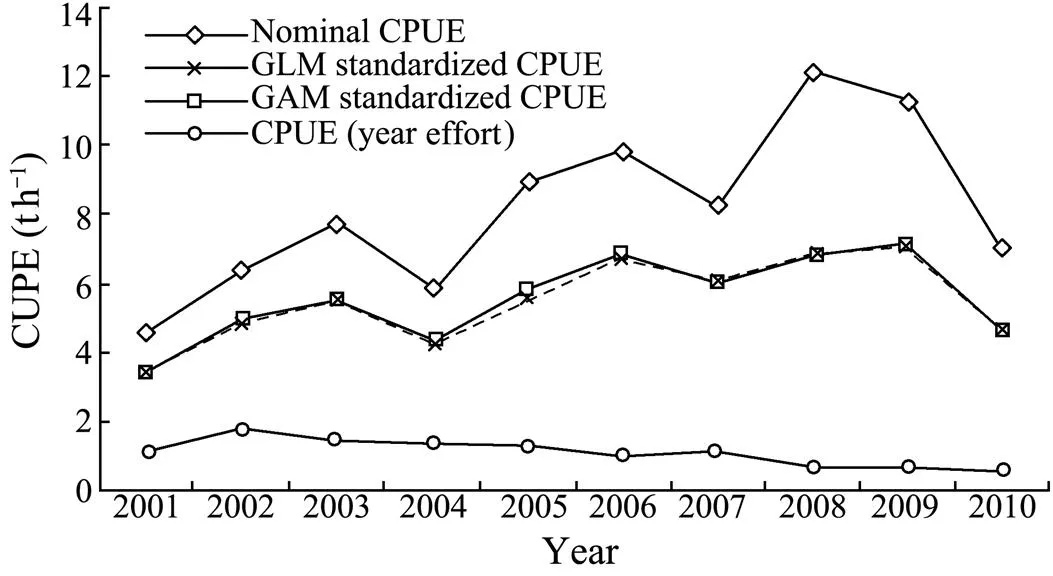
Fig.11 Nominal CPUE, GLM- and GAM-standardized CPUE, and year effects on CPUE estimated by GAM analysis.
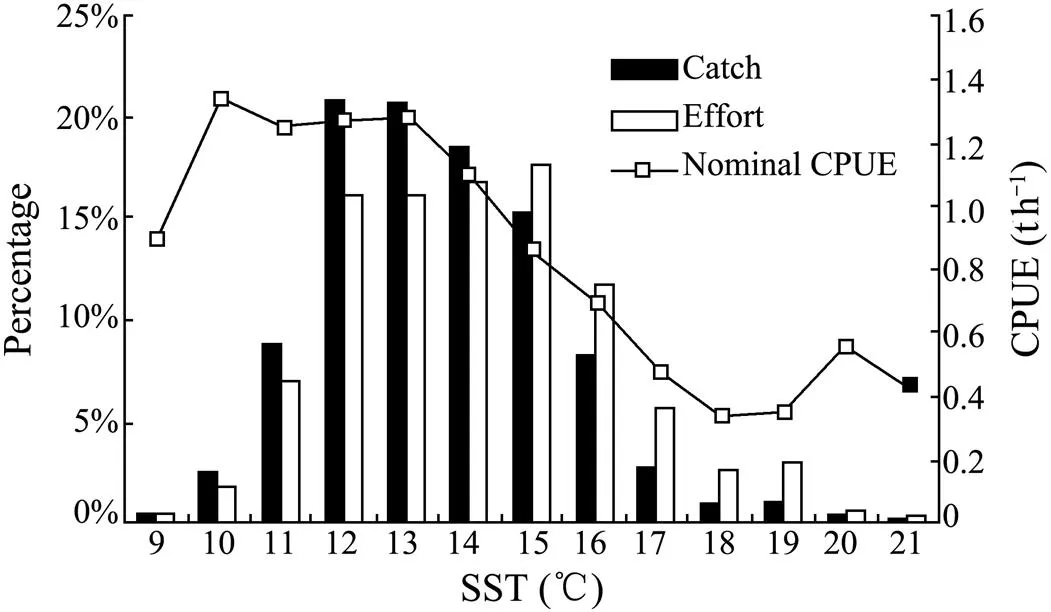
Fig.12 Nominal CPUE in relation to SST and the proportion of catch and effort at different SST intervals.
The GAM showed that ELEs also impacted the catch rate of Chilean jack mackerel (Fig.9). The abundance of Chilean jack mackerel was highest in normal years, but significantly lower in ELE-related years. The Nino3.4 index was another variable used for analyzing the ELE impact on catch rate. The catch rate that fluctuated with Nino3.4 index was divided into 3 ranges corresponding with La Niña (a, SSTA −1.5℃ to −0.5℃), normal (b, SSTA −0.5℃ to 0.5℃) and El Niño years (c, SSTA 0.5℃ to 1.5℃), respectively. The variation trend of catch rate was similar between the two variables in GAM, except for that of SSTA in the range a in La Niña yeas (Fig.9). This could be related to the large standard errors caused by lack of data points, or difference between the Nino3.4 index and definition of La Niña event (Nino3.4 index less than −0.5 for 3 months in a row at least).
Despite the identical trends, GLM- and GAM-stan- dardized CPUE were significantly lower than the nominal CPUE. The nominal and standardized CPUE indices fluctuated and there were three 4-year cycles (2001–2003, 2003–2006 and 2006–2010) from 2001 to 2010 with general increasing trends except for 2010 (Fig.11). However, the GAM-extracted year effect showed that the annual abundance of Chilean jack mackerel generally declined during 2001–2010 with a slight recovery in 2007 (Fig.11). In 2010, all the 4 indices reflected the same decreasing trend compared with those in 2009. Strong seasonal cycles in nominal CPUE were evident in the GLM- and GAM-standardized CPUE.
4 Discussion
To construct the relative abundance index for stock assessment, the CPUE is usually standardized by removing the impacts of influencing factors (Maunder and Punt, 2004). Previously, the GLM was most frequently used for CPUE standardization (Nishida and Chen, 2004; Maunder and Langley, 2004). Over the last decade, GAM has increasingly been used (Venables and Dichmont, 2004). It has been shown that the relationship between the catch rates and relevant factors is likely non-linear (Bigelow., 1999; Damalas., 2007). The GAMs are capable of dealing with non-linearity by incorporating terms non-parametrically (Chambers and Hastie, 1993). In this study, the GLM and GAM were used to examine how spatial, temporal, environmental and operational factors affected the Chilean jack mackerel catch rates, as well as to identify the nonlinear relationships between the response variable and explanatory variables. As indicated by the similar trends in GLM- and GAM-standardized CPUE (Fig.11), it is a robust choice between GLM and GAM which use different ways to deal with continuous variables (Su., 2008).
The intra-annual seasonality in CPUE was evident from the Month effect. The CPUE was lower at the beginning of the fishing season, with a peak in autumn or winter and continuous decreases after October (Fig.9). These indicated that the period April to July was the most favorable fishing season for Chilean jack mackerel off central-southern Chile. Monthly catches and CPUE (ton per day) of Chilean jack mackerel by European Union vessels showed similar seasonal trends (Corten and Janusz, 2010). The availability of fish resources in the coastal and oceanic fisheries could be related to the seasonal migration of fish population for spawning and feeding in adjacent areas (Serra, 1991). Chilean jack mackerel migrates from coastal waters for spawning in oceanic waters in spring, and returns to coastal areas for feeding in summer and autumn (Serra, 1991; Miranda., 1998). This can be reflected by the distribution of eggs and larvae, hydro-acoustic surveys, seasonal variations in landings, and in deeper seas by seasonal changes in the CPUE of midwater trawlers (Taylor, 2002). Chilean jack mackerel aggregates in schools in autumn and winter and is caught easily by Chilean fishing fleet, particularly in the central-southern area (Arancibia,., 1995a; Arancibia,., 1995b). Jack mackerel catches off the south- central Chilean coast showed a continuous distribution from the coast out to the high seas. In general, Chinese fleets, as well as EU fleets (Corten and Janusz, 2010), operate in the southern of 40˚S just outside the Chilean EEZ from March to May, and then move away from the continent in a northwesterly direction, finally catching in the westernmost (120˚W) or northernmost (30˚S) edge off the center-south fishing area.
Vessel code was the second significant explanatory variable that influenced CPUE (Table 1). This reflected that the observed differences in catch rates among fleets (Fig.9) were mainly caused by different vessel engine powers and hold capacities. Variations in fishing power of the fleet may change the catch rate (Hilborn and Walters, 1992; Salthaug and Godo, 2001). A previous study (Huang and Lin, 2005) indicated that the catch efficiency of Chilean jack mackerel by Chinese trawl fleets generally increased with the trawl speed. That is, the higher engine power ensures higher operational speed and bigger area swept, which reduces the escape rates and increases the numbers of fish caught by the trawl net. Thus, the highest CPUE of Vessels 1 and 6 (Fig.9) could be attributed to the highest engine power. The fluctuating CPUE of the same type vessel,, Vessels 1 and 6, or 2 and 7, could be related to the experience and skills of the crew and skipper, which are hard to quantify.
Except for temporal and spatial factors, the environmental and oceanographic variables were included in GAM analyses (Fig.9), in despite of their small contribution to the total deviance reduction. Water temperature is expected to have an impact on the habitat, distribution and productivity of many pelagic species, such as sardine (Yatsu., 2005) and big eye tuna (Howell and Kobayashi, 2006). The range of SST of Chilean jack mackerel fishing habitat off central-southern Chile is from 10℃ to 19℃ isotherm (Elías., 2009). The GAM plot of CPUE and catch histogram in response to SST detected the temperature interval of 9–21℃, and Chilean jack mackerel were more frequently caught when SST ranged from 12℃ to 15℃ (Figs.9 and 12). This result was slightly different from the finding by Sepúlveda. (2009), which demonstrated that major acoustic Chilean jack mackerel biomass in 2007 was associated with a narrower SST range (10℃ to 13℃, averaging 11.5℃±1.4℃). Elías. (2009) argued that the major fishing habitat of Chilean jack mackerel is characterized by some important environmental gradients, such as SST, sea surface salinity (SSS) and mixed layer depth (MLD). Our GAM analysis showed that CPUE of Chilean jack mackerel was higher in normal years than that in El Niño or La Niña years, possibly due to the changes in oceanographic conditions, community structure and biological production of the Humboldt Current System (Escnbano., 2004). The inter-annual variability of Chilean jack mackerel habitat was mainly associated with ELE (Elías., 2009). Arcos. (2001) analyzed the impact of the 1997–1998 El Niño on the population of jack mackerel off central-southern Chile, and found that oceanographic conditions altered by El Niño led to changes in migration routes and the size distribution of jack mackerel, further affecting their availability for commercial fishing. El Niño has not only contemporaneous negative effects on Chilean jack mackerel biomass in central-southern Chile, but also long-lasting negative biomass effects for at least two additional years (Torres-Peña., 2005).
The GAM-standardized CPUE might be insufficient for identifying trends in annual catches because of the relatively short time series of catch rate data, but the year effect of Chilean jack mackerel CPUE generally declined continuously (Figs.9 and 11) with the annual catches (Fig.1) during 2001–2010. This reflected the status of Chilean jack mackerel stock in the last ten years to some extent. However, the standardized indices in 2001 wererelatively lower than that in 2002 and 2003, possibly due to lack of experiences and data for fishers. This trend was slightly different from that in nominal CPUE of EU (SPRFMO, 2011), which increased from 2003 to 2006, followed by steady decreases during 2007–2011. The predicted abundance index by SPRFMO (2011) indicated that Chilean jack mackerel abundance decreased sharply from the late 1980s to late1990s, recovered slightly during 2000–2004, and then declined to the lowest level in the past seven years. The fluctuations in Chilean jack mackerel catches and abundance are not only associated with the impacts of commercial fishery but also affected by the climatic changes. Klyashtorin (2001) analyzed the correlation between several well-known climate indices and fluctuations in 12 major commercial fish stocks, and developed a predictive model to forecast the main commercial fish yield. The results showed that the Chilean jack mackerel catches (1969–1997) were closely correlated with the zonal Atmospheric Circulation Index curve (correlation coefficient 0.85), which predicted that the catches had decreased since 2000, and would drop to the minimum level in 2015, followed by a gradual increase to the maximum in mid-2040s. The natural change in Chilean jack mackerel population is influenced by the exorbitant fishing mortality. The estimated fishing mortality likely exceeded sustainable levels in the 1990s. It increased rapidly from 0.22 in 1993 and to 0.94 in 1997, the highest level in the history of the fishery, and then declined to the level of 1994 in 2005, followed by increases to 0.8 in 2010 (SPRFMO, 2010). Correspondingly, the Chilean jack mackerel catches increased steadily from 1970, peaked at 4.74 million tons in 1995, and then rapidly declined to 1.37 million tons in 1999. Over the period 2000–2006 there was a slow increase in total catches to 2.02 million tons, but the catches declined steadily from 2007. In 2010, the annual catch was only 0.75 million tons, the lowest catch in record since 1976 (Fig.1). Assessment results indicated that the estimated total biomass decreased to 2.1 million tons in 2010, the lowest level over the history of this fishery, and the estimated average recruitment over 2005–2009 was only 30% of the long-term average recruitment (SPRFMO, 2010). The declining catches, total biomass, recruitment and abundance indices indicate that Chilean jack mackerel stock has been overfished.
In summary, GLM and GAM were used to standardize CPUE for Chinese fleets for accurate assessment of the effects of season, vessel, latitude and a range of environmental variables. The standardized year effects could be used as one of the sources of relative abundance indices for stock assessment. However, care needs to be taken when using these indices for stock assessment due to the neglect of several potentially important factors. Although the SST, SSTA and El Niño effects have been included in the GAM analysis, these variables are likely to be highly correlated and other environmental variables such as chlorophyll, SSS, and MLD may need to be considered for further analysis of the catch rate, thus contributing to evaluation of the changes in catchability. Moreover, this CPUE standardization work has neglected gear types used by different vessels and relevant changes, which need to be incorporated in future study.
Acknowledgements
The authors would like to thank the anonymous reviewers for their making valuable comments resulting in significant improvements of the manuscript. This study was co-funded by the National High Technology Research and Development program of China (No.2012AA092301), the Agriculture Science Technology Achievement Transformation Fund (No.2010C00001) and the Project of Fishery Exploration in High Seas of the Ministry of Agriculture of China (2010–2011).
Arancibia, H., Alarcón, R., Cubillos, L., and Arcos, D., 1995a. A landing forecast for horse mackerel,(Nichols, 1920) off central Chile.,59: 113-117.
Arancibia, H., Cubillos, L., Arcos, D., Grechina, A., and Vilugrón, L., 1995b. The fishery of horse mackerel () in the South Pacific Ocean, with notes on the fishery off central-southern Chile.,59 (3-4): 589-596.
Arcos, D. F., Cubillos, L. A., and Nuñez, S. P., 2001. The jack mackerel fishery and El Niño 1997–98 effects of Chile., 49: 597-617.
Bigelow, K. A., Boggs, C. H., and He, X., 1999. Environmental effects on swordfish and blue shark catch rates in the US North Pacific longline fishery., 8: 178-198.
Bigelow, K. A., Hampton, J., and Miyabe, N., 2002. Application of a habitat-based model to estimate effectivelongline fishing effort and relative abundance of Pacific bigeye tuna ()., 11: 143-155.
Bishop, J., Die, D., and Wang Y. G., 2000. A generalized estimating equations approach for analysis of fishing power in the Australian Northern Prawn Fishery., 42: 159-177.
Campbell, R., 2004. CPUE standardization and the construction of indices of stock abundance in a spatially varying fishery using general linear models., 70: 209-227.
Chambers, J. M., and Hastie, T. J., 1993.. Chapman and Hall, London, 608pp.
Corten, A., and Janusz, J., 2010.2010. Ninth Science Working Group of SPRFMO, 21–29 October 2010, Viña del Mar, Chile.
Cubillos, L. A., Paramo, J., Ruiz, P., Núñez, S., and Sepúlveda, A., 2008.The spatial structure of the oceanic spawning of jack mackerel () off central Chile (1998–2001).,90: 261-270.
Damalas, D., Megalofonou, P., and Apostolopoulou, M., 2007. Environmental, spatial, temporal and operational effects on swordfish () catch rates of eastern Mediterranean Sea longline fisheries., 84: 233-246.
Elizarov, A. A., Grechina, A. S., Kotenev, B. N., and Kuzetsov, A. N., 1993. Peruvian jack mackerel,, in the open waters of the South Pacific., 33: 86-104.
Elías, S. N., Ramírez, M. C., and Pastene, S. V., 2009.. Eighth Science Working Group of SPRFMO, 2–6 November 2009, Auckland, New Zealand.
Escribano, R., Daneri, G., Farías, L., Gallardo, V. A., González, H. E., Gutierrez, D., Lange, C., Morales, C. E., Pizarro, O., Ulloa, O., and Braun, M., 2004. Biological and chemical consequences of the 1997–1998 El Niño in the Chilean coastal upwelling system: a synthesis., 51: 2389-2411.
Evseenko, S. A., 1987. Reproduction of the Peruvian jack mackerel,(Nichols) in the South Pacific Ocean., 27: 151-160.
Hastie, T., Tibshirani, R., and Friedman, J., 2001.,,. Springer-Verlag, New York, 533pp.
Hilborn, R., and Walters, C. J., 2001.,. Kluwer Academic Publishers, Boston, 570pp.
Howell, E. A., and Kobayashi, D. R., 2006. El Niño effects in the Palmyra Atoll region: oceanographic changes and bigeye tuna () catch rate variability., 15: 477-489.
Huang, H. L., and Lin, L. S., 2005. Min-water trawl techniques for fishing Chilean jack mackerel in the southeastern Pacific Ocean., 12: 99-103 (in Chinese with English abstract).
Guisan, A., Edwards Jr., T. C., and Hastie, T., 2002. Generalized linear and generalized additive models in studies of species distributions: setting the scene., 157: 89-100.
Klyashtorin, L. B., 2001. Climate change and long-term flu- ctuations of commercial catches: the possibility of forecasting., No. 410. Rome, FAO, 86pp.
Maunder, M. N., and Langley, A. D., 2004. Integrating the standardization of catch-per-unit-of-effort into stock assessment models: testing a population dynamics model and using multiple data types., 70: 389-395.
Maunder, M. N., and Punt, A. E., 2004. Standardizing catch and effort data: a review of recent approaches., 70: 141-159.
Maynou, F., Demestre, M., and Sánchez, P., 2003. Analysis of catch per unit effort by multivariate analysis and generalised linear models for deep-water crustacean fisheries off Barcelona (NW Mediterranean)., 65: 257-269.
Miranda, L., Hernández, A., Sepúlveda, A., and Landaeta, M., 1998. Alimentación de jurel y análisis de la selectividad en la zona centro–sur de Chile. In:. Arcos, D., ed., Instituto de Investigaciones Pesqueras S. A, Talcahuano, Chile, 173-187.
McCullough, P., and Nelder, J. A., 1989.. 2nd edition. Chapman and Hall, New York, 532pp.
Nelder, J. A., and Wedderburn, R. W. M., 1972. Generalised linear models., 137: 370-384.
Nishida, T., and Chen, D. G., 2004. Incorporating spatial autocorrelation into the general linear model with an application to the yellowfin tuna () longline CPUE data.,70: 265-274.
Salthaug, A., and Godo, O. R., 2001. Standardisation of commercial CPUE., 49: 271-281.
Sepúlveda, A., Alarcón, R., Núñez, S., Aguayo, M., Escobar, P., Vargas, R., Correa, M., and González, C., 2009. Evaluación directa del jurel con naves de la flota. Pre-Informe Final Proyecto FIP 2007-24.
Serra, J. R., 1991. Important life history aspects of the Chilean jack mackerel,., 36: 67-83.
SPRFMO, 2009.. Eighth Science Working Group of SPRFMO, 2–6 November 2009, Auckland, New Zealand.
SPRFMO, 2010.. Ninth Science Working Group of SPRFMO, 21–29 October 2010, Viña del Mar , Chile.
SPRFMO, 2011.. Tenth Science Working Group of SPRFMO, 19–23 September 2011, Port Vila, Vanuatu.
Su, N. J., Yeh, S. Z., Sun, C. L., Pount, A. E., Chen, Y., and Wang, S. P., 2008. Standardizing catch and effort data of the Taiwanese distant-water longline fishery in the western and central Pacific Ocean for bigeye tuna,., 90: 235-246.
Taylor, P. R., 2002. Stock structure and population biology of the Peruvian jack mackerel,. New Zealand Fisheries Assessment Report 2002/21.
Trenberth, K. E., 1997. The definition of El Niño., 78:2771-2777.
Torres-Peña, J., Agostini, C., and Vergar, S., 2005. El Niño effects and biomass endogeneity in a harvest function. In:. Ilades-Georgetown University, Universidad Alberto Hurtado/School of Economics and Bussines. http://EconPapers.repec.org/RePEc:ila:ilades:inv160.
Venables, W. N., and Dichmont, C. M., 2004. GLMs, GAMs and GLMMs: an overview of theory for applications in fisheries research., 79: 319-337.
Yatsu, A., Watanabe, T., Ishida, M., Sugisaki, H., and Jacobson, L. D., 2005. Environmental effects on recruitment and productivity of Japanese sardineand chub mackerelwith recommendations for management., 14: 263-278.
(Edited by Qiu Yantao)
10.1007/s11802-013-1987-1
ISSN 1672-5182, 2013 12(3): 441-451
. Tel: 0086-21-61900312 E-mail: xrzou@shou.edu.cn
(March 23, 2012; revised May 11, 2012; accepted September 6, 2012)
© Ocean University of China, Science Press and Spring-Verlag Berlin Heidelberg 2013
 Journal of Ocean University of China2013年3期
- Journal of Ocean University of China的其它文章
- Evaluation of Antitumor, Immunomodulatory and Free Radical Scavenging Effects of A New Herbal Prescription Seaweed Complex Preparation
- Effects of Exposure to Four Endocrine Disrupting-Chemicals on Fertilization and Embryonic Development of Barbel Chub (Squaliobarbus curriculus)
- A Preliminary Phylogenetic Analysis of Luidia (Paxillosida:Luidiidae) from Chinese Waters with Cytochrome Oxidase Subunit I (COI) Sequences
- Seasonal Community Structure of Mesozooplankton in the Daya Bay, South China Sea
- The Effect of Three Culture Methods on Intensive Culture System of Pacific White Shrimp (Litopenaeus vannamei)
- Effects of Dietary Corn Gluten Meal on Growth Performance and Protein Metabolism in Relation to IGF-I and TOR Gene Expression of Juvenile Cobia (Rachycentron canadum)
