The Effect of Three Culture Methods on Intensive Culture System of Pacific White Shrimp (Litopenaeus vannamei)
MA Zhen1), WAN Rong1), SONG Xiefa1), *, and GAO Lei2)
The Effect of Three Culture Methods on Intensive Culture System of Pacific White Shrimp ()
MA Zhen, WAN Rong, SONG Xiefa, and GAO Lei
1),266003,2),,116023,
Different culture methods may affect the intensive culture system of Pacific white shrimp () regarding water quality and growth and economic performance. This study evaluated the potential effects of three culture methods through cultivation of juvenile shrimps under consistent tank management conditions for 84d. The three methods involved shrimp cultivation in different tanks,., outdoor tanks with cement bottom (mode-C), greenhouse tanks with cement bottom (mode-G) and outdoor tanks with mud-substrate (mode-M). Results showed that water temperature was significantly higher in mode-G than that in mode-C (<0.05). In contrast to the other two treatments, mode-M had stable pH after 50d cultivation of shrimps. In the mid-late period, the average concentrations of TAN, NO-N, DIP and COD were significantly lower in mode-M and mode-G compared with those in mode-C (<0.05). Despite lack of differences in the final shrimp weight among different treatments (>0.05), mode-M had significantly higher shrimp yield, survival rate and feedconversion rate (<0.05) than other modes. There were significant differences in revenue and net return among different treatments (<0.05). These demonstrated that the treatments of mode-G and mode-M were conductive to the intensive culture system of
culture method; water quality; growth performance; economic performance;
1 Introduction
is one of the most important commercial species in shrimp farming industry. The global production ofis approximately 2328000 tons, corresponding to a profit of 9218 million dollars (Silva., 2010; Qiu., 2011; FAO, 2011). In recent years, the intensification of traditional aquaculture has promoted waste production and disease outbreak, leading to massive financial losses (Jiang., 2000; Neill, 2005; Krummenauer., 2010; Ruiz-Velazco., 2010). Therefore, it is necessary to investigate and develop sustainable culture practices and facilities for minimizing the risks. In addition, due to great degradation of culture environment and water quality caused by aquaculture-related wastewater drainage, the key countermeasures which have been proposed for aquaculture development include reducing the impacts of effluent discharge, improving water quality and promoting responsible use of water resources. It is recommended that intensive culture systems and facilities should be widely used to decrease the excessive nutrients.
Previously, several successful intensive culture methods have been reported (Thakur and Lin, 2003; Ballester., 2007; Krummenauer., 2010),., higher-place pond, enclosed culture system, hypersaline water-fresh- water mode, greenhouse pond and freshwater pool. It is known that greenhouse equipment or substrate plays a key role in aquaculture production. For example, tank covered with greenhouse has been found with higher shrimp survival and growth rate than that without greenhouse (Neal., 2010; Huang., 2010). Different types of substrates have various effects on the growth rate ofand(Zang., 2003; Varadaraju., 2011). Yang. (2008) reported that tanks supplied with various substrates yielded different amounts of. In addition, Jha (2011) reported that the suitable bottom of tanks is of importance for the improvement of water quality and shrimp health.
At present, the effects of different culture methods on the intensive culture system ofremain largely unknown. It is crucial to understand these effects in order to enhance farming technology and improve culture environment for shrimps. In attempt to optimize different culture methods forproduction, this study used economic analysis to assess the variations in water quality, shrimp growth performance and generate information of the intensive culture system ofwith different facilities.
2 Materials and Methods
2.1 Source and Rearing Conditions
The experiment was conducted at Lvyuan Aquatic Cultivation Co., Ltd. in Zhoushan (Zhejiang, China) from April 1 to June 23, 2008, for a total of 84d. Thepostlarvae were obtained from a commercial hatchery (Great Breeding Co., Ltd. Zhanjiang, Guangdong, China) and nursed for 7d in 9 culture tanks with a feeding rate of 5% of the shrimp body mass.
The 9 tanks had an effective bottom area of 250min total and water depth of 1.5m. All tanks were equipped with a screened standpipe at the inlet, 20-cm in diameter, and a concrete catch basin at the outlet. Water (10%) was exchanged daily from day 30. Two weeks before stocking, the tanks were filled with filtered seawater (salinity 28– 30) from East Sea, China. To maintain a stable level of dissolved oxygen (DO) (≥5mgL), the tanks were equipped with paddlewheels and propeller aspirators (7.5kWha).
2.2 Experimental Design
Three culture methods were used to simulating differ-ent environmental conditions,., outdoor tank with cement bottom (mode-C), tank with cement bottom in greenhouse (mode-G) and outdoor tank with mud-sub- strate (mode-M). Each treatment was conducted in three random tanks, and all facilities and technologies for the three treatments were similar.
After 7 d acclimatization, juvenile shrimp (0.01g mean weight) ofwere transferred to culture tanks with a circulation rate of 300PLsm(=45000 per tank). The shrimps were fed commercial shrimp feed pellets (Qiandaoqiao Aquatech Co., Ltd., China) for 84d.
2.3 Sample Collection and Analysis
The level of DO (mg L), temperature (T, ℃), and pH of tank water were monitored daily at 6:00 am and 18:00 pm with a YSI 6920 meter (Yellow Springs, OH, USA). For determination of total ammonia nitrogen (TAN), nitrite-nitrogen (NO-N), dissolves inorganic phosphorus (DIP) and chemical oxygen demand (COD), water samples were collected weekly from a depth of 50cm below the surface using a horizontal water sampler at four random locations each tank (Table 1). The four samples were pooled into one glass bottle and transported to laboratory within 2h. Details of analytical procedures are available in the National Specification for Marine Monitoring (SEPA, 2002).

Table 1 Analytical methods of water quality parameters
Feed inputs were stopped one day ahead of harvesting, and shrimps were harvested after the tanks were drained. A total of 150 shrimps were randomly collected each tank for growth assessment. In addition, shrimp growth performance indicators including mean final weight, yield, daily weight gain (DWG), survival and feed conversion rate (FCR) were determined at the end of experiment. The shrimps were weighed individually and DWG was calculated by dividing the total weight gain of shrimp by the number of culture days. Survival rate was calculated as the percentage of the remaining number of shrimps divided by the initial number. FCR was calculated as the ratio of total feed consumption divided by total weight gain of shrimps.
Economic returns analysis was conducted on harvested shrimps based on the prevailing farm-gate prices in harvest and cost items in Chinese market (Table 2). Total revenues were calculated by multiplying the number of harvested shrimp by sale price (USD kg)Variable costs were summarized in Table 2, which included expenses on shrimp, diet and energy supply. Labor costs were estimated based on the earnings of employees. The working capital costs were calculated based on an annual interest rate of 8%. The profitability of different methods was compared in terms of total variable cost gross revenue (from selling shrimp) and net return (the difference between gross revenue and total variable cost) (Krummenauer., 2010; Yuan., 2010).
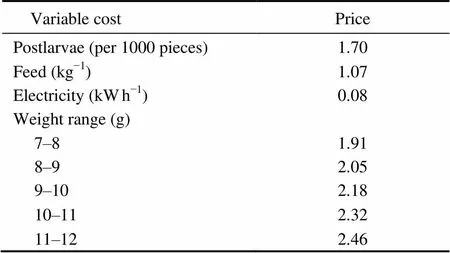
Table 2 Variable costs (USD) and shrimp price in Chinese market (USD kg−1) (June 2008)
2.4 Statistical Analysis
The relationships between culture time and environmental conditions (Temperature, pH, TAN, NO-N, DIP and COD) were estimated using curve estimation. The experimental data of shrimp growth performance and economic returns are presented as mean ± standard deviation (S.D.) of three replicates. Data comparison was performed using one-way ANOVA with SPSS 11.0. The possible differences among data were tested by Tukey’s test.<0.05 was considered as the level of statistical significance.
3 Results
3.1 Water Quality
During 84d culture period, DO level of tank water remained higher than 5mgL(5.7 to 9.63mgL). Water temperature showed an increasing trend in all the three treatments. The greenhouse maintained a significantly higher water temperature with an average of 26.4℃ than the outside (20.4 and 20.2℃, respectively) (Fig.1A). Wa-ter pH ranged from 7.12 to 7.88, which was similar between mode-C and mode-G (Fig.1B). However, water pH in mode-M became significantly higher than that in mode-C from day 50 (Fig.1B).
Water quality indicators were generally improved during the culture period. In early 15d, TAN was at similar levels (<0.1mgL) among the three treatments (Fig.1C). Day 15 later, TAN level showed a substantial increase in mode-C and mode-G, whereas that in mode-M (<0.25mg L) was significantly lower than that in mode-C from day 15 (<0.05). TAN level showed significant differences between mode-C and mode-G from day 64 (Fig.1C), and eventually reached 0.51 and 0.40mgLat the end of the experiment, respectively.
The average NO-N level was <0.01mgLd (Fig.1D). Thereafter, the NO-N level rapidly increased in mode-C and mode-G, and reached 0.34 and 0.26mgLat the end of the experiment, respectively. There was a significant difference in NO-N level between mode-C and mode-G from day 36 (Fig.1D). As for mode-M, the NO-N level was <0.13mgLfrom 29d, significantly lower than that in mode-C (<0.05).
At the end of the experiment, DIP level of mode-C and mode-G substantially increased to 1.94 and 1.30mgL, respectively. A significantly lower DIP level was observed in mode-M (0.82mgL). The average DIP level showed a significant difference between mode-C and mode-G (<0.05), and between mode-C and mode-M (<0.05) (Fig.1E). Similarly, the average COD level increased in all treatments at the early stage of culture, then decreased and fluctuated at the later culturing stage. The average COD level showed a significant difference between mode-C and mode-G during the majority of culture period, whereas that in mode-M remained significantly lower than that in mode-C in mid-late period (<0.05) (Fig.1F).
3.2 Growth Performance
The parameters of shrimp growth performance in cement treatments (mode-C and mode-G) are summarized in Table 3. No statistical differences (>0.05) were detected between mode-C and mode-G in final weight, yield and FCR. During culture, DWG in mode-G was 0.131g shrimpd, significantly higher than that in mode-C (<0.05). In addition, the shrimp survival in mode-G was 58.5%, significantly higher than that in mode-C (<0.05).
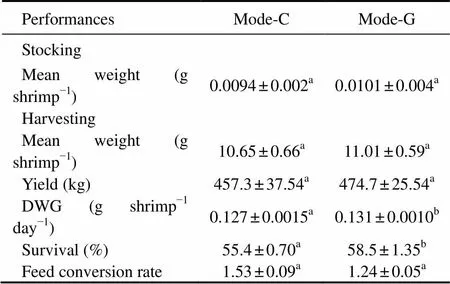
Table 3 Growth parameters of L. vannamei in cement treatments (mode-C and mode-G)
Notes: Values are presented as means ± S.D. Different superscript letters in the same row indicate significant differences (ANOVA test,<0.05). Mode-C denotes the outdoor tanks with cement bottom; and mode-G denotes the tanks with cement bottom in greenhouse. DWG denotes daily weight gain; and FCR denotes feed conversion rate.
The parameters of shrimp growth performance in outdoor treatments (mode-C and mode-M) are summarized in Table 4. Regarding the final mean weight, there were no significant differences between the two treatments (>0.05). The shrimp yield in mode-M was 537.0kg, significantly higher than that in mode-C (<0.05). During the culture period, DWG in mode-C was 0.127g shrimpday, significantly lower than that in mode-M (<0.05). In addition, the highest shrimp survival was observed in mode-M (62.4%), which was significantly higher than that in mode-C (<0.05). In comparison with non-sub- strate treatments, the tanks with mud-substrate (mode-M) had significantly lower FCR (<0.05).
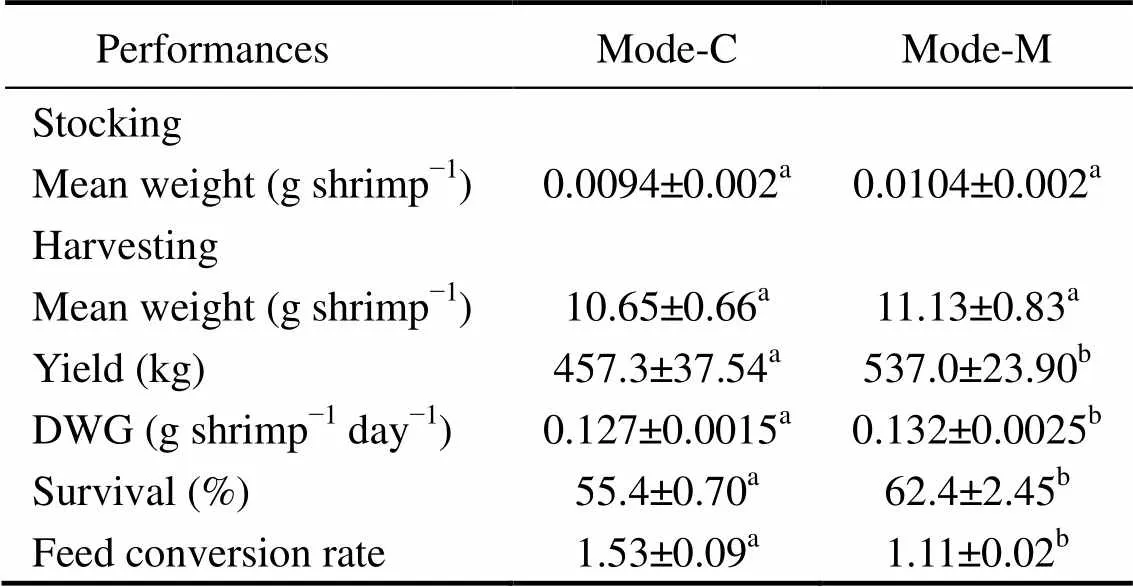
Table 4 Growth parameters of L. vannamei in outdoor treatments (mode-C and mode-M)
Notes: Values are presented as means ± S.D. Different superscript letters in the same row indicate significant differences (ANOVA test,<0.05). Mode-C denotes the outdoor tanks with cement bottom; and mode-M denotes the outdoor tanks with mud-substrate. DWG denotes daily weight gain; and FCR denotes feed conversion rate.
Shrimp size distribution in the three culture treatments are showed in Fig.2. The majority of shrimp in all treatments had the size between 10 and 11g. In the ranges of 10–11 and 11–12g, the percentages of shrimp size distribution in mode-G as well as mode-M were significantly higher than that in mode-C (<0.05). In the small size range (<10g), the percentage of shrimp size distribution in mode-M was significantly lower than that in mode-C (<0.05). In the ranges of 8–9 and 9–10g, the percentages of shrimp size distribution in mode-G were significantly lower than that in mode-C (<0.05).
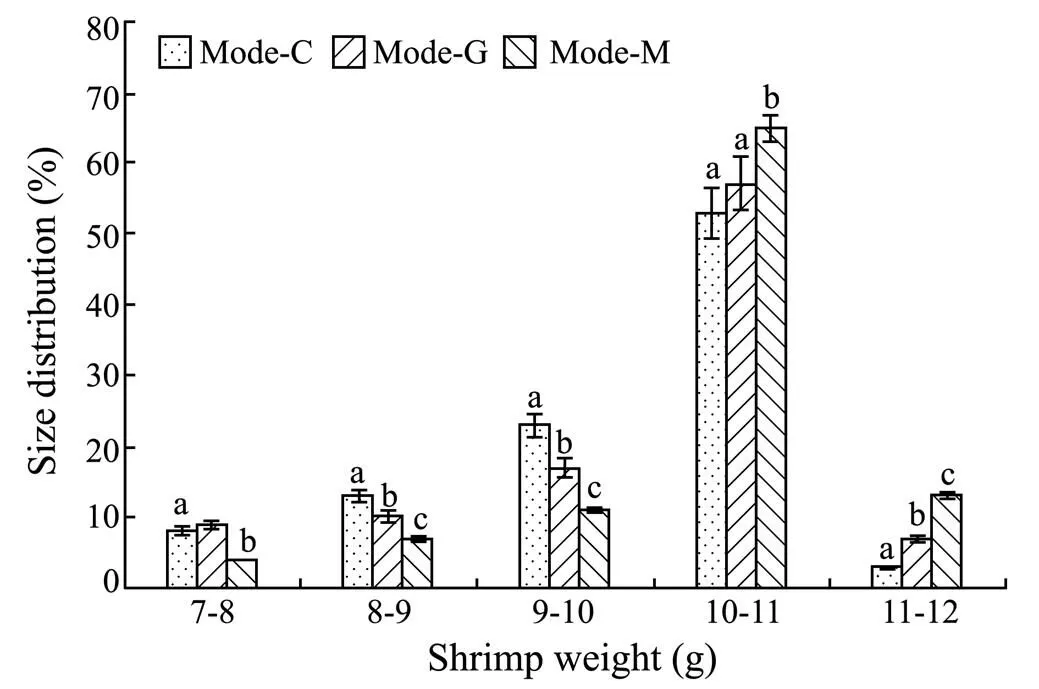
Fig.2 Size distribution of shrimp in tanks at the end of the experiment. Different letters in the same column indicate significant differences between treatments (P<0.05). Mode- C denotes the outdoor tanks with cement bottom; mode-G denotes the tanks with cement bottom in greenhouse; and mode-M denotes the outdoor tanks with mud-substrate.
3.3 Economic Performance
The production value ranged from 2437 to 3087 USD per tank and net return ranged from 1043 to 1693 USD per tank (Table 5). Comparison analyses showed that mode-G as well as mode-M had significantly higher net return and total revenue than mode-C (<0.05). In addition, the engineering cost in mode-G was increased due to greenhouse maintenance.
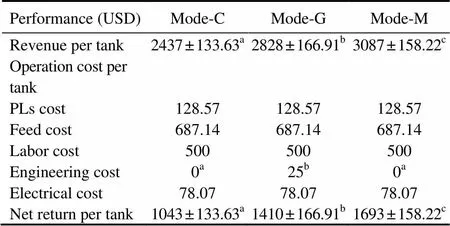
Table 5 Economic performance parameters in L. vannamei tanks of different treatments
Notes: Values are presented as means±S.D. Different superscript letters in the same row indicate significant differences (ANOVA test,<0.05). Mode-C denotes the outdoor tanks with cement bottom; mode-G denotes the tanks with cement bottom in greenhouse; and mode-M denotes the outdoor tanks with mud-sub- strate.
4 Discussion
4.1 Water Quality
The significantly higher temperature of the tank water of mode-G could be attributed to the warming effect of greenhouse (Fig.1A). The result was consistent with previous findings in several studies of associations between greenhouse-adding and water temperature in shrimp culture tanks (Huang., 2010; Neal., 2010; Sookying., 2011). Varadaraju. (2011) reported that shrimp culture could be carried out with a wide pH range (4.8–10.8), with the highest growth rate observed at pH 6.5–8.5. As for, the optimum culture pH is between 7.5 and 8.6 (Li., 2007; Mishra., 2008; Krummenauer., 2010). In present study, the pH of mode-M was within the desirable range during the culture period. However, the pH of the other two treatments was below 7.5 in the mid-late period. Our observations could be related to a recent finding by Yuvanatemiya. (2011), that the pH was higher in sediment than that in no-sediment ponds as a result of feed input. Furthermore, we observed significantly lower pH in tank water of mode-C. This emphasized the importance of mud-sub- strate in minimizing the nutrients sink.
Nitrogen plays an important role in intensive culture systems due to its dual role as a nutrient and toxicant. The capability of transforming toxicant-N to nutrient-N is an important index to evaluate diverse culture methods (Mishra., 2008; Krummenauer., 2011). TAN and NO-N concentrations in the mud-substrate treatment (mode-M) were significantly lower than those in mode-C in the mid-late culture period, possibly due to more suitable sediment micro-ecosystem and greater plankton nitrification rates (Silva., 2010).
Phosphorus is one of the most important nutrient parameters for algal growth in marine environments (Neill, 2005; Khoi., 2008; Varadaraju., 2011). Compared to mode-C, mode-M had significantly lower DIP concentrations in the late period. This could be attributed to the using of DIP by massive growth of phytoplankton and shrimp as the composition of phosphocreatine and other compounds.
Compared to the initial level, COD concentrations became almost treble at the end of the experiment, possibly due to the accumulation of organic matter such as residual feed (Zang., 2009). Overall, the COD level in mode- M was significantly lower than that in mode-C during the culture period. It was likely that the biological effect of substrate improved the water pollution. Otherwise, a certain amount of organic matter would be dissolved or suspended in the water column. Our findings concurred with that of Yang. (2008) who reported that the tanks with no-sediment had the largest increased COD compared with the tanks with substrate. Meanwhile, elevated temperature potentially accelerated the decomposition of accumulated organic matter. This might explain why the COD level in mode-Gremained at a significantly lower level than mode-C. In addition, the decrease in COD concentration in the mid period could be related to the initial regular water exchange. In present study, the treatments with mud-substrate had significantly lower COD, indicating the importance of mud-substrate in minimizing the water organic pollutants. A treatment with greenhouse as well as mud bottom was not set due to the limitation of farming conditions, which might have effect on the culture environment. Further study will be conducted to confirm the potential influences.
4.2 Growth Performance
The successful growth, survival and harvest of shrimps are heavily dependent on the tank water quality. The DWG and survival in mode-G were significantly higher than those in mode-C, possibly due to the relatively high water temperature in the early culture period. It has been reported that the greenhouse-enclosed system enhanced shrimp growth by increasing the water temperature (Li., 2009; Huang., 2010).
The mud-substrate improved shrimp survival by 7% in mode-M in comparison with mode-C. We speculated that the mud-substrate resulted in a more complicated ecosystem which stabilized the culture system with a lower diaphaneity.The lower diaphaneity could provide a hidden habitat for the growth and molting of juvenile shrimp, thereby reducing self-mutilation and improving the survival rate. Zang. (2003) reported that different substrates improved the survival rate ofjuvenile, compared to the tanks with no substrate, and the mud-substrate improved shrimp survival by 19% (58% of no-substrate, 77% of mud-substrate). In present experiment, shrimp survival was lower than those reported by previous studies (Zang., 2003; Yang., 2008; Yuan., 2010), possibly due to the high stocking density of shrimp in our tanks (up to 300PLsm).
Furthermore, the DWG in mode-M was significantly higher than that in mode-C. We suggest that the bottom sediment composition is a primary factor that contributes to nutritional energy of shrimps. Thus, the mud-substrate was conductive to accelerate the growth of shrimp (Thrush., 2003; Thakur and Lin, 2003; Silva., 2010; Krishnani., 2011). Shrimp in intensive culture tanks derive significant benefits from small suspended and settling solids in water column, and a potential food source comes from planktonic organisms and the organisms from near-bottom water column (Krummenauer., 2010; Ray., 2010). Our findings concurred with those of Zang. (2003) regarding the higher growth rate ofjuvenile in tanks with substrate than in those of non-cement treatments.
4.3 Economic Performance
The eventual measurement of economic viability of any production activity is the profitability, which is related to not only the system capacity of production but also the economic factors,., production costs and market prices.
Results showed that mode-G had less engineering cost but more net returns than mode-C. This indicated that the greenhouse cover positively affected the final profitability by increasing shrimp production. Mode-M treatment produced the highest net return and revenue, showing that the addition of substrate resulted in an extra profit. In addition, there were various market prices of shrimp regarding different sizes. The larger the shrimp harvested, the higher the market price was. The shrimp size in mode-M was larger than that in mode-G, whereas mode-G treatments were superior to mode-C (Fig.2). Thus, different size distribution of shrimp likely contributed to the significantly higher market price in mode-M.
5 Conclusions
In present study, utilization of greenhouse facility significantly increased the water temperature, resulting in elevated levels of DWG, survival and net return than mode-C. On the other side, the addition of mud-substrate in the shrimp culture system significantly reduced the levels of TAN, NO-N, DIP, and COD in water columns while improving the growth and economic performance. In order to achieve sustainable shrimp farming, the culturing methods and tank management should be optimized. Farmers should consider the use of greenhouse- enclosed systems during the early culture period to increase water temperature, and the use of mud-substrate during the entire culture period to reduce nutrient losses and improve water quality.
Acknowledgements
This research was supported by the National Key Technologies R & D Program of China (2007BAD43B06), and by contributions from the Ocean University of China, R & D Institute of Zhejiang, and Zhejiang Ocean University. The authors thank Ma Shen for assistance in the laboratory and field.
Ballester, E. L. C., Wasielesky Jr., W., Cavalli, R. O., and Abreu, P. C., 2007. Nursery of the pink shrimpin cages with artificial substrates: biofilm composition and shrimp performance., 269: 355-362.
FAO, 2011. Fishstat. Food and Agriculture Organization, Rome, 97pp.
Huang, Y. C., Xu, H. Y., Peng, R. Z., Chen, Y. T., Liang, G. J., Lin, T. L., and Xiong, Q. H., 2010. Application of plastic shed on security overwintering and early-reproduction of., 26: 403-407 (in Chinese with English abstract).
Jha, A. K., 2011. Probiotic technology: an effective means for bioremediation in shrimp farming tanks., 35: 237-240.
Jiang, D. H., Lawrence, A. L., Neill, W. H., and Gong, H., 2000. Effects of temperature and salinity on nitrogenous excretion byjuveniles., 253: 193-209.
Khoi, C. M., Guong, V. T., Drouillon, M., Pypers, P., and Merckx, R., 2008. Chemical estimation of phosphorus released from hypersaline pond sediments used for brine shrimpproduction in the Mekong Delta., 274: 275-280.
Krishnani, K. K., Gupta, B. P., Muralidhar, M., Saraswathy, R., Pillai, S. M., Ponnusamy, K., and Nagavel, A., 2011. Soil and water characteristics of traditional paddy and shrimp fields of Kerala., 58: 71-77.
Krummenauer, D., Cavalli, R. O., Ballester, E. L. C., and Wasielesky Jr., W., 2010. Feasibility of Pacific white shrimpculture in southern Brazil: effects of stocking density and a single or a double CROP management strategy in earthen ponds., 41: 240- 248.
Krummenauer, D., Peixoto, S., Cavalli, R. O., Poersch, L. H., and Wasielesky Jr., W., 2011. Superintensive culture of white shrimp,, in a biofloc technology system in southern Brazil at different stocking densities., 42: 726-733.
Li, E., Chen, L. Q., Zeng, C., Chen, X. M., Yu, N., Lai, Q. M., and Qin, J. G., 2007. Growth, body composition, respiration and ambient ammonia nitrogen tolerance of the juvenile white shrimp,, at different salinities., 265: 385-390.
Li, S., Willits, D. H., Browdy, C. L., Timmons, M. B., and Losordo, T. M., 2009. Thermal modeling of greenhouse aquaculture raceway systems., 41: 1-13.
Mishra, J. K., Samocha, T. M., Patnaik, S., Speed, M., and Gandy, R. L., 2008. Performance of an intensive nursery system for the Pacific white shrimp,, under limited discharge condition., 38: 2-15.
Neal, R. S., Coyle, S. D., Tidwell, J. H., and Boudreau, B. M., 2010. Evaluation of stocking density and light level on the growth and survival of Pacific white shrimp,, reared in zero-exchange systems., 41: 533-544.
Neill, M., 2005. A method to determine which nutrient is limiting for plant growth in estuarine waters–at any salinity., 50: 945-955.
Qiu, J., Wang, W. N., Wang, L. J., Liu, Y. F., and Wang, A. L., 2011. Oxidative stress, DNA damage and osmolality in the Pacific white shrimp,exposed to acute low temperature stress., 154: 36- 41.
Ray, A. J., Seaborn, G., Leffler, J. W., Wilde, S. B., Lawson, A., and Browdy, C. L., 2010. Characterization of microbial communities in minimal-exchange, intensive aquaculture systems and the effects of suspended solids management., 310: 130-138.
Ruiz-Velazco, J. M. J., Hernández-Llamas, A., and Gomez-Muňoz, V. M., 2010. Management of stocking density, pond size, starting time of aeration, and duration of cultivation for intensive commercial production of shrimp.,43: 114-119.
Silva, C. A. R., Dávalos, P. B., Sternberg, L. S. L., Souza, F. E. S., Spyrides, M. H. C., and Lucio, P. S., 2010. The influence of shrimp farms organic waste management on chemical water Quality.,, 90: 55-60.
Sookying, D., Silva, F. S. D., Davis, D. A., and Hanson, T. R., 2011. Effects of stocking density on the performance of Pacific white shrimpcultured under pond and outdoor tank conditions using a high soybean meal diet., 319: 232-239.
State Environmental Protection Administration, 2002.. 4th edition, Chinese Environment Science Press, Beijing, 226-280.
Thakur, D. P., and Lin, C. K., 2003. Water quality and nutrient budget in closed shrimp () culture systems., 27: 159-176.
Thrush, S. F., Hewitt, J. E., Norkko, A., Nicholls, P. E., Funnell, G. A., and Ellis, J. I., 2003. Habitat change in estuaries: predicting broad-scale responses of intertidal macrofauna to sediment mud content., 263: 101-112.
Varadaraju, S., Nagaraj, M. K., and Badami, S. H., 2011. Changes in soil and water quality parameters in selected shrimp culture tanks and its influence on shrimp production., 57: 79-82.
Yang, M., Zang, W. L., Ding, X. L., Zhang, Y., Yu, K., Fu, Q. G., and Ding, F. J., 2008. The effects of different substrates on growth ofjuvenile., 35: 105-108 (in Chinese with English abstract).
Yuan, D., Yi, Y., Yakupitiyage, A., Fitzimmons, K., and Diana, J. S., 2010. Effects of addition of red tilapia (spp.) at different densities and sizes on production, water quality and nutrient recovery of intensive culture of white shrimp () in cement tanks., 298: 226-238.
Yuvanatemiya, V., Boyd, C. E., and Thavipoke, P., 2011. Pond bottom management at commercial shrimp farms in Chantaburi province, Thailand., 42: 618-632.
Zang, W. L., Dai, X. L., Yao, Q. Z., Liu, X. C., Wan, L. Q., Cui, Y., Xu, G. R., and Ding, F. J., 2003. The effect of substrate on growth ofjuvenile., 12: 72-75 (in Chinese with English abstract).
Zang, W. L., Yang, M., Dai, X. L., Hou, W. J., Liu, Y. S., and Ding, F. J., 2009. Regulation of water quality and growth characteristics of indoor raceway culture of., 27: 740-747.
(Edited by Qiu Yantao)
10.1007/s11802-013-2321-7
ISSN 1672-5182, 2013 12 (3): 434-440
. Tel: 0086-532-82032522 E-mail: yuchuan@ouc.edu.cn
(March 23, 2012; revised May 9, 2012; accepted March 15, 2013)
© Ocean University of China, Science Press and Springer-Verlag Berlin Heidelberg 2013
 Journal of Ocean University of China2013年3期
- Journal of Ocean University of China的其它文章
- Evaluation of Antitumor, Immunomodulatory and Free Radical Scavenging Effects of A New Herbal Prescription Seaweed Complex Preparation
- Effects of Exposure to Four Endocrine Disrupting-Chemicals on Fertilization and Embryonic Development of Barbel Chub (Squaliobarbus curriculus)
- A Preliminary Phylogenetic Analysis of Luidia (Paxillosida:Luidiidae) from Chinese Waters with Cytochrome Oxidase Subunit I (COI) Sequences
- Seasonal Community Structure of Mesozooplankton in the Daya Bay, South China Sea
- Effects of Dietary Corn Gluten Meal on Growth Performance and Protein Metabolism in Relation to IGF-I and TOR Gene Expression of Juvenile Cobia (Rachycentron canadum)
- Comparison of Lipids in Organs of the Starfish Asterias amurensis Associated with Different Treatments
