灾害天气研究进展
2012-07-07 10:20
中国气象科学研究院年报 2012年0期
灾害天气
Severe Weather
灾害天气研究进展
2012年,灾害天气国家重点实验室在灾害天气监测理论和方法、灾害天气的结构与形成机理,以及数值天气预报基础科学问题和关键技术研究等方面均取得显著进展,科研成果的业务应用转化得到进一步加强。
1 灾害天气雷达监测理论和方法研究
1.1 新一代天气雷达资料质量控制、降水估测和临近预报技术
发展了基于雷达回波的多尺度跟踪及预报方法,融合了基于雷达的外推预报和订正后的风暴尺度模式预报。针对青藏高原的特点和难点,研究了适合于青藏高原的零度层亮带的识别订正方法、混合扫描仰角的计算方法和雷达雨量计联合估测降水方法。使用江淮流域长时间序列的组网雷达观测资料,分析了新一代天气雷达网数据可靠性以及组网雷达数据的系统误差。采用最新的GPS数据,开展了新一代天气雷达地物遮挡情况分析,进一步确定了我国新一代天气雷达的覆盖能力。发展出一套完善的C波段双线偏振雷达质量控制技术,并应用到云南双线偏振雷达数据分析中。(刘黎平)
1.2 青藏高原东缘水物质和边界层综合观测
2012年5—8月,在云南大理和腾冲开展了第3次青藏高原大气科学试验第1阶段外场试验工作,灾害天气国家重点实验室的C波段双线偏振雷达、毫米波雷达、风廓线雷达、微波辐射计、雨滴谱、大口径闪烁仪、GPS/探空等设备实施了水汽、云、降水和边界层观测。目前基本完成了数据的整理工作。(刘黎平)
1.3 边界层风廓线雷达反演大气比湿廓线的试验研究
基于湍流散射理论,应用L波段风廓线雷达(WPR)2011年8—9月期间在云南大理获得的观测数据进行大气比湿廓线反演。与探空获取的大气湿度廓线相比,应用WPR/RASS/GPS联合反演大气比湿廓线的精度如下:(1)WPR联合探空的温度廓线和起始边界比湿反演大气比湿廓线,与探空大气比湿廓线相比具有相同的变化趋势,相对差和标准差分别为0.75 g/kg和0.84 g/kg,误差随高度增加呈递增趋势;(2)WPR联合GPS/PWV、RASS数据反演大气比湿廓线,与探空大气比湿廓线的相对差和标准差分别为0.64 g/kg和0.85 g/kg(图1)。(阮征)
1.4 毫米波雷达功率谱密度数据在弱降水滴谱反演中的应用
建立了功率谱密度函数数据处理及其直接反演雨滴谱、液态水含量和空气上升速度的方法。利用2012年7月在云南腾冲观测的一次弱降水数据,进行了弱降水微物理参数的反演,对比分析了毫米波雷达观测的780 m高度上功率谱密度函数、回波强度、径向速度和速度谱宽与地面雨滴谱计算得到的结果,对比分析了反演的雨滴谱和观测的雨滴谱结果。讨论了该高度以下降水对毫米波雷达衰减的影响。结果表明:空气湍流对弱降水微物理参数反演影响不大,而空气上升速度和米散射效应均对反演结果有一定影响;考虑到衰减后,毫米波雷达观测到的径向速度、速度谱宽和功率谱密度函数与地面雨滴谱观测的数据比较一致,毫米波雷达数据比较可靠;反演的雨滴谱与地面观测的谱型和粒子大小也比较一致;但回波强度和雨强差异较大。这些结果初步验证了毫米波雷达观测的功率谱密度函数及其反演方法的可靠性(图2)。(刘黎平)
2 灾害天气结构与形成机理
2.1 2007年梅雨期江淮流域高分辨率逐小时雨量观测的格点化分析及与CMORPH对比
2007年梅雨期暴雨频发导致江淮流域自1954年以来最严重洪涝灾害,为了解暴雨过程,尤其是β中尺度及更小尺度过程,迫切需要获得并处理高质量公里量级的逐小时降水资料。本研究收集了江淮流域555个国家级自动气象站(AWS)和6572个区域AWS记录的逐小时降水资料,站间平均距离大约8 km,进行严格的质量控制,包括时空一致性检验、极值检验、与地基雷达观测的反射率对比,进而采用订正Cressman插值方法构建了分辨率为8 km的格点化逐小时降水资料。分析表明,这套资料能够揭示国家级AWS不能显示的对流降水的细致特征,一系列的定量检验进一步验证了该资料质量可靠。
利用该资料检验美国气候预测中心的具有相同水平分辨率的CMORPH卫星降水估计,发现CMORPH倾向于低估强降水(雨强>5 mm/h,尤其是>10 mm/h),同时高估弱降水和晴空(无降水),低估现象没有明显日变化(图3b,c),高估则具有显著日变化(图3d,e),即下午和傍晚时高估比上午更加严重。由此导致CMORPH严重低估梅雨期区域降水日变化的上午峰值,同时略微高估其下午峰值。(罗亚丽,钤伟妙)
2.2 中国东部极端降水中尺度对流系统的对流初生机制与组织结构
中国东部江淮流域梅雨期降水的日变化具有显著的双峰结构,降水峰值分别出现在09∶00(北京时,下同)左右和16∶00左右。上午的降水峰值是由夜间发生和发展的对流活动造成的,但是,目前对于夜间对流的触发机制和中尺度对流系统(MCS)组织结构的认识都比较模糊,其主要原因是缺乏高分辨率的观测资料和深入的分析。
2007年梅雨期的强降水造成淮河流域自1954年以来最严重的洪涝,7月9日王家坝水库超过警戒水位1.8 m,10日上午水库被迫分洪,造成巨大的经济损失,使数千万人失去了家园。7月8日00∶00—14∶00 淮河流域发生特大暴雨,准东西向分布的雨带横跨淮河之上,14 h累积降水达298 mm。利用高分辨率地面气象观测和雷达反射率资料以及网格距为1.1 km的显式对流模拟,研究了此次特大暴雨过程的对流初生机制和MCS结构特征。观测和模拟都说明,对流从00∶00开始连续出现,向东移动发展,组织形成生命史4~10 h的呈东西走向的β中尺度雨带,雨带向东南方向传播,构成一个准线状的MCS,产生特大暴雨。
夜间对流最初的产生主要受到两个因素的制约:一个是尺度较大的低空西南季风气流,它给对流的连续触发和发展提供不稳定能量(即高e空气);另一个是梅雨锋前大约100 km处的近地面中尺度冷空气堆,它对西南季风气流带来的高e空气的抬升导致对流触发。冷空气堆是前一天下午和傍晚的对流活动产生降水而形成的,而夜间触发的对流发展成为准线状MCS,其产生的区域平均降水在08∶00达到峰值。因此,中尺度冷空气堆与夜间对流触发的密切关系反映出梅雨降水日变化两个峰值之间的一种关联。
准线状MCS具有两种不同尺度的对流结构:一种是排列在β中尺度雨带内部的“强回波火车列”,另一种是“雨带火车列”,即多条β中尺度雨带排列起来向东南方向移动。这两种结构模态都表现为“对流单元”的“火车列”现象,但是组成它们的“对流单元”的尺度和移动特征不同。“强回波火车列”内γ中尺度强回波向东沿着相同的路径重复经过相同的地方,是产生极端降水的直接原因;“雨带火车列”中每一条β中尺度雨带的西(或西南)端有高e空气沿着对流产生的冷出流爬升,产生新的对流,这有利于逐条雨带的维持,并且形成准线状的MCS。(罗亚丽,宫宇)
2.3 暴雨、飑线和暴雪的三维结构及其演变研究
利用单雷达和双多普勒雷达反演的三维风场开展的暴雪、飑线中尺度精细结构研究发现,暴雪系统低层风的垂直切变,对于暴雪的维持具有重要作用,暴雪系统中低层为辐合区,并且基本对应着正涡度大值区,低层切变线对降雪的维持具有重要作用。利用单雷达反演风场、地面观测资料对2011年华南观测到的一次强烈弓状回波对流过程进行了分析,得到了此次弓状回波发展过程中运动学特征演变和地面直线型大风形成的动力机制。在分析理解东北冷涡系统结构的基础上,对冷涡系统的发生、发展与维持的影响因子及冷涡系统可能的强对流触发机制进行了研究(图4)。(周海光)
2.4 对流层高层冷涡、台湾地形和海峡效应对近海台风强度和结构变化的影响
研究发现,副热带高压南侧的一个高空冷涡对1010号台风Meranti近海加强有影响,高空冷涡带来的高层气流转化有利于台风发展,高空冷涡台风东侧高,低空西南风急流叠置有利于台风气旋性涡度发展,高空冷涡与低层暖湿气团配置有利于台风环流内对流发展。台湾地形及海峡效应对近海台风的结构和强度变化也有显著影响,台湾海峡两侧地形作为迎风坡有利于热带气旋环流西部对流发展,而台湾岛东侧背风坡下沉效应则抑制其东部对流发展,这是台风Nari非对称结构产生原因之一;台湾海峡的狭管效应有利于台风Nari环流内低空急流的形成与增强,有利于其登陆后的长久维持(图5)。(李英)
2.5 高原天气及其影响研究
(1)受美国科学出版社邀请,徐祥德院士主编撰写的高原研究专著“Theory and Application for Warning and Prediction of Disastrous Weather Downstream from the Tibetan Plateau”(《青藏高原对下游灾害天气的预警与预测理论应用研究》)在美国出版发行,并被美国国会图书馆收藏(图6)。专著综合了高原研究组专家有关高原对中国灾害性天气、气候影响的新认识及其研究成果。高原影响研究理论成果受美国科学出版社邀请撰稿出版,表明实验室青藏高原研究组高原研究成果已经得到国际关注。日方东京大学Koike教授为主编、中方徐祥德院士作为副主编,联合中日双方高原研究专家,在著名日本刊物JAMS上出版了中日合作JICA项目研究成果专刊。(张胜军,姚文清,陈斌)
(2)采用FLEXPAR模式轨迹分析方法,追踪分析了长江中下游地区及青藏高原地区大气水汽的“源-汇”结构,并揭示了旱涝异常年水汽源区域空间差异特征。定量分析了亚洲季风区夏季大气近地层向对流层顶区域大气输送的窗口、源区、输送路径等气候学特征,揭示区域对流层向平流层输送窗口及可能对全球平流层物质平衡产生的重要影响。利用FLEXPAR-WRF耦合模式,定量估计了夏季青藏高原及其周边区域穿越对流层顶高度的水汽输送特征,指出近地层水汽进入平流层的多寡主要与大尺度气流的垂直输送作用有关。(张胜军,姚文清,陈斌)
(3)分析了冬春季节高原雪盖近60年来的变化特征,揭示了青藏高原东部冬季积雪影响气候的上游效应,以及高原冷源效应对夏季下游地区大气环流、水汽输送和中国东部降水的可能影响。进一步探讨了青藏高原积雪关键区视热源对我国西南春旱预测的指示作用。这些研究可为短期气候预测理论与方法提供依据。(张胜军,姚文清,陈斌)
(4)采用不同区域边界层综合观测系统,从地表能量收支平衡的视角,探讨青藏高原与四川盆地能量平衡各分量结构特征,进一步认识云状况对能量平衡分量的影响问题。研究表明,青藏高原东南部大理、林芝、温江各站地表通量感热、潜热与有效能源两项相关特征明显,即存在能量闭合基本特征,但能量收支仍存在不闭合离散现象,尤其是随着近地层地表通量与有效能源的增大,其非闭合特征更加明显。青藏高原东南部(大理、林芝)春、夏季低云量与感热呈显著负相关,潜热则呈不确定特征。低云量对陆面辐射强迫的加热存在反馈效应,即高原区域低云量状况亦可用边界层通量塔向下长波辐射量来间接表征。青藏高原区域与低云量有关的向下长波辐射高值区可能是出现近太阳常数现象的重要因素之一。(张胜军,姚文清,陈斌)
(5)利用探空资料评估了美国高光谱红外大气探测仪器(AIRS)水汽月资料集,提出了AIRS卫星水汽资料相对探空资料的订正方法,形成订正过后的AIRS卫星水汽资料和NVAP水汽数据集,并结合欧洲METOP卫星装载的超高光谱红外大气探测仪(IASI)水汽资料,建立了高原地区站点观测和卫星观测的1988—2012年水汽综合数据集。高原地区的水汽含量水平方向由东南沿海向西北内陆递减,垂直方向呈现三维倾斜状结构,高原地区上空存在一个深厚的相对周边水汽含量较高的偏湿层,且偏湿程度最高在500 hPa左右,对流层的分层水汽通量和散度场的结果表明,这一水汽偏湿层对高原周边及下游地区有影响。(王东海)
2.6 初夏东亚环流对厄尔尼诺的两种响应过程及其对中国降水的影响
利用观测资料对厄尔尼诺气候进行了分析,同时用气候模式外强迫对赤道东太平洋的异常海温进行了模拟。结果表明:(1)冬季厄尔尼诺达到强盛后对次年东亚初夏的环流有明显影响,表现在低层菲律宾附近反气旋环流的增强和中高纬度OKJ类波列(主要为鄂霍次克海-日本东部-日期变更线以西副高北部的波列)的活跃。后者更容易被模拟出来,这两种环流方面的影响都能在资料中检测出来。当这两种异常环流的发展被模拟出来时,长江以南地区的多雨状态也能够被模拟出来。这表明厄尔尼诺发生后,它对夏季风的发生发展有滞后作用。这可加强向中国的南风水汽输送,但到6月由于OKJ波列的发展使波活动通量在北太平洋中西部产生大面积强烈散射使副高偏南,因而又抑制了夏季风的进一步向北推进,从而只停留在长江及其以南地区,这可能是导致降水南多北少的原因之一。(2)我国南方降水多寡受到鄂霍次克海高压及菲律宾反气旋的共同影响,两者任何一方加强时南方降水增多,反之亦然。近年来受鄂霍次克海高压的影响更为突出,鄂霍次克海高压、南北方降水、厄尔尼诺事件以及菲律宾反气旋都存在相近但又各自不同的年代际变化规律,它们的共同影响与中国南涝北旱的年代际降水格局变化有密切关系。(王亚非)
3 数值天气预报的基础科学问题和关键技术
3.1 云和降水微物理结构特征及其模式参数化方法研究
搜集整理了东亚地区1960—2010年和其他地区1940—2010年云和降水微物理的飞机直接观测结果,建立了包含气溶胶、冰核、云(雾)滴、冰晶、雪晶、雨滴、冰雹等粒子浓度和粒子谱分布、云(雾)滴和雨滴含水量,以及降水强度与雷达反射率的关系等详细信息的数据库。基于观测结果统计分析了东亚和其他地区云和降水微物理特征。整体对比东亚地区及其他地区云和降水微物理特征可以发现,云-降水粒子浓度、含水量、谱分布形式与国外观测结果大体上相似,但在具体量值上有差别。利用卫星探测数据分析了东亚大陆云垂直结构特征,探讨了可降水云和非降水云的雷达反射率(回波)垂直分布之间的差异以及其季节变化特征,分析了不同云型对东亚地区可降水粒子形成的贡献(图7)。
基于东亚地区云和降水微物理的统计特征,结合常用中尺度模式中不同微物理参数化方案的优势,构建了一套针对东亚区域云和降水的新微物理参数化方案。新方案成功耦合到WRFv3.4中尺度数值模式中,并对华南一次强对流过程进行了模拟试验。结果表明,新方案对华南局地强降水的预报表现出较好的预报能力(图8)。(王东海)
3.2 基于WRF的集合卡尔曼滤波同化技术(EnKF-WRF)预报模式系统建设
对灾害天气国家重点实验室建立起来的EnKF-WRF预报模式系统进行了本地化运行及其在GRAPES-meso中的应用研究。对北京“7.21”暴雨个例进行的试验显示,EnKF-WRF系统无论在暴雨量级预报上,还是在暴雨落区和时间预报上,以及对中尺度涡演化过程方面,都较原预报模式有较好的改进。采用WRF-EnKF同化系统产生集合预报同化资料插值到GRAPES-meso网格点的方法,尝试了GRAPES-EnKF资料同化对暴雨预报影响的研究和应用。通过个例研究发现,EnKF可以对暴雨带走向和落区预报产生积极作用,但对暴雨中心降水量预报的改善不明显。(康红文)
3.3 阴阳网格守恒算法及GRAPES模式动力框架构建
实施了网格内质量双线性分布假定下阴阳网格全球和局地质量守恒边界通量强迫方案研究,实现了在不明显增加计算量的情况下,考虑次网格质量结构的高阶守恒计算方案构建和验证(图9)。为提高时间积分精度,尝试了RK3方案和高阶Euler有限差分的高精度积分,验证了理想试验的数值积分结果(图10);对GRAPES模式的动力框架进行了完善,包括三维科氏力处理和Helmholtz方程GCR求解系数的修正,得到了新框架下完善的GRAPES三维动量方程。(彭新东)
3.4 持续性灾害天气数值预报方法研究
利用历史资料和距平积分概念,开展了15天以内数值天气预报的模式订正技术和持续性灾害天气预报方法研究,分别采用ECMWF和NCEP再分析资料为初值,对预报结果进行距平积分误差订正,显著提高了15天以内环流形势数值天气预报质量,并期望改进降水的中短期数值预报效果。(彭新东)
3.5 青藏高原降水预报对水平分辨率的敏感性研究
应用GRAPES区域模式测试青藏高原降水预报对水平分辨率的敏感性。水平网格从0.3°×0.3°到0.05°×0.05°,随着水平分辨率的提高,地形对降雨预报的不良影响逐步显现出来。尽管进行了有效的地形处理和对预报方程的修正,当水平分辨率提高到0.1°×0.1°后,由地形引起的短波非线性叠加导致降水预报明显失真。试验结果表明,为使降水预报真实合理,在青藏高原地区,水平分辨率不宜高于0.15°×0.15°(图11)。(王光辉)
4 科研成果转化和应用
4.1 高原研究成果业务应用及转化
与国家气象中心专家合作开展了高原东南缘“南低北高”大地形坡面自动气象站、GPS测站网信息在模式中同化应用的准业务化试验;形成高原关键区监测-分析-预报系统长期业务发展能力,联合构建了青藏高原及其东部周边地区(四川、云南等地区)综合气象信息观测应用研究平台,拓展了科学试验平台向业务系统转化的途径。研制高原关键区监测预警多源信息变分再分析技术,构建青藏高原及东缘地区边界层通量与水汽结构综合观测网数据库。发展了高原区域多源信息提取、融合综合再分析技术,首次研发高原探空站L波段高分辨率探空观测资料应用技术,并将高原及周边多源信息观测应用于LAPS系统、TOVS卫星-探空反演系统,对西藏、四川、云南与湖北等下游地区的汛期业务应用及防灾减灾工作起了重要作用。(张胜军、姚文清、陈斌)
4.2 雷达监测研究成果推广应用
基本完成了杭州市气象局强天气网格化临近预报业务系统建设项目“杭州市气象局临近预报系统”的研制,已进入业务试运行阶段,为预报员提供了三维雷达回波图、风场、降水估测和1 h降水预报等产品。为海军研制的“三维拼图软件系统”已通过验收,进入业务运行阶段,实现了海军某部3部雷达的拼图,为海军训练提供了灾害天气预警产品。研发的晴空回波识别算法、海浪回波识别算法、C波段新一代天气雷达径向速度处理算法、改进的地物回波识别算法等新一代天气雷达资料质量控制算法,其中一部分已经连接到新一代天气雷达软件系统(ROSE)中,进入业务评估阶段。(刘黎平)
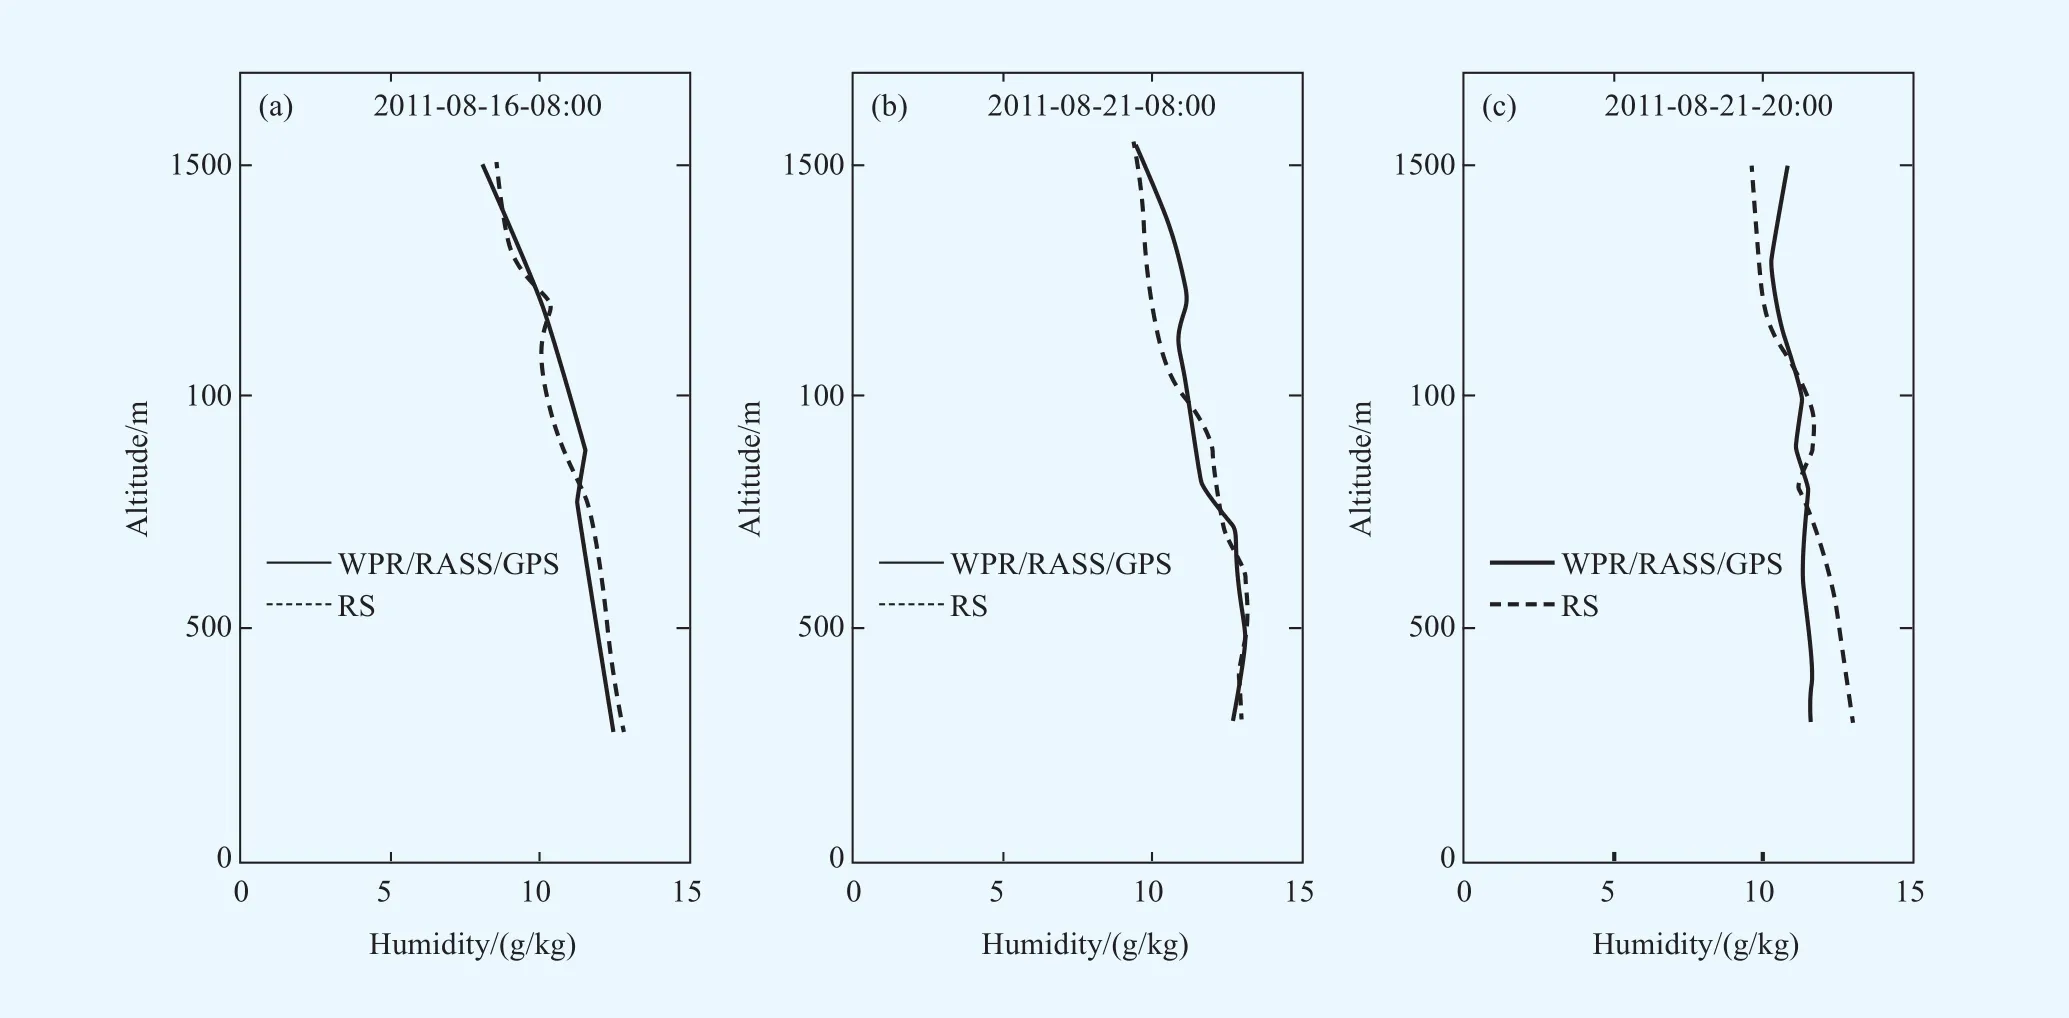
图1 WPR/RASS/GPS反演与探空比湿廓线对比Fig1 The retrieved specifc humidity profles and sounding data
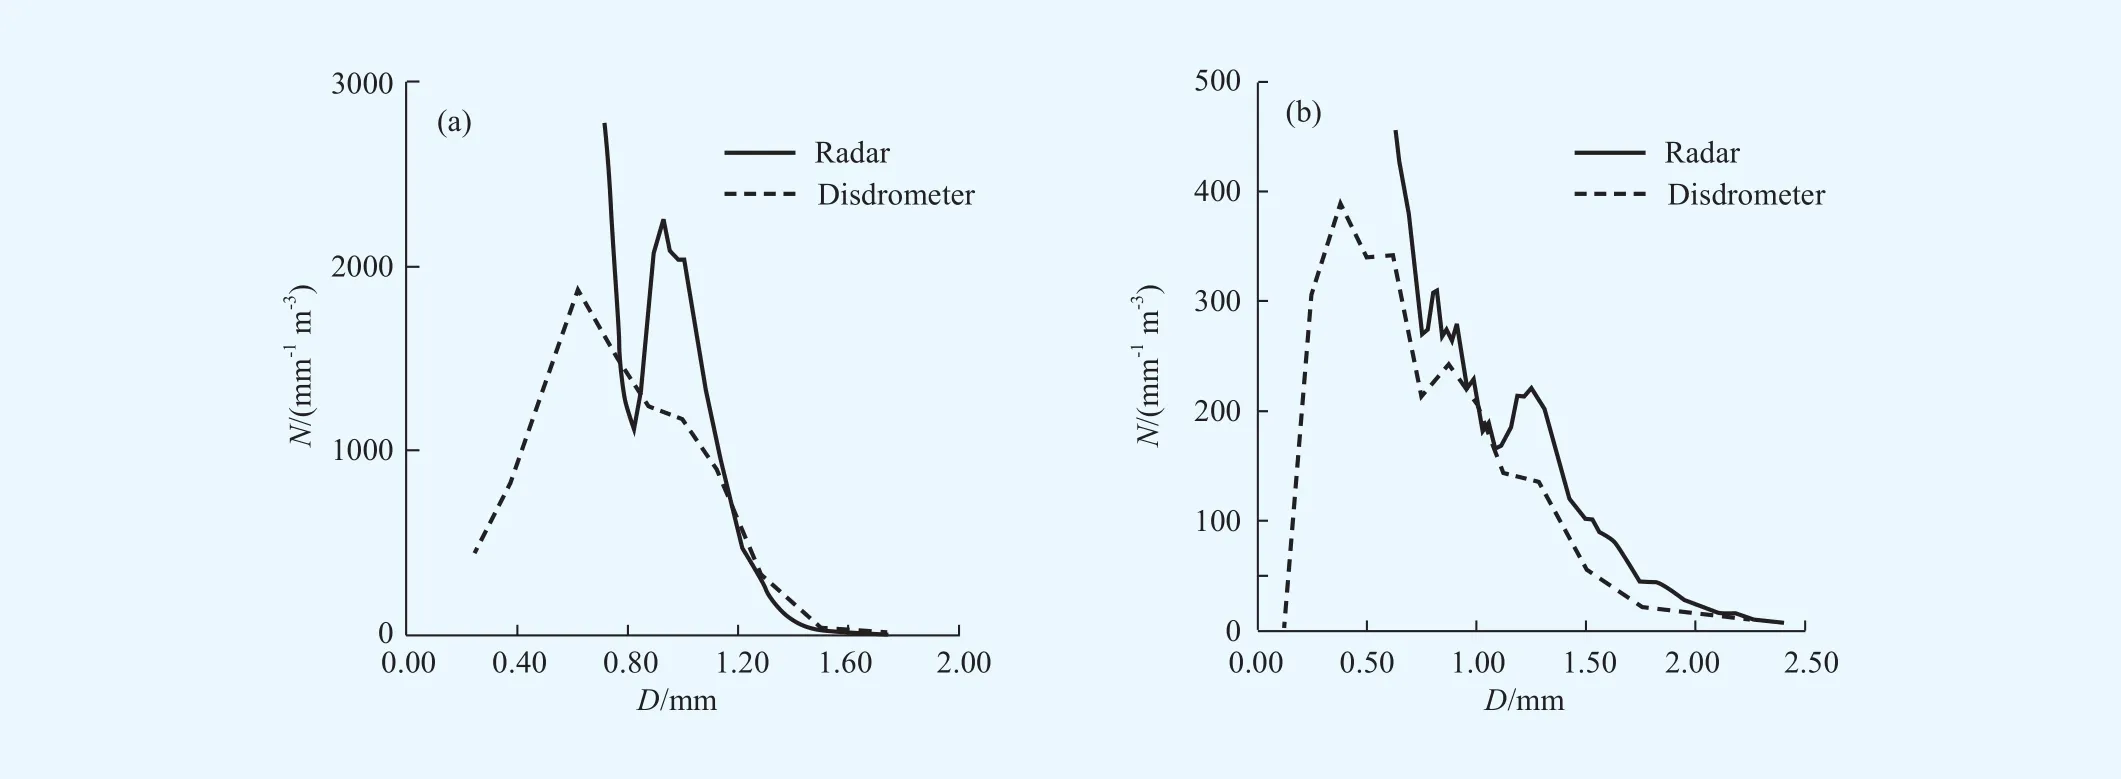
图2 2012年7月20日07∶18—07∶24(a)和7月23日09∶10—09∶15(b)雷达反演的780 m高度上的雨滴谱和雨滴谱仪观测到的地面雨滴谱的对比Fig2 The raindrop size distributions at 780 m derived by cloud radar and observed at ground by disdrometer during 07∶18-07∶24 20 July , 2012(a) and 09∶10-09∶15 23 July, 2012(b)
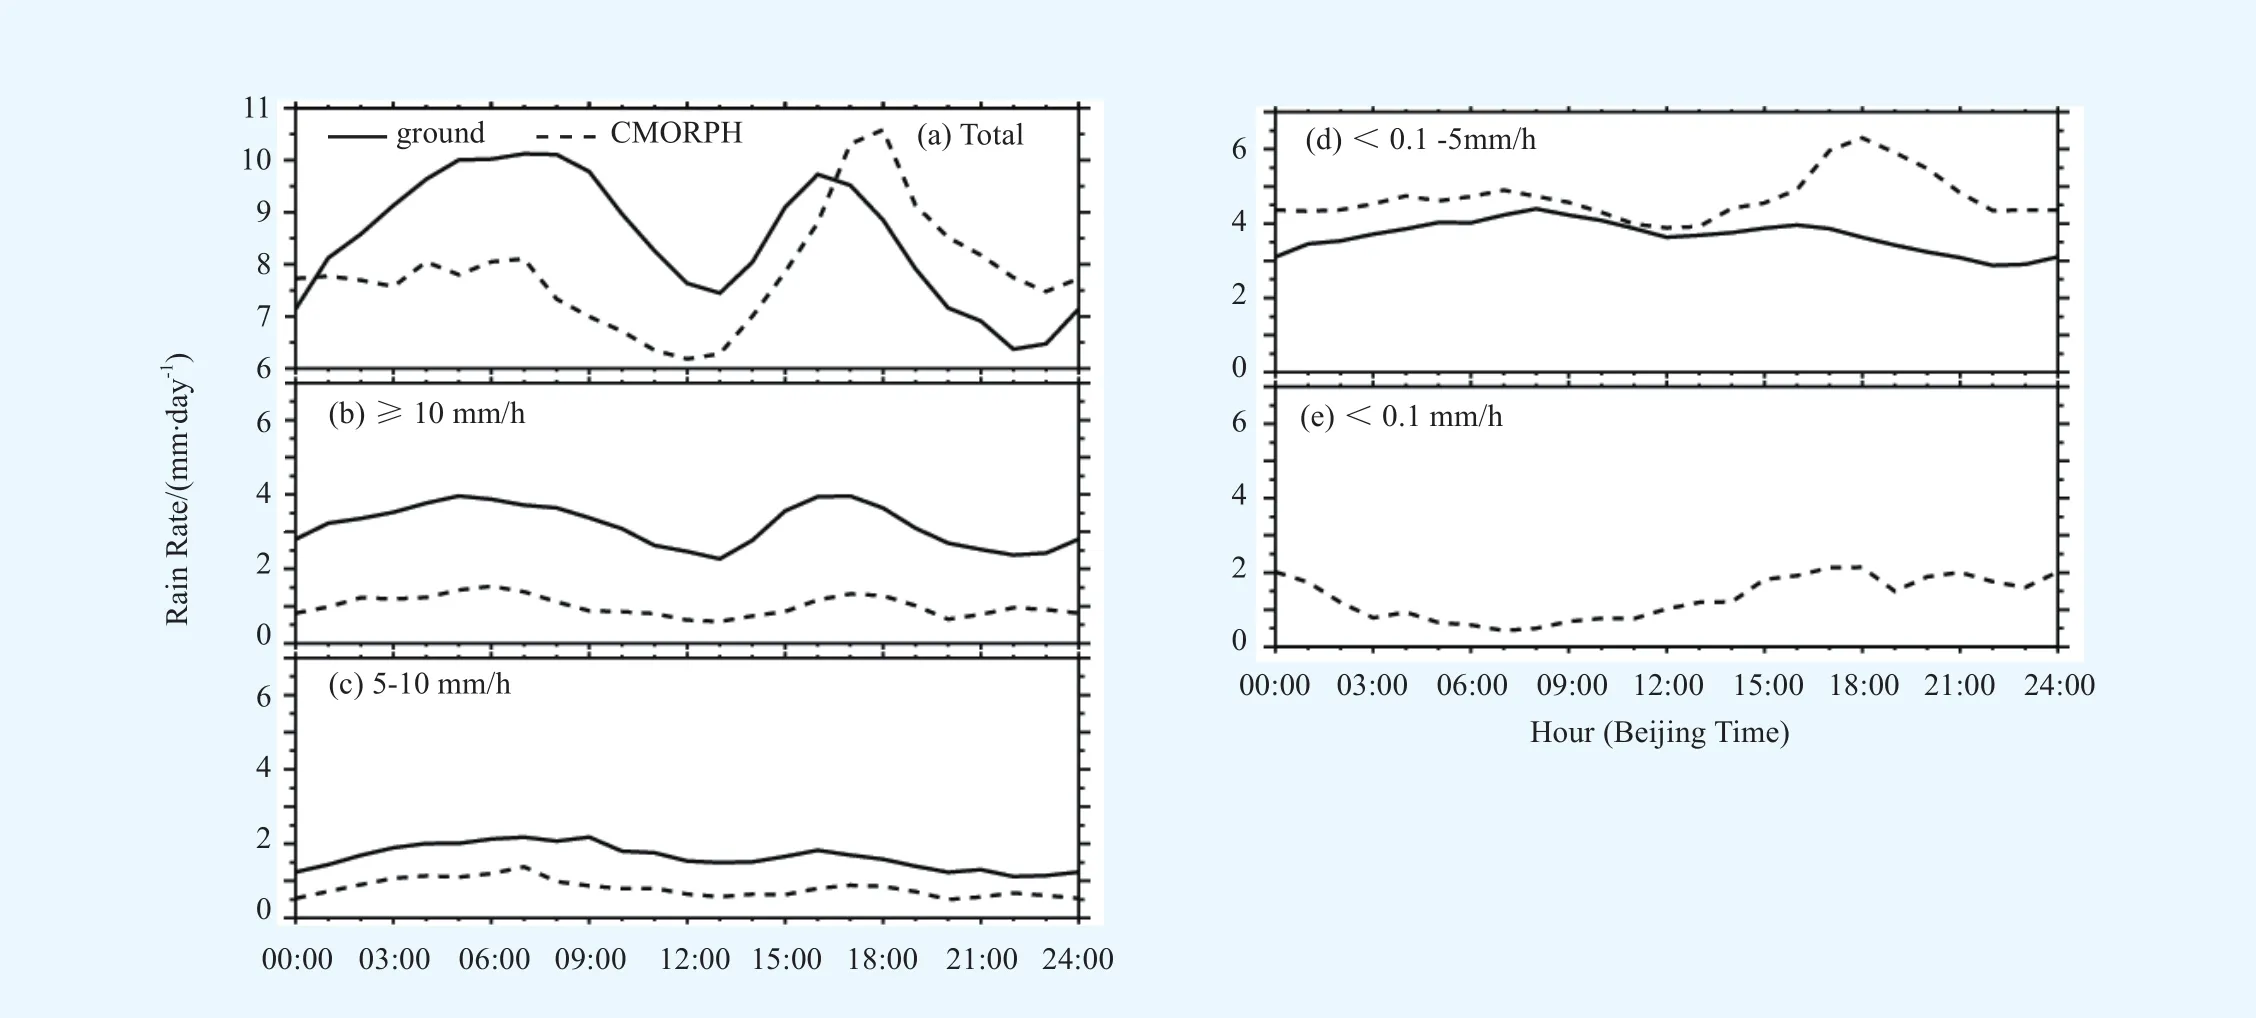
图3 实测及CMORPH卫星估测的2007年梅雨期江淮流域区域平均降水日变化:(a)总降水,(b~e)不同强度降水Fig3 Diurnal cycle of precipitation rates averaged over the Yangtze-Huai River Basin during the 2007 Meiyu season derived from the rain gauge-based analysis (solid) and CMORPH (dashed) for (a) total rainfall rates, and (b-e) different rainfall intensity categories based on the gauge-based analysis
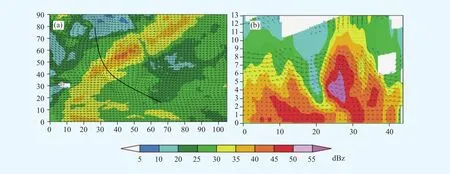
图4 2008年1月16日14∶05暴雪过程的3 km高度水平速度场(a)和2007年7月8日17∶23飑线垂直剖面u-w速度合成(b)Fig4 The snowstorm horizontal wind at 3-km level at 14∶05 LST 16 Jan 2008 (a), and the squall line u-w wind feld in the vertical cross-section at 17∶23 LST 8 July 2007 (b)

图5 台风Meranti(A)与高空冷涡(B)的相互作用:(a)300 hPa水平风场和涡度场(阴影);(b)沿台风和高空冷涡中心连线的水平风场和涡度垂直剖面(箭头:水平风场,阴影:垂直涡度)Fig5 Interaction between Typhoon Meranti (A) and upper-level cold vortex (B). (a) Horizontal wind vectors (arrows) and vertical vorticity (shaded) at 300 hPa; (b) Vertical section of wind vectors and vorticity along the centers of the typhoon and the vortex

图6 高原研究专著“Theory and Application for Warning and Prediction of Disastrous Weather Downstream from the Tibetan Plateau”(《青藏高原对下游灾害天气的预警与预测理论应用研究》)在美国出版发行Fig6 The special issue “Theory and Application for Warning and Prediction of Disastrous Weather Downstream from the Tibetan Plateau”Published in the United States
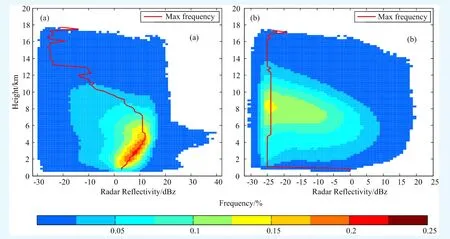
图7 可降水云(a)和非降水云(b)雷达反射率垂直分布(纵坐标每层间隔240 m,横坐标间隔为1 dBz;填色区为云在不同高度对应雷达反射率占总体百分比,红线为不同高度层频率最大值连线)Fig7 Radar refectivity distributions of (a) precipitative and (b) nonprecipitative clouds (The vertical axis represents height with intervals of 240 m, and the horizontal axis denotes radar refectivity with intervals of 1 dBz. Shaded areas indicate the percentage of the corresponding radar reflectivity at different heights to the overall radar reflectivity, and the red line is the curve that connects the points of maximum frequency for each height)
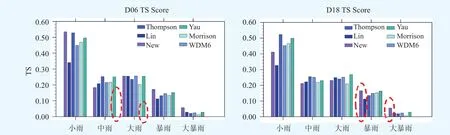
图8 不同微物理方案6 km和18 km降水TS评分Fig8 Threat score for different microphysics schemes in WRF model version 3.4 with horizontal resolutions of 6 km and 18 km
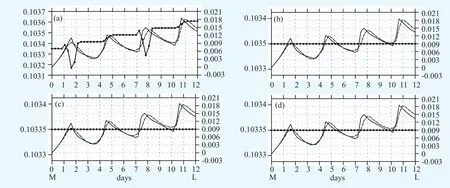
图9 在没有守恒强迫(a)和3种守恒强迫方案(b~d)中球面刚体平流计算误差增长Fig9 The error norms in a 12-day solid-body advection with non-conservation (a) and three conservative constraints (b-d)

图10 在阴阳网格上采用龙科库塔3阶时间积分和空间5阶精度差分方案的平流结果Fig10 Numerical results of a 12-day balanced-fow advection with the 3rd-order Runge-Kutta scheme and 5th-order Eulerian differencing scheme

图11 水平分辨率对青藏高原降水预报的影响Fig11 The impact of the horizontal resolution on precipitation prediction over the Qinghai-Tibetan Plateau
Advances in the Research of Severe Weather
Remarkable improvements have been made in 2012 in the felds of severe weather watching, structure and mechanisms of severe weather, and basic science and key technology of numerical modeling. At the same time, the research on operation transformation has been strengthened.
1 Severe weather watching with radars
1.1 Radar data quality control, precipitation estimation and nowcasting
The algorithms of multi-scale tracking and extrapolation of radar echo (MTREC), the blending technology based on MTREC, and a WRF-based rapid updating cycling forecast system were developed. Taking into account the special geographical environment and the ground clutter of the Tibetan Plateau, hybrid scan elevation calculation based on refectivity climatology, refectivity bright band identifcation and correction, and precipitation estimation with radar and raingauge data were developed. The biases in the refectivity data from the S-band Doppler radars over the Yangtze River Basin were examined. The coverage ability of the Doppler radar network was evaluated by using GPS data. The algorithm for dual polarization radar data quality control was developed and used in radar data processing in Yunnan Province. (Liu Liping)
1.2 Integrated observation of hydrometeor concentration and boundary layer structure along the eastern edge of the Tibetan Plateau
The frst phase compaign of the Third Tibetan Plateau Atmospheric Science Experiment has been carried out from May to August 2012 in Dali and Tengchong, Yunnan Province. Observational instruments, including a C-band polarimetric radar, a millimeter band radar, a wind profle radar, microwave radiometer, disdrometer, large aperture scintillometer, GPS sounding, etc. have been employed for observations of water vapor, cloud, precipitation, and properties of the atmospheric boundary layer. Initial data processing has been completed. (Liu Liping)
1.3 Retrieval of humidity profles with boundary layer wind profle radar
Based on the turbulent backscattering theory, humidity profiles were retrieved using the L-band Wind Profile Radar (WPR) observations from August 15 to September 10, 2011 at Dali of Yunnan Province. Compared with the humidity profles derived from radiosonde data, the WPRRASSGPS humidity profles have the following features∶ (1) Combined the WPR and the data of temperature and initial humidity of radiosonde, the WPR retrieved humidity profles exhibit the same trend with that of the radiosonde humidity profles, with mean and standard deviation being 0.75 and 0.84 g/kg respectively, both showing an increasing trend with height; (2) With the assistance of GPS/PWV and RASS data, the mean deviation and standard deviation of retrieved humidity from WPR is 0.64 and 0.85 g/kg, respectively, compared with the radiosonde observation (Fig1). (Ruan Zheng)
1.4 Application of Doppler spectral density data from micrometer radar in drop size distribution retrieval in weak precipitation
The processing algorithm for Doppler spectral density data and retrieval algorithm for DSD, liquid water content (LWC), rain rate and air vertical speed with Doppler spectral density data are presented. Two weak precipitation cases observed by vertical pointed Ka band cloud radar, Ku band micro-rain radar and disdrometer in July, 2012 at Tengchong, Yunnan Province, are examind. The vertical profles of refectivity, and velocity by cloud radar and micro-rain radar are compared. The Doppler spectral density data at the altitude of 780 mby the cloud radar, the mirco-rain radar, and that calculated from the disdrometer are compared. The DSD and rain rate are retrieved with Doppler spectral density data and compared with disdrometer data. The effect of water over the cloud radar antenna on refectivity measurement is discussed. The results indicate that the effect of air turbulence on precipitation microphysical parameters was negligible; however, the effects of air vertical speed and Mie scattering were obvious. The velocity, Doppler spectral density data, and variational pattern of reflectivity with altitude by cloud radar and mirco-rain radar were consistent; however, the reflectivity measured by cloud radar was weaker than that by the mirco-rain radar and the disdrometer. The water over the cloud radar antenna reduced the refectivity seriously. The Doppler spectral density data and DSD by the cloud radar were similar to that observed by disdrometer. This work verifed Doppler spectral density data by the cloud radar and related retrieval parameters (Fig2). (Liu Liping)
2 Structure and mechanism of disastrous weathers
2.1 Gridded hourly precipitation analysis from high-density raingauge network over the Yangtze-Huai River Basin during the 2007 Meiyu season and comparison with CMORPH
Heavy rainfall hit the Yangtze-Huai River Basin (YHRB) of East China several times during the prolonged 2007 Meiyu season, causing the worst food of this region since 1954. There has been an urgent need for obtaining high-quality, kilometer-scale, hourly rainfall data in order to understand the Meiyu precipitation processes, especially at the meso-β and smaller scales. In this paper, the authors describe the construction of the 0.078-resolution gridded hourly rainfall analysis over the YHRB region during the 2007 Meiyu season, based on surface reports at 555 national and 6572 regional automated weather stations with an average resolution of about 8 km. The gridded hourly analysis is obtained using a modifed Cressman-type objective analysis after applying strict quality control, including not only the commonly used internal temporal and spatial consistency and extreme value checks, but also verifcations against mosaic radar refectivity data. This analysis reveals many convectively generated fnescale precipitation structures that could not be seen from the national station reports. A comprehensive quantitative assessment ensures the quality of the gridded hourly precipitation data. A comparison of this dataset with the U.S. Climate Prediction Center Morphing Technique (CMORPH) dataset on the same resolution suggests the dependence of the latter’s performance on different rainfall intensity categories. Namely, the CMORPH tends to underestimate hourly rain rates over individual grid boxes on 8-km resolution when the raingauge observations indicate occurrences of intense rainfall (>5 mm/h in general and>10 mm/h in particular) but overestimate it for the raingauge observed light rainfall and clear sky categories. While the underestimation presents insignificant diurnal variations, the overestimation is more pronounced during the late afternoon and early evening hours (when rainstorms have smaller scales) than the early morning hours (when rainstorms have larger scale and longer duration). As a result, the major rainband and the early morning peak of the Meiyu precipitation are significantly underestimated, while the late afternoon peak is slightly overestimated by the CMORPH compared to the raingauge observations (Fig3). (Luo Yali, Qian Weimiao)
2.2 Convective initiation and two organizational modes in an extreme-rain-producing mesoscale convective system along a Meiyu front in eastern China
The convective initiation and organization of a quasi-linear extreme-rain-producing mesoscale convective system (MCS) along a Meiyu front in eastern China during the midnight and morning of 8 July 2007 are studied using high-resolution surface observations and radar reflectivity, and a 24-h convection-permitting simulation with the nested grid spacing of 1.11 km. Both the observations and simulation suggest that the convective initiated at 00∶00, and organized into west-east-oriented meso-β scale rainbands with life spans of 4-10 h. the rainbands propagated southeastward subsequent, formed a quasi-linear MCS, and resulted a sereve rainstorm.
The results show that the early convective initiation at the western end of the MCS results from moist southwesterly monsoonal flows ascending cold domes left behind by convective activities that developed during the afternoon-to-evening hours of the previous day, suggesting a possible linkage between the early morning and late afternoon peaks of the Meiyu rainfall diurnal variation. Two scales of convective organization are found during the MCS’ development∶ One is the eastward to northeastward “echo training” of convective cells along individual rainbands, and the other is the southeastward “band training” of the rainbands along the quasi-linear MCS. The two organizational modes are similar in the context of “training” of convective elements, but they differ in their spatial scales and movement directions. It is concluded that the repeated convective backbuilding and the subsequent echo training along the same path account for the extreme rainfall production in the present case, whereas the band training is responsible for the longevity of the rainbands and the formation of the quasi-linear MCS. (Luo Yali, Gong Yu)
2.3 Study on the 3D structure of a heavy rainfall, a squall line, and a snowstorm
The single Doppler radar data and the dual-Doppler radar 3D retrieval wind fields show that vertical wind shear is very important for snowstorm development. The low and middle levels of the snowstorm are convergence region, and correspond to the maximum convergence. The shear line at the low level is also important for the snowstorm development. The single Doppler retrieval wind and the observation data are used to study the convective bow echo in South China in 2011. The evolution feature and the dynamic mechanism of the linear convective system were probed and summarized. We also investigated the factors that impact the northeast cold vortex development and maintenance, and the convection triggering mechanism (Fig4). (Zhou Haiguang)
2.4 Impacts of upper-level cold vortex, Taiwan topography and strait channel effect on typhoon structre and intensity changes over offshore waters
Previous studies found that an upper-level cold vertex may exert influences on intensity change of typhoon over offshore waters. Typhoon Meranti (1010) was intensifed when it approached mainland China and reached its maximum intensity just before its landfall. During its evolution, a northwest-moving cold vortex in the upper troposphere appeared to the south of the Subtropical high over the western North Pacifc, revolving around the typhoon anticlockwise from its east to its north. This resulted in the change of airfow direction above the typhoon, leading to a weak vertical wind shear, which in return facilitated the development of Typhoon Meranti. Meanwhile, to the east of Typhoon Meranti, the overlapped southwesterly jets in the upper and lower troposphere accelerated the typhoon tangential wind and contributed to its cyclonic development. Besides, the cold vortex transported weak cold advection to the typhoon outer rainbands, causing increased vertical instability in the atmosphere, which was favorable for convection development within the typhoon circulation. It is found that the topography and channel effect of the Taiwan Strait also affect typhoon structure and intensity changes. Typhoon Nari (2001) made landfall on the northern coast of Taiwan and maintained its center over the Island for about 36 h, with a semicircle cloud structure. It is shown that the ascending air fow in Nari’s western circulation was strengthened by the windward slope of the mountainous terrain along the Taiwan Strait; however, the leeward slope sinking effect on eastern region to the island inhibited convection development in the typhoon’s eastern circulation, which was responsible for the formation of the semicircular asymmetric structure of Nari. Besides, the channel effect of the Taiwan Strait benefted the strengthening and stretching of the lower layer jet stream in the periphery of Nari, which was favorable not only for water vapor convergence in the strait, but also for the increase of the angular momentum, thus sustaining Nari over the island for a longer time (Fig5). (Li Ying)
2.5 Research on the weather over the Tibetan Plateau and the impact of the Tibetan Plateau
(1) Invited by the Science Press of the United States, Prof. Xu Xiangde and the co-authors published a special issue entitled “Theory and Application for Warning and Prediction of Disastrous Weather Downstreamfrom the Tibetan Plateau”, which was collected by the US Congress Library (Fig6). In this special issue, comprehensive research results and new recognitions about the effect of Tibetan Plateau (TP) on severe weather and climate in China were summarized. Publication of this special issue on the TP effect in theory and obserations by the US Science Press indicates that the research of the TP group of State Key Laboratory of Severe Weather has gained attention from the international science community. Furthermore, based on the research results from the China-Japan Cooperation Project (JICA), Prof. Koike (chief editor) and Prof. Xu (associate editor), together with other specialist on TP research from China and Japan, published a special issue about the advance of TP researches in the Journal of the Meteorological Society of Japan. (Zhang Shengjun, Yao Wenqing, and Chen Bin)
(2) Based on a Lagrangian dispersion model FLEXPART driven by the NCEP/NCAR global forecast system reanalysis data, a comprehensive tracking analysis has been conducted to track the source-sink structure of atmospheric moisture over the Yangtze River Basin (YRB) and the Tibetan Plateau, and also to reveal the differences of moisture source distribution between the wet and dry years. The in-depth evaluation shows that the interannual variability of precipitation over YRB is strongly related to the moisture sources in the Bay of Bengal and Arabian Sea. Particularly, from a climatological perspective, analysis of the air transport from the atmospheric boundary layer to tropopause layer over Asian monsoon regions during boreal summer has been conducted to reveal the transport pathways and timescale of troposphere to stratosphere transport, as well as the surface sources, defned in terms of the locations where each trajectory last left the atmospheric planetary boundary layer. The results show that the transport over these regions could have signifcant impacts on the budget of global atmospheric constituents and climate change. Using the coupled FLEXPART-WRF model system, the characteristics of water vapor transport from the atmosphere boundary layer to the stratosphere over the Tibetan Plateau in summer have also been investigated. The results indicate that the water vapor transport from the surface layer to the stratosphere over the Tibetan Plateau in summer is potentially controlled by large-scale circulations associated with the southern Asian monsoon, while small-scale circulations caused by convections play a secondary role. (Zhang Shengjun, Yao Wenqing, and Chen Bin)
(3) Based on the features of winter/spring snow cover (SC) depth distribution and its variance at 753 stations in China from 1955 to 2004, the downstream effect of the Tibetan Plateau snow cover (TPSC) as a cold source on the East Asian climate, and the “cold source” forcing effect of winter TPSC on its subsequent downstream summer atmospheric circulation over East Asia as well as on water vapor transport and precipitation in East China were revealed. Furthermore, the precursory strong signal characteristics of the Tibetan Plateau key area SC for the spring drought/food in Southwest China were discussed. The results will help to provide theoretical and technical support for short-term climate prediction over East Asia. (Zhang Shengjun, Yao Wenqing, and Chen Bin)
(4) From the aspect of energy balance, using the boundary layer integrated system observations at Dali, Linzhi, and Wenjiang flux stations, the structural characteristics of the surface energy balance (SEB) components over the Tibetan Plateau and the Sichuan Basin were examined in order to further investigate the impacts of cloud on the SEB. It is found that on the southeast edge (Dali, Linzhi, and Wenjiang) of the Tibetan Plateau, the sensible and latent heat were signifcantly correlated with the available energy, which is a basic feature of the SEB closure. But the SEB still shows a scatter and non-closure phenomenon especially in the surface layer where SEB non-closure became more obvious with the increasing of surface fux and available energy. In spring and summer, the low cloud cover in the southeastern Tibetan Plateau (Dali and Linzhi) was signifcantly negatively correlated with surface sensible heat fux, but its correlation with latent heat fux was weak and uncertain. There exists a heating feedback effect of the radiation forcing of low clouds on the land surface, i.e. the low cloud status in the Tibetan Plateau could be indirectly expressed with the downward longwave radiation fluxes observed at flux towers. The high value areas of the downward long-wave radiation associated with low clouds might be one of the important infuential factors for the occurrence of the near-solar constant phenomenon in radiation observation over the plateau. (Zhang Shengjun, Yao Wenqing, and Chen Bin)
(5) We explored the applicability of the gridded (level 3) monthly tropospheric water vapor (version 5) retrievals from the Atmospheric Infrared Sounder (AIRS) instrument and the Advanced Microwave Sounding Unit (AMSU) on-board the NASA Aqua satellite over the Tibetan Plateau through comparison with carefullyprocessed radiosonde data, and two ftting functions were further derived by using radiosondes for warm and cold seasons, respectively. A water vapor dataset from 1988 to 2012 over the Tibetan Plateau was established by combining radiosonde data, revised AIRS water vapor retrievals, data from the NVAP (NASA Water Vapor Project) and products of IASI (Infrared Atmospheric Sounding Interferometer) on-board the European METOP satellite. It is shown that intense horizontal gradients appear along the edges of the plateau in tropospheric water vapor, particularly over the regions along the southeastern boundary. Note that there is always a deep layer of high water vapor content over the plateau with a peak around 500 hPa. This layer of high water vapor content has constant infuences on precipitating processes in the downstream regions such as the valleys of Yellow and Yangtze River. Estimated vertically-integrated water vapor fux and moisture divergence in the two layers (500-700 hPa and 300-500 hPa) further confrm the effect of the Tibetan Plateau on the downstream regions. (Wang Donghai)
2.6 Two response processes of the East-Asian atmospheric circulation in early summer to the preceding El Niño event and their infuences on rainfall over China
Using observational data and a GCM, we examined the impact of the preceding El Niño event on East Asian circulation. The climate simulations show that there are two kinds of major impacts of El Niño in mature phase on the atmospheric circulation over East Asia in next early summer. The two ways of the impacts are associated respectively with the development of the low-level anticyclonic circulation around the Philippines and the active mid-level Okhotsk-Japan wave-train-like pattern (OKJ pattern) that accompanies the development of the Okhotsk high. The latter is more easily simulated by the climate model. Both patterns of anomalous circulations can be observed in data. The positive rainfall in South China with the two anomalous circulation patterns in next June was also simulated after a positive SST anomaly in Nino-3 region was added in autumn, which indicates a delayed impact of El Niño on East Asian summer monsoon. The anomalous circulations result in stronger southerlies in the area to the south of the Yangtze River. On the other hand, the northward progress of summer monsoon, which is characterized by the movement of the subtropical high, was strongly suppressed by the wide scope of scattering wave activity fux over the oceanic area from Japan to the dateline of North Pacifc in middle latitudes. This suggests that the delayed impact of ENSO is one of the factors that cause the climate pattern of the fooding in South China and drought in North China. In addition, statistic analysis indicates that increased rainfall occurring in South China is strongly influenced by the development of the Okhotsk high and the anticyclone around the Philippines in early summer. Either of them can result in fooding in South China and vice versa. The Okhotsk high plays a more and more important role in causing the southern fooding recently. The Okhotsk high, the rainfall in North/ South China, ENSO events, and the anticyclone around the Philippines have similar but their own decadal variability, which suggests their different responses to the global climate warming. (Wang Yafei)
3 Basic science and key technology of numerical modeling
3.1 The cloud-precipitation properties and the model parameterization
A survey of the existing literature on the in-situ measurements of cloud-precipitation microphysical properties has been undertaken. Then, a database is established, which includes microphysical properties of aerosol, ice nuclei (IN), cloud droplet, fog, ice crystal, snowcrystal, raindrop, hail, and the relationship between radar refectivity (Z) and rainfall rate (R), based on the in-situ data reported in the existing literature. The data coverage is divided into East Asia and the other regions (Americas, Europe, Australia, and Africa). The time span of the in-situ probe measurements ranges from 1958 to 2010 for East Asia and from 1940 to 2010 forthe other regions. Based on the database, a statistical analysis has been performed. The cloud-precipitation properties over East Asia have been compared with those over the other regions. The results show that there are differences, sometimes even large differences, between East Asia and the other regions in terms of these cloud-precipitation microphysical characteristics. The CloudSat satellite data during the period from June 2006 to April 2011 are used to investigate cloud vertical profles over the region of East Asia (20°-50° N, 80°-120° E), with particular emphasis on comparing the profle of precipitative clouds with that of non-precipitative clouds, as well as the seasonal variations of these profles (Fig7).
A new double-moment bulk microphysics scheme predicting the number concentrations and mixing ratios of six hydrometeor species (cloud droplets, rain, cloud ice, snow, graupel, and hail) has been developed based on the observations over East Asia, and coupled with the Weather Research and Forecasting model (WRF v 3.4). The local heavy rain event occurring on 24—25 June 2010 in southern China was simulated using the new scheme and the fve sophisticated microphysics schemes in the WRF model. The results show that the simulated 24-h accumulated precipitation is in general consistent with the observations (Fig8). (Wang Donghai)
3.2 Construction of an Ensemble Karlman Filter Assimilation System based on WRF
An Ensemble Karlman Filter Assimilation System based on WRF (EnKF-WRF) is established in our laboratory, and the evaluation and its application combined with the GRAPES model are also carried out, using the Beijing 7.21 storm case. The results show that the new system is superior to the 3DVar-WRF not only in predicting the rain amount, but also in predicting rain location and rain period. In addition, the new system also simulates better vortex evolution than 3DVar-WRF. The analysis felds assimilated from the EnKFWRF are also incorporated into GRAPES-meso through an interpolation method, and the results show that the assimilated data can help GRAPES-meso with the rain location and its trends; however, the improvement in rainfall amount is still not obvious. (Kang Hongwen)
3.3 Conservative constraint for the Yin-Yang grid and construction of the GRAPES new dynamical frame
Under the assumption of bi-linear distribution of sub-grid scale structure, a global and local high-order conservative constraint scheme is developed to ensure boundary mass fux balance. The high-order algorithm is evaluated with idealized tests (Fig9), which displays high-quality effects in conservation without obviously increased cost of computation. A 3rd-order Runge-Kutta scheme, in addition to the high-order Eulerian differencing scheme, is used to validate the application for improvement of numerical accuracy (Fig10). The GRAPES dynamical frame is reconstructed on the Yin-Yang grid with a full description of the threedimensional Coriolis force and correction to coeffcients of the Helmholtz equation for GCR method.(Peng Xindong)
3.4 Model error correction in the numerical prediction of successive disastrous weather
Making use of the anomaly integration and historical data, we studied the model error correcting technique for numerical weather prediction of successive disastrous weather for 15 days. As verifed by the ECMWF and NCEP reanalysis data, the quality of such predictions is obviously improved with the proposed error correcting method. Therefore, this method is desirable to improve the short- and medium-range prediction of model precipitation. (Peng Xindong)
3.5 Sensitivity of the precipitation prediction over the Tibetan Plateau to horizontal resolution
The GRAPES (Global/Regional Assimilation and Prediction System) regional model was used to test the sensitivity of the precipitation prediction over the Tibetan Plateau to horizontal resolution. The horizontal grid was changed from 0.3°×0.3° to 0.05°×0.05°. With the increased resolution, the bad impact of topography on precipitation prediction started to emerge. Although a topography processing was effectively performed and the prediction equations was revised, there was still a distortion in the precipitation prediction due to the nonlinear superposition of small-scale waves caused by topography when horizontal resolution was set to be 0.15°×0.15°.Our test results show that horizontal resolution should not be higher than 0.15°×0.15° in order to achieve realistic precipitation prediction for the Tibetan Plateau region (Fig11). (Wang Guanghui)
4 Research on operation transformation and application of scientifc achievements
4.1 Transformation and application of the Tibetan Plateau research
The quasi-operational experiments with the assimilation of GPS and AWS data from stations in southeastern slope of the Tibetan Plateau (TP) into the numerical model were carried out by researchers of the Chinese Academy of Meteorological Sciences and specialists from the National Meteorological Center in order to develop a long-term operational forecasting system to monitor, analyze, and forecast the weather systems in key areas over the TP. The integrated meteorological observation and application platform over the TP and its eastern neighboring areas were constructed, and the approach of change from scientifc research to operational application was expanded. Based on the development of reanalysis technique about extraction, integration, and variation on the multi-source observations over the TP key area, an integrated database of boundary layer flux and water vapor structure over the TP and its eastern surrounding area was constructed. Furthermore, the application technique of L-band sounding observation over the TP was developed for the frst time. The application of multi-source observational information over the TP and its adjacent areas into the LAPS system and the TOVS-sounding retrieval system plays an important role in food control and disaster prevention and reduction in Xizang, Sichuan, Yunnan, Hubei and other provinces. (Zhang Shengjun, Yao Wenqing, and Chen Bin)
4.2 Operational application of severe weather watching with weather radar
The project of developing an operational severe weather nowcasting system for Hangzhou Meteorological Bureau was basically completed. The system has been put into test runs, providing 3D mosaic refectivity, wind feld, QPE, QPF, etc. for forecasters.
The Radar 3D Mosaic System developed for the Navy of China has been offcially established. It mosaics refectivity from three radars, providing products for disaster weather warning.
The algorithms of distinguishing clear air echo, recognizing sea clutter, and processing of radial velocity for CINRAD C-band radars were investigated. The algorithms for identifying ground clutter for CINRAD were improved, and some of these algorithms have been embedded into ROSE and put into operational assessment. (Liu Liping)
猜你喜欢
中等数学(2022年5期)2022-08-29
农业工程学报(2022年11期)2022-08-22
成都信息工程大学学报(2021年5期)2021-12-30
成都信息工程大学学报(2021年4期)2021-11-22
黑龙江气象(2021年2期)2021-11-05
空间科学学报(2021年4期)2021-08-30
中等数学(2020年2期)2020-08-24
疯狂英语·新读写(2018年3期)2018-11-29
北京航空航天大学学报(2016年6期)2016-11-16
现代计算机(2016年11期)2016-02-28