生态与农业气象研究进展
2012-07-07 10:20
中国气象科学研究院年报 2012年0期
生态环境与农业气象
Ecological Environment and Agrometeorology
生态与农业气象研究进展
2012年,生态环境与农业气象研究所在生态与农业气象理论及应用、农业气象防灾减灾、生态与农业对气候变化的响应与适应3个领域取得了一系列成果,部分成果得到了推广应用。
1 生态与农业气象理论及应用技术
1.1 基于集合卡尔曼滤波的PyWOFOST模型在东北玉米估产中的适用性研究
在基于集合卡尔曼滤波(EnKF)构建的遥感信息-作物模型耦合模型(PyWOFOST)的基础上,建立了以叶面积指数(LAI)为结合点、使用MODIS LAI数据作为外部同化数据的中国东北玉米同化模拟模型。LAI的模拟结果表明,同化后的模拟LAI明显比同化前的模拟LAI更接近实测值,特别是同化前模拟较差的部分。产量模拟结果表明,尽管同化外部观测信息后,存在一个与实测产量相对接近的同化模拟产量,但由于WOFOST模型本身无法准确地模拟严重灾害条件下的作物生长发育情况,因此即使同化后的模拟产量较同化前有所改进,但仍与实测产量存在一定误差。(赵艳霞)
1.2 华北地区冬小麦潜在产量和雨养产量模拟研究
自主研发了适合华北地区冬小麦研究的区域模拟系统。收集整理了华北平原40个站点的模型所需数据,驱动区域模拟系统,模拟了2003—2007年冬小麦生长状况。冬小麦潜在产量高值区集中在华北平原中部一带,南北两端较低,其中北部又比南部稍高;平均雨养产量呈南北高、中间低的趋势。北部产量高的原因是潜在产量较高,且生育期内的降水相对较多。平原中部产量低的原因是生育期内降水较少。南部产量相对较高的原因是该区域是降水量最高的区域。从模拟结果看,潜在产量和雨养产量的模拟结果基本合理地反映了生产潜力的实际,表明所建立的模型能较好地模拟区域冬小麦的生长发育以及产量形成,适用于华北地区作物的模拟研究。(邬定荣)
1.3 青藏高原探空大气水汽总量误差及其订正方法
以地基GPS遥感的大气水汽总量(GPS_PW)为参照标准,对拉萨(1999—2010年)和那曲(2003年)探空观测的大气水汽总量(RS_PW)进行对比分析和大气水汽总量(PW)偏差(GPS_PW-RS_PW)订正。结果表明,近10多年拉萨站RS_PW比GPS_PW明显偏小,偏小程度随使用不同的探空仪而异。近10多年大气水汽总量偏差呈减少趋势,这与探空仪性能改进有关。分析发现,青藏高原大气水汽总量偏差具有明显季节变化和日变化特征,夏季比冬季明显,12∶00比00∶00(世界时)明显。太阳辐射加热与气温的日变化和季节变化是造成高原大气水汽总量偏差日变化和季节变化的重要原因。据此,提出了高原大气水汽总量偏差订正方法,并以拉萨和那曲站为例进行大气水汽总量偏差订正,订正后的大气水汽总量系统偏差显著减小,随机误差也相应得到改善。(梁宏)
1.4 华北夏玉米生长模型(GCGA Maize)的初步构建
积温法(TSUM)、热量单位法(TCHU)和热量累积法(THU)等几种常用发育模式的比较结果显示,THU的方差和变异系数均最小,稳定性最高。进一步构建了发育阶段温度强度和土壤水分对发育进程的订正模式,使发育模式的模拟能力得到改善。基于Farquhar等的光合生化理论构建了夏玉米叶片光合生化模式,并与简单的负指数模式进行了模拟比较,结果表明前者的总体拟合效果更好。根据土壤水分运动方程及其简化求解方法建立了农田土壤水分运移模式,并与土壤水分平衡模式进行比较发现,水分平衡模式的反应更灵敏,而水分运移模式的模拟值变化较小,但更稳定。探讨了基于观测数据同化的作物生长模型参数估计方法。联立以上发育模式、光合生化模式、水分运移模式以及参数估计方法,初步建成了华北夏玉米生长模型(GCGA Maize)。(马玉平)
1.5 基于遥感数据与作物生长模型同化的华北夏玉米长势评价
开展了观测数据与作物生长模型同化方法的正确性验证,通过模型状态变量对不同参数或变量初值的敏感性分析、观测数据对敏感参数的约束性分析,确定了模型的待优化参数,利用优化算法实现遥感数据与作物生长模型的同化。利用遥感作物生长同化模型模拟的不同年份生物量动态累积过程及最终生物量与同期平均气候下生物量的比较,确定了作物长势评价指标。在作物生育期结束获得全生育期气象资料后,根据模拟地上总干重的大小进行了年度作物长势评价。利用各地实测作物出苗日期、品种熟性数据以及实时逐日气象数据驱动遥感作物生长同化模型,计算不同年份该日作物累积生物量与同期平均气候条件下生物量的差值百分比,动态评价了生育期内各时段夏玉米长势变化。(马玉平)
1.6 西北春小麦生育期与气温变化的关系研究
以典型春小麦灌溉耕作区武威农试站1990—2011年和雨养耕作区定西农试站1986—2011年观测数据为依据,统计分析了春小麦发育期变化与积温变化的关系。武威春小麦1990—2011年发育期缩短了20天,发育期有显著缩短趋势(P<0.01,r =0.827),定西春小麦1986—2011年发育期缩短了13天,发育期也有显著缩短趋势(P<0.05,r = 0.463)。研究表明,自苗期开始的积温持续增加是导致西北地区春小麦发育期提前和生育期缩短的主要原因(图1)。(俄有浩)
1.7 基于TOPMODEL模型和新安江水文模型构建的新水文模型
考虑到TOPMODEL模型刻画地下水动态变化时存在与实际情况偏差的问题(平均地下水水位线高于地面)和新安江模型无法有效表达地下水位的动态变化,研究提出了降雨-径流模型XXT。该模型的一个非常重要的特征是把土壤蓄水容量曲线和地下水水位线紧密关联,形成新的蓄水容量曲线概念,并与TOPMODEL模型土壤分层结构及地下产流方程结合,通过严密地数学推导形成了新产流方程和新的水量平衡方程,在此基础上构建了新型降雨-径流模型XXT(第1个X代表新安江,第2个X借鉴了农学中的“杂交”符号,T代表TOPMODEL),该模型主要由4个模块构成,即数据前处理模块、土壤湿度空间分布可视化模块、产流模块及汇流模块。(赵俊芳)
1.8 水热影响的植物展叶期模型
大量研究表明,水分是影响植物展叶期的重要因子,特别是前一年降水对次年的返青期影响显著。通过深入分析不同时期降水对植物展叶期的作用,构建了基于降水的水分因子分模型,结合积温模型,发展了一个普适的水热物候模型。对东北地区植物展叶期的验证表明,模型具有很好的适用性,模拟误差小于4天,优于国内外同类模型。模型定量解释了植物展叶期对相互作用的水热因子响应机制,对准确评估生态系统生产力与碳收支具有重要意义。(周广胜)
1.9 草原光能利用率参数化
基于研究站点数据分析,比较了内蒙古典型草原与荒漠草原的光能利用率季节及年际变异。结果表明,尽管典型草原的总初级生产力显著大于荒漠草原,其光能利用率却显著小于荒漠草原。水分是内蒙古典型草原与荒漠草原光能利用率的主要限制因子,而温度的影响不显著。光能利用率对环境因子的敏感性(直线回归的斜率)在两类草原间存在显著差异。散射辐射在典型草原中对光能利用率具有一定的促进作用,但在荒漠草原中这种促进作用不显著。(周广胜)
2 农业气象防灾减灾技术研究
2.1 不同等级干热风灾损评估模型的初步建立
采用黄淮海地区逐日气象资料和小麦发育期、产量、干热风灾害等数据,基于公认的冬小麦干热风灾害指标,计算了不同等级干热风危害指数,构建了不同等级干热风灾损评估模型并进行了评估,得到一些初步结论。黄淮海各地区冬小麦不同发育时段的干热风危害指数平均为:轻度干热风危害下,各地区干热风危害指数在抽穗-开花时段最大,开花-乳熟时段居中,乳熟-成熟时段最小;重度干热风危害下,各地区干热风危害指数在乳熟-成熟时段最大,抽穗-开花时段居中,开花-乳熟时段最小。从抽穗到成熟,轻度干热风危害指数最大,重度干热风危害指数最小。此外,基于构建的不同等级干热风灾损评估模型,计算了发生干热风后的实测产量比灌浆期未受灾的正常预计产量的减产百分比。结果显示,重度干热风危害下,小麦减产率平均为26.1%。(赵艳霞)
2.2 农业干旱灾害静态和动态风险评估概念模型和指标体系
农业干旱灾害的风险形成是多因素综合作用的结果。作物干旱除受气候条件影响外,土壤性质、地貌类型、地下水状况、作物本身的需水特征以及干旱灾害管理水平、区域的抗旱减灾能力等人为因素都影响其干旱灾害风险的发生及强度。因此,基于农业干旱灾害风险形成机理,从农业干旱灾害发生学的角度建立农业干旱灾害风险概念框架,并在此基础上选取辽西北最主要的玉米作物作为研究示范对象,建立了农业干旱灾害风险评价的指标体系。(王春乙)
2.3 全国农业洪涝灾害风险分析与评估
采用逐日降水量资料、地形数据、基础地理数据、公里网格土地利用数据、公里网格人口数据和公里网格GDP数据等,综合考虑降水、地形、河流与湖泊分布对洪涝灾害危险性的影响,以及耕地面积百分比、人口密度、GDP密度分布对洪涝灾害脆弱性的影响,初步构建了农业洪涝灾害危险性、脆弱性评价模型、等级评价指标和灾害风险评估模型,分8级进行全国农业洪涝灾害风险评估。结果显示,中国中东部地区以4级以上风险为主,西部地区以3级以下风险为主。8级以上洪涝灾害风险主要位于河南省东南部、淮北平原西部、江西鄱阳湖周边、湖南洞庭湖周边、江汉平原、安徽沿江平原、江苏中部及沿江地区、浙江东北部、四川盆地西侧、广东沿海和珠江三角洲地区、广西沿海和中部、海南岛中北部沿海地区等。(霍治国)
2.4 主要农作物病虫害对气候变化的响应
针对全国农作物病虫害、病害、虫害以及小麦病虫害、小麦白粉病,研究并揭示了气候变化导致的全年及作物全生育期的光、温、水等气象因子变化对不同病虫害的影响关系。如冬小麦全生育期平均温度为10.2 °C,且以0.46 °C/10a的速率升高;平均温度每升高1 °C,可使冬小麦白粉病发生面积增加255.3万hm2。平均降水强度为5.6 mm/d,且以0.18 mm/(d 10a)的速率增加;平均降水强度每增加1 mm/d,将使冬小麦白粉病发生面积增加270.8万hm2。平均日照时数为1139.3 h,且以9.90 h/10a的速率减少;平均日照时数每减少100 h,将使冬小麦白粉病发生面积增加269.0万hm2。在气候变化导致的小麦全生育期温度、降水、日照因子变化中,温度增加对冬小麦白粉病发生面积增加的影响最为显著,其次为日照时数减少,再次为平均降水强度增大。(霍治国)
2.5 基于作物生长模型的淮河流域玉米旱涝损失评估
利用玉米生长模型定义了生物量旱涝胁迫指数(TAGPI)、产量旱涝胁迫指数(WSOI)以及水分影响指数(RFWSI)。以WSOI指数为主要评价依据,其余为辅助评价指标,利用玉米生长模型模拟淮河流域多个站点48年的生物量旱涝胁迫指数、产量旱涝胁迫指数和水分影响指数,根据其概率分布确定了全生育期和不同生育阶段的旱涝指标。假定后期气象条件正常的情况下,利用模拟最终产量结合旱涝指标可以进行旱涝灾害损失的定量评估。利用不断更新的实时气象数据驱动作物生长模型,结合逐日旱涝指标,可以开展旱涝灾害损失的时间动态评估。(马玉平)
2.6 全国农业台风和暴雨灾害综合风险评估
针对全国农业台风、暴雨灾害综合风险评估,以降水、大风、农业产值、农作物播种面积、耕地面积、高程、高程标准差、河网密度、距离水体的远近和植被覆盖度为指标,建立了全国农业台风灾害风险指数模型。以年暴雨日数、年暴雨累积量、年暴雨过程次数、年暴雨最大过程累积降水量、年极端降水日数、年极端降水累积量、年极端降水过程次数和年极端降水平均集中度为指标,建立了全国农业暴雨综合气候风险指数模型。根据风险叠加原理,建立了全国农业台风和暴雨综合灾害风险指数模型。利用自然断点分级法将风险指数划分为高风险、次高风险、中等风险、次低风险和低风险5个等级,基于GIS绘制了空间分辨率为5 km × 5 km风险区划图(图2)。(毛飞)
2.7 东北草原蝗虫气象监测预报与灾损评估技术
为研究东北草原亚洲飞蝗孵化进程与热量条件的关系,利用人工气候箱进行了平均气温、最低气温、积温对亚洲飞蝗越冬卵孵化影响的试验。结果表明,出蝻数、出蝻率、累积出蝻数、累积出蝻率均随日平均气温升高而增大。日最低气温连续3天稳定通过25 °C时,蝗虫开始孵化出蝻;在26 °C左右时孵化最快,低于25 °C时,蝗虫出蝻速率缓慢。25 °C以上有效积温达到11.6 °C d,活动积温达到211.6 °C d时,蝗卵开始孵化出土。当有效积温增加到20 °C d,活动积温达320 °Cd后,孵化速度回落,在达到另一个小高峰后孵化过程结束。(白月明)
3 农业应对气候变化研究
3.1 气候变化对东北地区热量资源及玉米温度适宜度的影响
利用RegCM3 模式输出的东北3省1951—2100年逐日温度资料,分析了东北3省热量资源和玉米不同生育期气温适宜度的时空分布。结果表明, 1951—2100 年东北地区热量资源显著增加,稳定通过10 °C初日不断提前,初日在4月25日之前的区域北界向东向北扩展;≥10 °C活动积温大于3000 °Cd的区域面积不断增加,适宜种植晚熟玉米的区域面积也不断增加; 1951—2100年玉米播种-出苗期以及出苗-抽雄期的气温适宜度随时间逐渐升高,1951—2040年辽宁省玉米抽雄-成熟期以及全生育期的气温适宜度较高,而黑龙江省较低;2041—2100年辽宁省玉米抽雄-成熟期以及全生育期的气温适宜度逐渐降低,吉林省东部和黑龙江省呈逐渐增加的趋势。(郭建平)
3.2 基于实际生育期的东北地区玉米气候生产潜力研究
利用1981—2006年东北3省30个农业气象观测站玉米生育期资料和1961—2006年70个气象台站的气象资料,统计分析了东北3省玉米主要发育期的变化特点,研究了东北地区玉米实际生长期间的气候生产潜力的变化特征。结果表明,东北地区玉米光合生产潜力、光温生产潜力均呈现由西向东、由北向南递减的趋势,而气候生产潜力呈现由西南向东北逐渐递减的趋势。46年来,东北地区光合生产潜力、气候生产潜力呈逐年减少的趋势,而光温生产潜力辽宁、吉林呈现逐年减少的趋势,黑龙江呈现增加趋势。从年代际来看,20世纪60年代最高,进入90年代后显著减少,2001年后进入气候生产潜力的最小时期。(郭建平)
3.3 中国北方春小麦种植区气候适宜性分布
以Maxent模型为基础,利用春小麦种植空间分布数据和1961—2008年全国560个台站日值气象观测数据的≥0 °C积温、≥0 °C持续日数、年降水量、1月平均气温、≥3 °C积温、≥3 °C持续日数、≥3 °C蒸散发量、≥3 °C总辐射等8个春小麦空间分布环境数据,模拟了中国北方春小麦气候适宜性分布区域,气候适宜性分布区域概率达到50% ~80%。与当前北方春小麦种植区域对比发现,具有较高的一致性(图3)。(俄有浩)
3.4 气候变化背景下黄淮海地区冬小麦干热风演变趋势
基于黄淮海地区52个气象站50年(1961—2010年)5月11日至6月10日逐日最高气温、14∶00空气相对湿度和风速资料,利用气候趋势和相似性分析方法分析了黄淮海地区冬小麦生长后期干热风的发生趋势。结果表明,黄淮海大部分地区平均日最高气温呈现下降趋势,与气候总体变暖的趋势相反;14∶00空气相对湿度呈升高趋势,也与大气总体变干的趋势相反;14∶00风速呈现减小趋势,与北方地区植树造林有较大关系,从而使得单一要素达到干热风标准的日数呈减少趋势。说明黄淮海地区出现各级干热风的日数有减少趋势。(郭建平)
3.5 锦州玉米和盘锦水稻农田生态系统碳水平衡研究
对辽宁省锦州玉米和盘锦水稻农田生态系统中碳水平衡的研究表明,玉米和水稻田年CO2净交换量(NEE)分别为280 gC/m2和195 gC/m2,二者均是大气CO2的汇;生态系统碳固定的同时,玉米和水稻田生态系统的年蒸散量(ET)分别为407 mm和660 mm。以生态系统总初级生产力(GPP)与ET的比值(生态系统通过光合作用吸收固定单位CO2所消耗水量)来衡量生态系统水分利用效率(WUE),玉米、水稻田生态系统WUE分别为11.3 g/kg和4.4 g/kg。玉米、水稻田生态系统总初级生产力的季节变化与温度密切相关,且玉米田生态系统总初级生产力高于水稻田;由于两类农田GPP和ET季节变化趋势的差异,玉米田生态系统WUE在玉米出苗后呈上升趋势,直至玉米成熟期达到峰值后下降,水稻田生态系统WUE的峰值则出现在营养和生殖生长并进阶段,比玉米田生态系统WUE峰值出现早(图4)。(周莉)
4 农业气象科技成果推广应用
4.1 西北气候脆弱地区农业干旱及农田灌溉预报技术推广应用
以陕西、甘肃、宁夏农业干旱为研究对象,建立了气象和土壤数据库,改进了作物干旱模式,并与分布式水文模式相结合,基于GIS技术研发了“西北农业干旱及农田灌溉预报系统”,实现了西北农业干旱、农田灌溉预报及服务产品的制作功能。对西北地区气象业务服务人员进行了培训,并在西北省级气象业务部门进行了推广应用,制作发布服务产品100期以上,该项目推广受益面积超过6.67万hm2,农业干旱预报准确率总体达80%以上,取得了较好的社会和经济效益。(刘建栋)
4.2 东北地区玉米低温冷害动态监测预警技术推广应用
在“十一五”科技支撑计划课题研究成果的基础上,对东北地区玉米区域分布进行了进一步细分,补充和利用最新的资料对低温冷害预警模式参数进行重新计算,完善了原有模式。通过模式的完善已基本完成了区域和分省低温冷害监测预警业务系统的研发。2012年东北3省共发布各类服务产品10多期,取得了较好的效果。(郭建平)
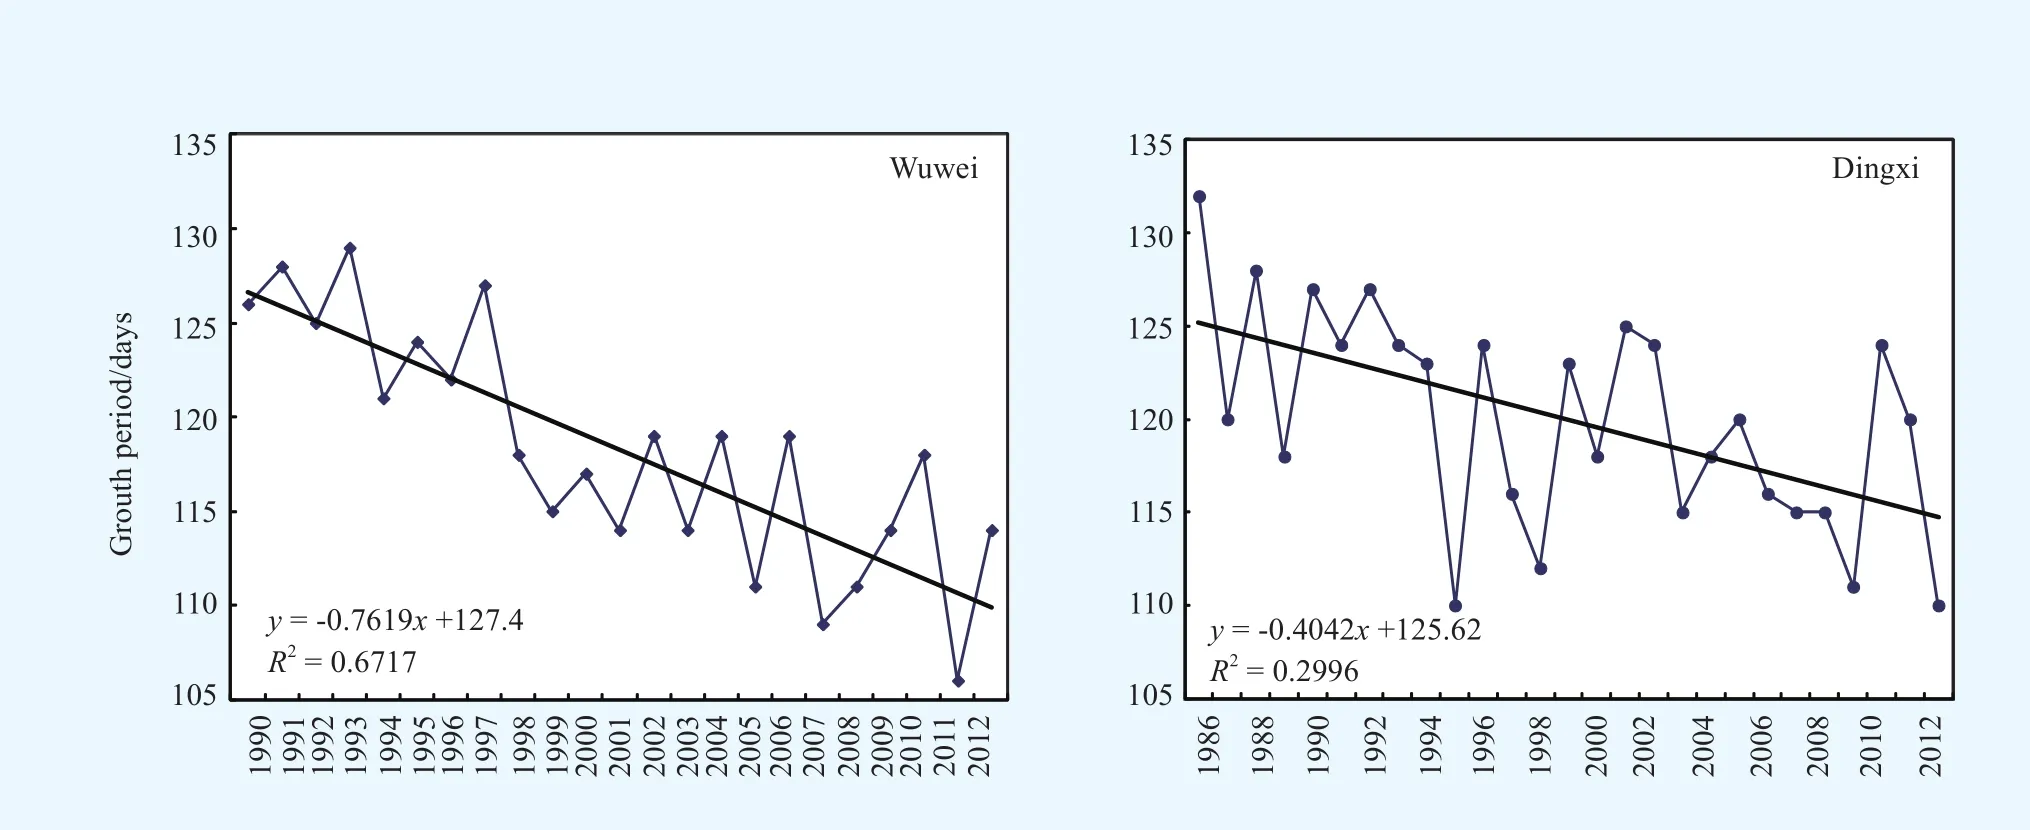
图1 武威和定西农试站春小麦发育期变化及趋势Fig1 The variability and change trend of spring-wheat growth period
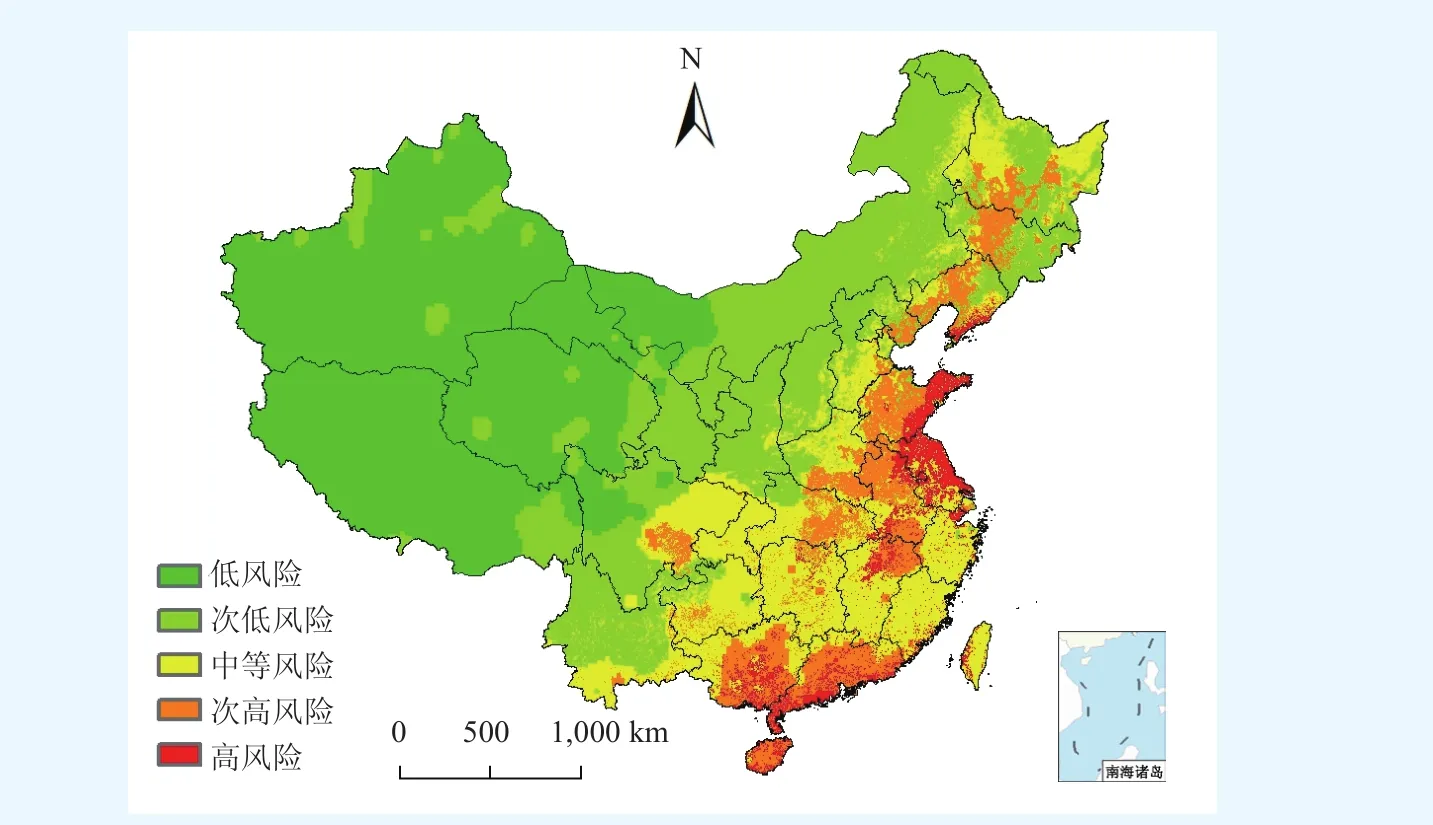
图2 全国农业台风和暴雨灾害综合风险区划Fig2 Agricultural typhoon and rainstorm disaster comprehensive risk regionalization
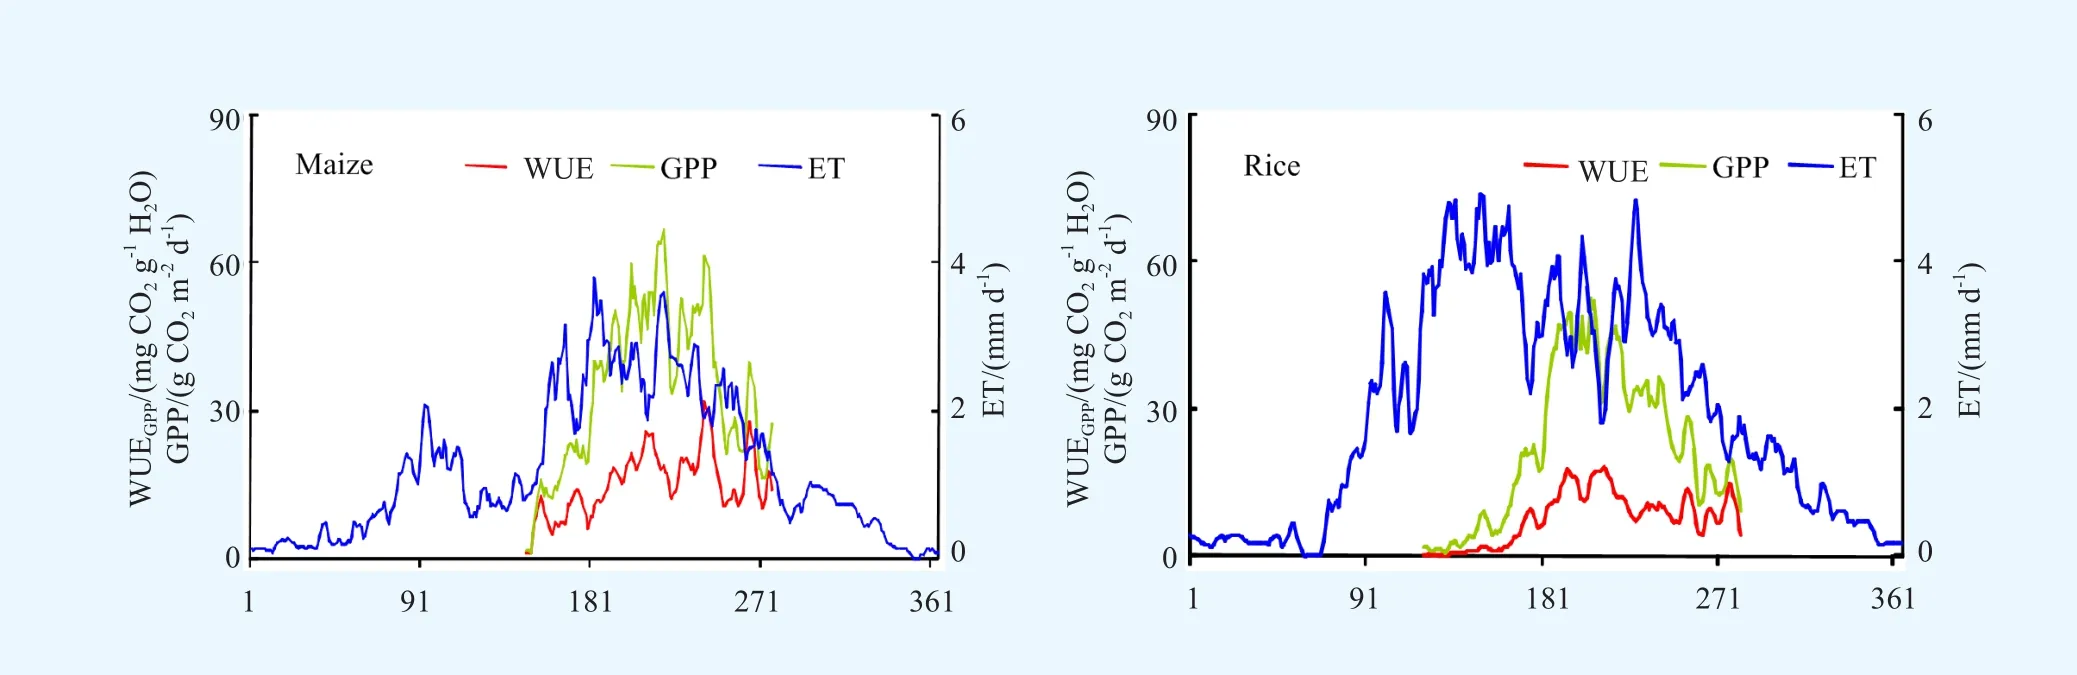
图4 东北农田生态系统碳水通量平衡关系Fig4 Carbon and water budget of agro-ecosystem in Northeast China
Progress in Ecology and Agrometeorology Research
In 2012, the Institute of Eco-environment and Agrometeorology of CAMS obtained signifcant research progress on agrometeorological theories and application techniques, agrometeorological disaster prevention and mitigation, and response of agriculture to climate change. Some results have been applied in real-time operations.
1 Agrometeorological theories and application techniques
1.1 Application of ensemble Kalman flter to Northeast China maize yield estimation from the PyWOFOST crop model
By coupling with an ensemble Kalman flter (EnKF), the coupled remote sensing information-crop model (PyWOFOST) with leaf area index (LAI) as the coupling point was used to estimate maize yield in Northeast China. The LAI simulation results show that the LAI values from the coupled model with EnKF assimilation are more consistent with the observations than that without assimilation. However, the maize yield simulation results show that there is still a large error in the crop yield compared with the observations when there occurs a severe disaster, although certain improvements have been brought up by the EnKF assimilation. The reasons for the error are being investigated. (Zhao Yanxia)
1.2 Simulation of the potential and rainfed yield of winter wheat in the North China Plain
A regional simulation system was developed. The system is suitable for simulation of winter wheat growth and potential and rainfed yield in the North China Plain (NCP). Data from 40 meteorological stations in the NCP were collected and used as input to the system to simulate the potential and rainfed yield of winter wheat in the period 2003—2007. The results show that potential yield of winter wheat is decreased from the central NCP to the north and south, with higher values in the north than the south, while rainfed yield has the reverse trends. This is because rainfall is the key factor that controls winter wheat rainfed yield in the NCP. Middle plain has the lowest rainfall, thus has the lowest rainfed yield. Rainfed yield is higher in the north than in the middle because north has both higher rainfall and higher potential yield, with the latter being the base of the rainfed yield. Rainfed yield is higher in the south than in the middle because south plain has the highest rainfall. The simulation results are consistent with the observation, showing that the simulation system is capable to simulate winter wheat growth in the NCP, and can be used in the next study. (Wu Dingrong)
1.3 Random errors of the radiosonde precipitable water over the Tibetan Plateau and associated calibration methods
The characteristics of the systematic and random errors of the radiosonde (RS) precipitable water (PW) data at Lhasa during 1999—2010 and at Naqu in 2003, were compared with ground-based GPS measurements. The results show that RS_PW was signifcantly smaller than GPS_PW at Lhasa. Different types of radiosonde humidity sensors showed different magnitudes of the dry bias of PW. Due to the introduction of the high performance humidity sensors (GST-1), the PW bias was apparently being reduced gradually over the past 10 years. The temporal variation characteristics of the RS_PW dry bias were also investigated. The results show that the RS_PW dry bias exhibited pronounced diurnal and annual variations. The dry bias of RS_PW was much larger at 12∶00 UCT than at 00∶00 UTC, and larger in summer than in winter. Additionally, the causes of diurnal and annual variations of the RS_PW dry bias were investigated. The solar radiative heating to the humidity sensors may have played an important role. It can be seen that the diurnal variation of RS_PW drybias was signifcant partly because air temperature was higher at 12∶00 UTC than at 00∶00 UTC. The annual variation of RS_PW dry bias was pronounced also partly because air temperature was higher in summer than in winter. The calibration methods for the RS_PW dry bias were developed and applied to the GZZ-2 and GTS-1 sounding PW datasets at Lhasa and Naqu. The corrections greatly improved the accuracy of the RS_PW data.(Liang Hong)
1.4 Construction of the Grid Crop Growth and Assess model (GCGA Maize)
Comparisons of the accumulated temperature, heat unit, and heat cumulation (THU) methods showed that both the variance and coeffcient of variation of THU were the smallest and its stability was the highest. A correction model that considers the impacts of temperature strength and soil moisture on the crop development process was firstly constructed. A photosynthesis model for summer maize was then constructed based on Farquhar’s photosynthesis biochemistry theory. The ftting effect of this photosynthesis model was better than the simple negative index model. The soil water movement model was established according to the equation of soil water movement and its numerical calculation methods. Compared with the soil water balance model, the soil water movement model was more stable. Moreover, the methods for estimating crop model parameters were discussed based on assimilation of observation data. The Grid Crop Growth and Assess model (GCGA Maize) was fnally set up on the basis of the above models and methods. (Ma Yuping)
1.5 Evaluation of summer maize growth in North China based on the crop growth model with assimilation of remote sensing data
Validation of the assimilation of observation data into the crop growth model was firstly carried out. The optimal and suitable parameters were then obtained based on both the sensitivity analysis of different parameters and initial values and the constraint analysis of sensitive parameters. Assimilation of remote sensing data into crop growth model was fnally achieved by using a derived optimization algorithm. The crop growth index was determined by comparing the dynamic accumulation of biomass simulated by the assimilation model in different years with the biomass under the average climatic conditions. Annual evaluation of maize growth at maturity was carried out based on the total above ground production simulated by the assimilation model. Dynamic evaluation of summer maize growth was then realized by using the assimilation model driven by daily meteorological data in real time. (Ma Yuping)
1.6 Relationship between temperature and spring-wheat growth period in Northwest China
Based on the observation data from Wuwei and Dingxi stations, which represent the irrigation and rainfed crop areas, respectively, the relationship of accumulated temperature and spring-wheat growth period was analyzed. The results show that spring-wheat growth period was reduced by 20 days during 1990—2011 at Wuwei station, and 13 days during 1986—2011 at Dingxi station, implying a signifcant decrease trend (P < 0.01, r = 0.827 for Wuwei and P < 0.05, r = 0.463 for Dingxi). The conclusion is that continuous increase in accumulated temperature occurring from seedling was the main cause of the decrease in the growth period (Fig1). (E Youhao)
1.7 A new hydrological model based on TOPMODEL and Xin'anjiang hydrological model
Considering the shortcomings that TOPMODEL model simulated ground water dynamic changes deviate from the actual situation, i.e., the average ground water level is even above the ground, and Xin'anjiang model can not express the dynamic change of underground water level, we have developed a new model of rainfall-runoff XXT. XXT has an important feature that the soil water storage capacity curve is closely related to ground water level, forming the new concept of water storage capacity curve. Then, XXT was further refned by taking advantage of the TOPMODEL layered soil and underground runoff equations. After rigorous mathematical deduction, new runoff production and water balance equations were obtained. Finally, new rainfall-runoff model XXT was set up, with the frst X representing the Xin'anjiang, the second X the “hybrid”symbol in the agriculture, and T the TOPMODEL. XXT is mainly made up of four modules, namely, the data processing module, the visualization module of spatial distribution of soil moisture, the runoff module, and theconfux module. (Zhao Junfang)
1.8 A temperature-precipitation based leafng model
By analyzing the effects of precipitation in different periods on plant leafng, a precipitation-based submodel was firstly established. Then, a universal temperature-precipitation based leafing model (TP) was developed, combined with the accumulated temperature model. The TP has been proved to be more suitable for simulating leafng of all the plant species in Northeast China than the prior models, with the simulation error less than 4 days. Furthermore, the results indicate that the TP has quantitatively examined the responses of plant leafng to interactive hydrothermic factors and played critical roles in accurately evaluating ecosystem productivity and carbon budget. (Zhou Guangsheng)
1.9 Light use effciency over two temperate steppes
Combining eddy covariance fux data with the fraction of photosynthetically active radiation absorbed by the plant canopy from MODIS, we report the seasonal and interannual variations of light use effciency (LUE) on a typical steppe and a desert steppe in Inner Mongolia, northern China. The results show that both annual average LUE and maximum LUE were higher on the desert steppe than on the typical steppe, despite the higher GPP of the latter. Water availability was the primary limiting factor of LUE at both sites; however, the sensitivity of LUE to water condition differed signifcantly between the two sites. LUE increased with the diffuse radiation ratio on the typical steppe; however, such a trend was not found for the desert steppe.(Zhou Guangsheng)
2 Agrometeorological disaster prevention and mitigation
2.1 Constructing dry hot wind damage evaluation model at different grades
Based on the meteorological data, the developmental period, yield, dry hot wind disasters data of wheat in the Huanghuaihai area, and the recognized indicators of winter wheat dry hot wind disasters, the different grades of dry hot wind hazard index were calculated. Then, the dry hot wind damage evaluation model was constructed at different levels. Preliminary conclusions are as follows. The average hazard index of dry hot wind during different developmental periods of winter wheat is different. Under the light dry hot wind hazard, the average hazard index of dry hot wind is the biggest from tasseling to fowering, smaller from fowering to milking, and least from milking to riping. Under the severe dry hot wind hazard, the average hazard index of dry hot wind is the biggest from milking to riping, smaller from tasseling to fowering, and least from fowering to milking. In addition, based on the built dry hot wind damage evaluation model, the reduction of wheat yield caused by dry hot wind hazard is calculated. The results show that average reduction of wheat yield caused by severe dry hot wind hazard is about 26.1%. (Zhao Yanxia)
2.2 Establishment of the conceptual model and index system for static and dynamic risk assessment
of agro-drought disasters
Agro-drought disaster risk can be attributed to the complexity of multi-factors, including climatic conditions, soil properties, geomorphic type, groundwater status, water requirement of specific crop, and anthropogenic infuences such as the management level of drought disaster, regional capacity of mitigation, prevention to drought disaster, etc. Thereby, a conceptual framework of agro-drought disaster risk was raised in view of agro-drought disaster embryology and the formation mechanism of agro-drought disaster risk. Based on the conceptual model, the indicator system for agro-drought disaster was established and maize grown over the northwestern Liaoning Province was taken as a case study. (Wang Chunyi)
2.3 Analysis and assessment of agricultural food risk in China
Considering the effect of the distribution of precipitation, terrain, rivers, and lakes on food hazard, aswell as the effect of the distribution of arable land percentage, population density, GDP density on flood vulnerability, assessment model of food hazard and vulnerability, level assessment index and risk assessment model were constructed. The index was divided into 8 levels to assess agricultural food risk, based on daily precipitation data, terrain data, basic geographic data, km-grid land use data, km-grid population data, kmgrid GDP data, etc. The results show that the levels of food risk are above 4 in east-central China and below 3 in western China. The food risk of level 8 is mainly located in southeastern Henan, west of Huaibei Plain, areas around Poyang Lake and Dongting Lake, Jianghan Plain, areas along the Yangtze River in Anhui and Jiangsu provinces, central Jiangsu Province, northeastern Zhejiang, west of Sichuan Basin, coastal areas of Guangdong, Pearl River Delta, coastal and central areas of Guangxi Province, northern and central areas of Hainan Province, and coastal areas of Hainan Province. (Huo Zhiguo)
2.4 Effect of climate change on pests and diseases of major crops
The effect of changes of the meteorological factors and crop growth period induced by climate change including sunshine, temperature, precipitation, and so on, on pests and diseases was revealed, in the studies of national crop pests and diseases, pests, diseases, wheat pests and diseases, and powdery mildew. It is found that average temperature is 10.2 °C in the growth period of winter wheat, increasing at the rate of 0.46 °C/10 yr. Powdery mildew occurrence area will increase by 255.3×10⁴hm2when average temperature increases by 1 °C. Average precipitation intensity is 5.6 mm/day, increasing at the rate of 0.18 mm/day per decade. Powdery mildew occurrence area will increase by 270.8×10⁴hm2when average precipitation intensity increases by mm/day. Average sunshine hours are 1139.3 h, decreasing at the rate of 9.9 h per decade. Powdery mildew occurrence area will increase by 269.0×10⁴hm2when average sunshine hour decreases by 100 h. Among the changes of temperature, precipitation and sunshine, the increase of average temperature has the greatest impact on the occurrence of crop diseases, followed by the decrease of sunshine hours and the increase of average precipitation intensity. (Huo Zhiguo)
2.5 Seamless assessment methods of loss from droughts and foods for maize in the Huaihe River Basin based on the crop growth model
The production of drought and food stress index (WSOI), which was the main basis of evaluation, the biomass drought and food stress index (TAGPI), and the water impact index (RFWSI) were defned based on maize growth model. WSOI, TAGPI, and RFWSI were frstly simulated by the maize growth model for 48 years at different stations in the Huaihe River Basin. The thresholds of droughts and foods stress index at different development stages and during the whole growing period were then determined according to probability distribution of the simulation results. Quantitative assessment of losses caused by droughts and floods can be achieved through the combination of simulated final biomass and droughts and floods stress index if the weather conditions are normal. The dynamic assessment of losses can be carried out by means of using the maize growth model driven by daily meteorological data in real time. (Ma Yuping)
2.6 Agricultural typhoon and rainstorm disaster comprehensive risk assessment in China
For the national agricultural typhoon and rainstorm disaster comprehensive risk assessment, the agricultural typhoon disaster risk index models in China were established with the indexes of precipitation, wind, agricultural output value, sown area of crops, cultivated area, elevation, standard deviation of elevation, river density, distance to water and vegetation coverage. The agricultural rainstorm comprehensive climate risk index models in China were also established with the indexes of annual rainstorm days, annual rainstorm accumulation, annual rainstorm process times, accumulated precipitation of the largest annual rainstorm process, annual extreme precipitation days, annual extreme precipitation accumulation, annual extreme precipitation process times and average concentration of annual extreme precipitation. According to the risk superposition principle, the risk index model of agricultural typhoon and rainstorm integrated disaster in China was established. Using natural breaks classifcation, the risk index was divided into 5 classifcations, i.e., highrisk, second high risk, medium risk, second low risk, and low risk. The comprehensive risk zoning map in China was drawn with a spatial resolution of 5 km × 5 km based on GIS (Fig2). (Mao Fei)
2.7 Monitoring, forecasting and loss assessment of Asiatic Migratory Locust in northeast grassland
In order to clarify the relationship of Asiatic Migratory Locust hatching process and heat conditions in northeast grassland, this experiment was conducted in an artificial climate box to study the influence of temperature and effective accumulated temperature on the Asiatic Migratory Locust hatching of the overwintering. The results show that, the hoppers, the rate of hoppers, the accumulation hoppers, and the rate of accumulation hoppers increased with increasing temperature. The locust nymphae began to sprout with the daily minimum temperature stabilizing at 25 °C for 3 days. As the day of temperature increasing, the speed of hatching increased continuously; at about 26 °C, the hatching occurred at the fastest speed. If daily minimum temperature was below 25 °C, the rate of locust hoppers became slow. When effective accumulated temperature reached 11.6 °C·day, the active accumulated temperature reached 211.6 °C·day, locust egg began to hatch. When effective accumulated temperature increased to 20 °C·day and the active accumulated temperature exceeded 320 °C·day, the incubation speed slowed down, then reached the second small peak, and then the incubation process was over. (Bai Yueming)
3 Response of agriculture to climate change
3.1 Impact of climate change on the heat resources and corn suitability in Northeast China
Based on the daily temperature data from RegCM3 model output (1951—2100), the spatial and temporal distributions of heat resources and corn suitability during the different growth stages in Northeast China were analyzed. The results show that∶ from 1951 to 2100, the heat resources in Northeast China signifcantly increase. The initial days passing stably the daily average temperature of 10 °C are also signifcantly prolonged, extending eastward and northward before 25 April. The areas with10 °C active accumulated temperature greater than 3000 °C·day continue to increase. The suitable areas for planting late-maturing corn are also expanding. The temperature suitability of corn during sowing-emergence and emergence-tasseling gradually increases. From 1951 to 2040, the temperature suitability of corn during tasseling-mature and whole growth period is high in Liaoning Province but low in Heilongjiang Province. From 2041 to 2100, the temperature suitability of corn during tasseling-mature and whole growth period is low in Liaoning Province but high in eastern Jilin and Heilongjiang provinces. (Guo Jianping)
3.2 Evaluation of climate potential productivity of corn based on actual growth period in Northeast China
Based on the corn growing data from 30 agro-meteorological observation stations during 1981—2006 and the meteorological data from 70 meteorological stations during 1961—2006 in Northeast China, the characteristics of climate potential productivity of corn were assessed. The photosynthetic production potential and the light and temperature production potential of corn were gradually reducing from west to east and from north to south. However, the climate production potential presented a progressively decreasing trend from southwest to northeast. In the past 46 years, the photosynthetic production potential and the climate production potential in Northeast China showed decreasing trends. In particular, the production potentials of light and temperature in Liaoning and Jilin provinces presented a decreasing trend, while they were increasing in Heilongjiang Province. From decadal perspective, the climate production potential was the highest in the 1960s, signifcantly reduced in the 1990s, and the minimum occurred after 2001. (Guo Jianping)
3.3 Simulated suitability distribution of spring wheat in Northwest China
Based on the Maxent model, the distribution of spring wheat and the weather data, including0 °C accumulated temperature,0 °C interval days, annual rainfall, annual average temperature,3 °C accumulated temperature,3 °Cinterval days,3 °C evapotranspiration,3 °C radiation, were used to simulate the suitability distribution of the spring wheat in Northwest China. The simulation results show that the probability of suitability distribution area is 50%-80%, indicating a better match with current plant area in Northwest China (Fig3). (E Youhao)
3.4 Changes of dry hot wind of winter wheat in Huanghuaihai area under climate change
Based on daily maximum temperature, air relative humidity and wind speed at 14∶00 local time from 52 meteorological stations from 1961 to 2010 in the Huanghuaihai area, combined with climate trends and similarity analysis method, the trend of dry hot wind of winter wheat during the late growth stage was systematically analyzed. From 1961 to 2010, the average daily maximum temperature in most of the Huanghuaihai area showed a downward trend, contrary to the climate warming. The air relative humidity at 14∶00 tended to increase, which was opposite to general atmospheric drying. The wind speed at 14∶00 showed a decreasing trend, which was related to afforestation in the northern part of the area. It is diffcult for a single factor to meet the dry hot wind standard. Thereby, the decreasing trends of dry hot wind of winter wheat in the Huanghuaihai area at different levels were obvious. (Guo Jianping)
3.5 Carbon and water budget of agro-ecosystem in Northeast China
During the study period, both maize and paddy rice in Northeast China behaved as potential CO2sink, and the annual net uptake of CO2were 280 gC/m2and 195 gC/m2respectively. Seasonal variations in gross primary production (GPP) for these two ecosystems were associated with temperature, and the maize ecosystem had a higher value of GPP than the paddy rice. Annual evapotranspiration was 407 mm for maize, and 660 mm for paddy rice. Ecosystem water use effciency (WUE = GPP/ET) of maize (11.3 g CO2/kg H2O) was higher than that of paddy rice (4.4 g CO2/kg H2O). WUE seasonal pattern of maize differed from that of paddy rice, as the maximum WUE appeared earlier in paddy rice than in maize (Fig4). (Zhou Li)
4 Research application
4.1 Application of the prediction technology for agro-drought and irrigation in the climatic vulnerable regions of Northwest China
A prediction system for agro-drought and irrigation in Northwest China (including Shanxi, Gansu and Ningxia provinces) was established to provide detailed information for farmers and the government. Service products such as agro-drought and optimum irrigation were made available by the system, supported by soil and meteorological data and a revised crop-drought model coupled with a distributed hydrological module. More than 100 periodical issues on agro-drought information were released shared, and the software training was conducted on the provincial scale in Northwest China. The objectives of the project have been fullfled, with over 66666.7 hm2crop areas being benefted from the prediction information at the accuracy level of 80% and above. (Liu Jiandong)
4.2 Application of the dynamic monitoring and warning technology of maize chilling in Northeast China
On the basis of the results from the Key Projects in the National Science & Technology Pillar Program during the 11th Five-Year Plan Period, the regional distributions of corn in Northeast China were further subdivided. After supplementing the latest data, the parameters of cold damage warning model were recalculated, and the original warning model was improved. Then, the monitoring and early warning system of chilling damage at regional and provincial levels was completed. In 2012, a total of over 10 service booklet were issued in the three northeastern provinces, achieving good results. (Guo Jianping)
猜你喜欢
今日农业(2022年1期)2022-11-16
今日农业(2022年3期)2022-11-16
今日农业(2022年2期)2022-11-16
干旱区研究(2022年1期)2022-02-11
少儿科学周刊·儿童版(2021年21期)2021-12-11
今日农业(2021年14期)2021-11-25
江西农业学报(2020年4期)2020-05-07
小天使·二年级语数英综合(2019年10期)2019-11-08
江西农业学报(2019年1期)2019-01-25
河南农业(2018年9期)2018-01-17