Actor-Critic-Based UAV-Assisted Data Collection in the Wireless Sensor Network
Huang Xiaoge,Wang Lingzhi,He Yong,Chen Qianbin
School of Communications and Information Engineering,Chongqing University of Posts and Telecommunications,Chongqing 400065,China
Abstract: Wireless Sensor Network(WSN)is widely utilized in large-scale distributed unmanned detection scenarios due to its low cost and flexible installation.However,WSN data collection encounters challenges in scenarios lacking communication infrastructure.Unmanned aerial vehicle (UAV) offers a novel solution for WSN data collection,leveraging their high mobility.In this paper,we present an effciient UAV-assisted data collection algorithm aimed at minimizing the overall power consumption of the WSN.Firstly,a two-layer UAV-assisted data collection model is introduced,including the ground and aerial layers.The ground layer senses the environmental data by the cluster members (CMs),and the CMs transmit the data to the cluster heads (CHs),which forward the collected data to the UAVs.The aerial network layer consists of multiple UAVs that collect,store,and forward data from the CHs to the data center for analysis.Secondly,an improved clustering algorithm based on K-Means++is proposed to optimize the number and locations of CHs.Moreover,an Actor-Critic based algorithm is introduced to optimize the UAV deployment and the association with CHs.Finally,simulation results verify the effectiveness of the proposed algorithms.
Keywords: actor critic;data collection;deep reinforcement learning;unmanned aerial vehicle;wireless sensor network
I.INTRODUCTION
Due to the continuous development of the Internet of Things(IoT)technology,formed a huge,highly intelligent network.Wireless Sensor Network (WSN) is a distributed sensing network composed of small embedded sensors that form a multi-hop self-organizing network,which supports real-time sensing,and data collection in the coverage area,and transmits the fnial results to the data center[1].
In recent years,WSN has become increasingly common in large-scale distributed monitoring scenarios[2],including disaster,environmental,and infrastructure monitoring [3],due to its advantages of location specifciity,target specifciity,and high spatial resolution[4].Nevertheless,WSN data collection faces the challenges of limited power consumption and network coverage.Unmanned aerial vehicle(UAV)is suitable as data collectors due to their high mobility,flexibility,line of sight transmission link,and low cost [5-9].Its combination with WSN helps to collect data in a timely and effciient manner,especially in complex,harsh,or remote environments[10-12].
Although UAVs can provide effective solutions for WSN scenarios,the optimization problems associated with joint UAV trajectories and deployments are usually non-convex and,in many cases,prove to be Nondeterministic Polynomial Hard (NP-hard) [13-15].Compared with traditional algorithms deep reinforcement learning (DRL) exhibits superior performance in terms of consumed energy of SNs,and fairness among loads of UAVs[16].Therefore,DRL has been considered in many existing works to obtain solutions in the UAV-assisted WSN.
In[17],the authors proposed an intelligent resource allocation algorithm based on reinforcement learning(RL) which minimized the UAV resource consumption while ensuring the quality of service for mobile users.A multi-agent RL approach was introduced in [18] to solve the path planning problem of UAVs to maximize the data collection from distributed IoT sensors.In [19],a deep deterministic policy gradient (DDPG) approach was used to derive the optimal trajectory of UAVs in the obstacle-constrained region while monitoring the sensor transmit power during the data collection process.The work presented in [20]considered UAVs as aerial base stations to optimize controlled wireless connectivity to mobile users due to a hybrid DRL with centralized training and distributed testing.In [21],the author proposed a resource allocation algorithm in UAV networks based on cooperative environmental learning of multiple agents which improves the utility of the UAV network.In[22],a DDPG based algorithm was proposed which jointly optimizes 3D deployment and power allocation of UAVs to maximize the system throughput when the UAVs are considered as aerial base stations.
Nevertheless,few works jointly optimize the sensors clustering,UAV deployment,and UAV load balancing for effciient data collection and minimize the total transmit power of the WSN.Motivated by the above aspects,in this paper,we proposed an Actor-Critic based UAV-assisted data collection (AC-UDC)algorithm to minimize the total WSN transmit power by jointly optimizing the clustering of Sensor nodes(SNs),UAVs deployment,and association of UAVs with cluster heads (CHs) under various constraints.The main contributions of this paper are summarized as follows
• Firstly,a two-layer data collection model for UAVs-assisted WSN is presented,including the ground and aerial layers.The ground network layer,contains WSN,charging station,and DC.Cluster members(CMs)are responsible for sensing data and sending them to CHs,which aggregate and upload data to UAVs.The aerial network layer,consisting of multiple UAVs,is responsible for collecting,storing,and forwarding the data uploaded by CHs.In addition,the charging station and DC are responsible for energy charging and data analysis.
• Secondly,a transmit power optimization problem is formulated to reduce the total system transmit power via the optimization of the number and locations of CHs,UAVs deployment,and the association between UAVs and CHs.The original problem is a Mixed Integer Nonlinear Programming(MINP)problem,which is transformed into three subproblems: sensor clustering optimization,UAVs and CHs association optimization,and UAVs deployment optimization,which could be solved separately.
• Thirdly,an improved K-means++based clustering (IKC) algorithm is proposed to optimize the number and locations of CHs under the constraint of the maximum transmit power of the WSN.Then,based on the optimal clustering,an Actor-Critic-based UAV deployment(AC-UD)algorithm is introduced to optimize the UAV deployment and the UAV-CHs association simultaneously,which determines the association of CHs and UAVs by the power difference based CHUAV association(PD-A)algorithm.
The rest of this paper is organized as follows.Section II presents the system model for UAV-assisted data collection in WSNs.Section III presents the ACUADC algorithm.Section IV discusses the simulation results.Finally,we conclude the paper in Section V.
II.SYSTEM MODEL AND PROBLEM FORMULATION
2.1 System Model
Our study proposed a UAV-assisted WSN data collection system,as illustrated in Figure 1.It is envisaged that the system will address the issue of limited data availability for the DC,due to the absence of cellular coverage and complex SNs deployments,and limited energy resources in remote area WSN deployments.The deployment of UAVs offers numerous advantages,including low costs,high mobility,and ease of deployment.The DC can effectively cover the area of interest by scheduling the UAVs to collect,store,and forward the data uploaded by the SNs.The model consists of two layers: the upper layer comprises multiple UAVs that fly to designated positions,hover,and collect data uploaded by associated CHs.On the other hand,the lower layer includes the WSN,charging station,and DC.

Figure 1.UAVs-assisted data collection in WSNs.
A three-dimensional UAV-assisted WSN is shown in Figure 1,with thexandyaxes placed on the ground and thezaxis in the air.The region Λ is divided intoKclusters,resulting inKCHs,denoted asK={1,2,...,K}.In addition,there areNCMs in the region,denoted asN={1,2,...,N}.MUAVs with the same altitude are deployed in the region to collect data.The three-dimensional Cartesian coordinates of CHk,CMnand UAVmare represented aslk=(xk,yk,0),lm=(xm,ym,h) andln=(xn,yn,0).
In the scenario,SNs are divided into clusters for effciient data collection.To ensure communication quality,the distance between SNs in one cluster should be within the maximum communication distance.Additionally,in each cluster,one SN is chosen as the CH while the other SNs function as CMs.The CHs are responsible for collecting,flitering,and aggregating data transmitted from CMs in the cluster,and then uploading data to the associated UAVs.Meanwhile,CMs are responsible for sensing data and relaying the information to the CHs through a single-hop approach.The charging station is deployed neighboring the data center,and UAVs forward the data from CHs to the DC by wireless links when they return to the charging station.The DC is responsible for clustering SNs,recording the locations of all SNs and the association between CHs and CMs,and deploying UAVs for data collection.Moreover,the data collected by the UAVs will be aggregated and analyzed at the DC to perform real-time monitoring functions,such as environment monitoring and disaster warning for the target area.
2.2 Communication Model
In the system,there is ground communication between CMs and CHs,and Ground to Air(G2A)communication links between CHs and UAVs.The average path loss of LoS and NLoS links between UAVmand CHkis given by
whereηLoSandηNLoSrepresent the average additional losses for LoS and NLoS links,respectively.aandbcorrespond to the S-curve,His the UAV flight altitude,andfis the carrier frequency.Dm,krefers to the distance between CHkand the vertical projection of UAVmon the ground.On the other hand,cis the speed of light anddm,kdenotes the linear distance from CHkto UAVm.The expressions forDm,kanddm,kare given by
Then,the transmit power from CHkto UAVmis given by
whereδm,kis the association coeffciient of CHkto UAVmtaking values of 0 and 1,δm,k=1 when CHkis associated with UAVm,is the received power of UAVm,andPLm,kis the average path loss.The association relationship of CHs to UAVs is expressed byK×Mmatrix Ω,given as
Themth column represents the association of UAVmto all CHs.Besides,based on the wireless communications channel model,in the ground communication,the transmit power from CMnto CHkis expressed as
whereϑn,kis the association coeffciient of CMnto CHktaking values of 0 and 1,ϑn,k=1 when CMnis associated with CHk,is the received power of CHk,dn,kdenotes the distance between CMnand CHk;Lis the propagated system loss factor(L ≥1);GtandGrdenote the gain of CM transmitting and receiving antennas,respectively;andλis the wavelength.The association of all CMs with CH is represented as anN×Kmatrix Γ.Thekth column indicates the association of CHkto all CMs,and the matrix Υ is denoted by
2.3 Problem Formulation
To minimize the total transmit power of the WSN,we jointly optimized the number and location of CHs,the locations of UAVs,and the association of UAVs with CHs under various constraints.Therefore,the optimization problem is modeled as
constraint C1 indicates that the correlation coeffciients between CMs and CHs are binary variables;C2 ensures that each CH can only be associated with one UAV;C3 ensures that each CM can only be associated with one CH.C4 and C5 respectively limit the maximum transmit power of CHs and CMs.Lastly,C6 specifeis that the deployment locations of all UAVs and CHs are confnied to the target area.
Since the correlation matrices Ω and Υ and the number of CHs are discrete variables,the deployments of UAVs and the locations of CHs are continuous variables,and the two cumulative terms in the optimization objective function become coupled,thus the optimization problem is a MINP problem with high solution complexity.
III.ACTOR-CRITIC BASED UAVASSISTED DATA COLLECTION ALGORITHM
In this section,to reduce the complexity of the algorithm,the original optimization problem is broken into three sub-optimization problems: sensor clustering optimization,UAVs deployment optimization,CHs-UAVs association optimization,and solved separately.Firstly,the IKC algorithm is proposed to optimize the number and location of CHs under the constraint of the maximum transmit power of CMs.Secondly,based on the optimal clustering,the UAVs deployment optimization is modeled as a Markov Decision Process (MDP),which is solved by the AC-UD algorithm.Finally,based on the UAV positions from the MDP process,the CHs-UAVs association is obtained by the PD-A algorithm.
3.1 Improved K-Means++Based Clustering Algorithm
To minimize the transmit power of CMs,we should optimize the locations of CHs,and the association matrix Υ between CMs and CHs.Therefore,the clustering optimization problem is formulated as
From the optimization problemP1,it is apparent that the transmit powerof CMs is primarily dependent on the distancedn,kbetween the CHkand CMn.Generally,the traditional distance based K-means clustering algorithm could minimize the mean distance between all members within a cluster and the cluster center,resulting in the optimal clustering outcome.
However,the K-means clustering algorithm encounters two issues: (1) The algorithm requires advanced knowledge of the number of clusters;(2) The initial center location of the cluster is randomly generated,which would lead to a slow convergence of the algorithm.
In this section,we explored the elbow method to address the problem(1).The elbow method mainly fnids the best number of clusters by evaluating the Sum of Squared Errors(SSE)of the clustering results,and the SSE is calculated by Eq.(10).As the number of clustersKincreases,whenKis less than the optimal number of clustersK*,the SSE decreases quickly,and when the value ofKexceedsK*,the SSE decreases slowly.Consequently,the relationship between SSE andKresembles an elbow and the optimal number of clusters occurring at the elbow point.As illustrated in Figure 2,the optimal cluster number is 4.
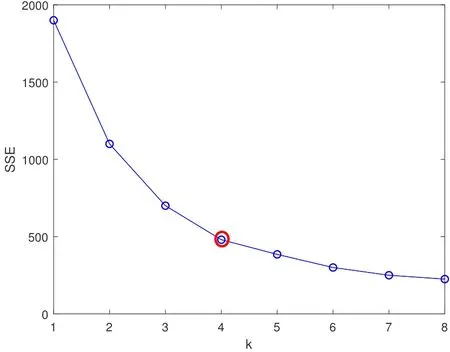
Figure 2.Clustering number K value versus SSE of elbow method.
whereCkdenotes the clusterk;pdenotes a member inCk;andmkdenotes the center ofCk.
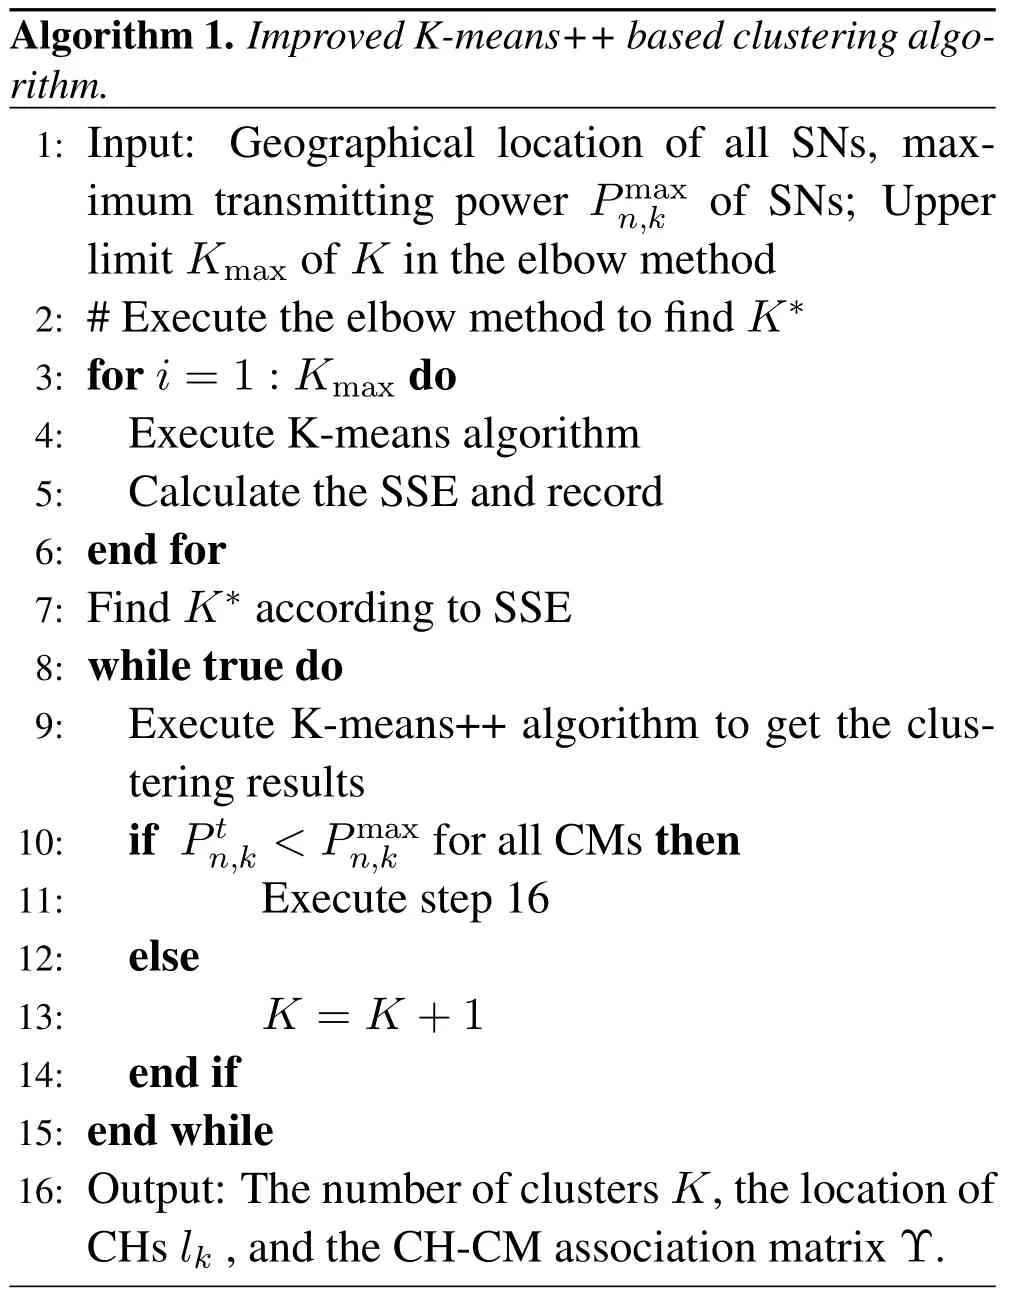
Additionally,the K-means++algorithm is used to solve the problem (2),however,the algorithm does not consider the transmit power constraint in application scenarios,and the distance between CMs at the cluster edge and the CH could be larger than the maximum communication distance.Particularly,in the elbow method,when k reaches the optimal number of clusters,increasing k slightly affects clustering.In this paper,we propose an improved K-means++clustering algorithm,which combines the elbow method with the K-means++clustering method under the maximum transmit power constraint to fnid the optimal number and location of CHs,as well as the CHs-CMs associations.The computation complexity of the IKC algorithm isO(KmaxXN),whereNandKmaxrepresent the number of CMs and the maximum number of clusters respectively,andXrepresents the number of while loops.The details of the improved K-means++clustering algorithm are shown in Algorithm 1.
3.2 Actor-Critic Based UAV Deployment and CH-UAV Association Algorithms
When the clusters numberK,the locationlkand the association CHs-CMs matrix Υ were determined,the optimization problemP0is only related to the deployment of UAVs and the association relationship Ω between UAVs and CHs.Therefore,the optimization problem could be modeled as
The optimization problemP2is an NP-hard problem with high solution complexity.On the one hand,the deployment variables and the associated variables are coupled with each other.On the other hand,UAVs are deployed in a continuous space,which leads to an infniite number of deployment schemes.Finding solutions exhaustively is not possible.Therefore,in this section,we propose the AC-UD algorithm,which models the UAV deployment optimization as an MDP process and determines the locations of UAVs by centralized training.Furthermore,the PD-A algorithm is proposed to determine the reward in each training state during the training process.
In the MDP process,the states of the agent,the actions performed,and the rewards obtained with the actions at stepiare given.The specifci state set,action set,and reward are described as follows
33. Cottage was made of bread and roofed with cakes, while the window was made of transparent sugar: Note that gingerbread is not used in the description of the house, only bread. Germany s rich tradition of creating gingerbread houses and other items has caused the house to be described as gingerbread in subsequent rewritings and tellings. To read an excellent history of gingerbread as a food, visit The History of Gingerbread.
State set: DefnieSias the state set of the intelligence at stepi,and take the coordinates of all UAVs as the joint state set of the intelligence,denoted asSi=
Action set: The action set of each UAV is specifeid to consist of fvie movement directions,which are forward,backward,left turn,right turn,and remain stationary,denoted asA={A1,A2,...,A5},and the movement step length of each action is fxied as a constantdstepto discrete the action of each UAV,as shown in Figure 3.In theith step of training,the UAVmselects an action fromA,denoted asThus,the joint action performed by all UAVs at stepiis

Figure 3.Discrete UAVs actions.
Reward:r(si,ai)indicates the reward of the UAVs at statesiwith the actionaiat stepi.The rewardr(si,ai) accurately evaluates the quality of the transition from the current statesito the next statesi+1.It is a function of the minimum total transmit power required at statesi+1.Specifcially,the lower the total transmit power,the more reward is obtained.The total transmit power of CHs at statesi+1,under the optimal association schemeis defnied as
3.2.1 Power Difference Based CH-UAV Association Algorithm
Observing Eq.(12),the transmit power of CHs is mainly related to the distance between CHs and UAVs,and the shorter the distance,the lower the required transmit power.Therefore,each CH only needs to connect to the nearest UAV.However,this method may lead to an unbalanced load of UAVs,resulting in the exhausted power of overloaded UAVs.
Based on the above analysis,the PD-A is proposed to minimize the total transmit powerof CHs under the optimal associationin the statesi+1while ensuring the loading balance of UAVs.The computation complexity of the PD-A isO(M),whereMrepresents the number of UAVs.The details of the PD-A algorithm are shown in Algorithm 2.

3.2.2 AC-Based UAV Deployment Algorithm
In this section,the AC algorithm is used in the UAV deployment optimization,which is capable of fniding the optimal deployment by achieving a balance between exploitation and collaboration between the Actor and Critic.The Actor uses the policy gradient algorithm to select actions and the Critic uses the Deep Qnetwork to rate the actions and gives the ratingqback to the Actor.Then,the Actor will modify the probability of the actions based on the rating,as shown in Figure 4.
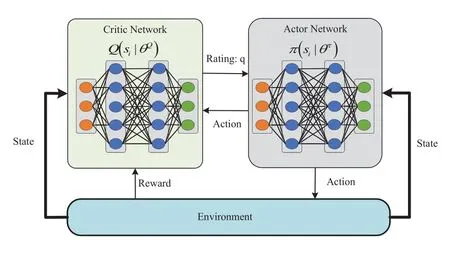
Figure 4.AC algorithm flowchart.
Critic networks:Critic networks evaluate the actions chosen by the actor network through a stateaction-value function.The Q-learning algorithm is often used to solve these problems.Therefore,the Qvalue functionQ(si,ai)is denoted as
wherePsisi+1denotes the transition probability from the statesito the next statesi+1.Furthermore,Temporal-Difference is used in the DQN to approximate the Q function,and the critic network Temporal-Difference error is calculated as
whereθQis the weight vector of the DQN.Then,the critic network updates the parameters with a minimization loss function,denoted as
Actor network:In each iteration,the UAV selects the corresponding actionaibased on the current statesiand the strategyπ.Montecarlo policy gradient RL method is used for the training of the actor network with the following formula:
whereθπis the weight of the actor network;αis the learning rate;∇θπlogπθπ(si,ai)is called the score function;viis the state value of theith step.To be consistent with the critic network,in the actor network,the Temporal-Difference method also is used,thusvi=ϕ.The computation complexity of the ACUD isO(LI),whereLandIrepresent the number of training rounds and the iteration step clusters.The details of the AC-based UAV deployment algorithm are shown in Algorithm 3.

IV.SIMULATION RESULTS
In this section,we evaluate the performance of the proposed IKC algorithm,AC-UD algorithm,and PD-A algorithm through simulations.Firstly,we simulate the quantity and locations of CHs in the target region,the association between CHs and CMs,and the variation of the total transmit power of CMs with respect to the number of SNs,using the IKC algorithm.Furthermore,the effectiveness of the PD-A algorithm is analyzed to verify the loading balance of UAVs.Moreover,by employing the AC-UD algorithm,we could determine the optimal positions for UAVs.Finally,through simulations,we demonstrate the advantages of the AC-UDC algorithm presented in this paper over the comparative algorithms in aspects.
4.1 Simulation Parameters Setting
In this section,the proposed algorithms are simulated and analyzed using the TensorFlow platform.The proposed algorithms are applicable to multiple UAVs for data collection in the WSN,and the optimal number of UAVs is related to the size of the target area as well as the number of sensors.Therefore,in the simulation,three UAVs were deployed in a 500m×500marea for data collection.Moreover,1000 SNs with Uniform,Normal,or Rayleigh distribution are deployed in this area.The simulation parameters are presented in Table 1.

Table 1.Simulation parameters setting.
4.2 Simulation Performance Analysis
Table 2 shows the number of clusters versus the maximum communication distance of the IKC algorithm for different SNs distributions.From the table,it can be observed that as the maximum communication distancebetween CMnand CHkincreases,the number of clusters decreases signifciantly.However,after reaching a certain point,the number of clusters stops changing noticeably.This is because asincreases,the radius of each cluster also increases,resulting in a decrease in the number of clusters.Furthermore,when the optimal number of clusters is decided by the Elbow method,further increasingwill reduce the degree of aggregation within each cluster.In Figure 5,the clustering results of the IKC algorithm are presented for various SNs distributions withThe result indicates that the distribution of CHs is uniform in the Uniform and Rayleigh distribution scenario,which appears more scattered in the Normal distribution scenario.This is because the CHs in the Normal distribution scenario are mainly concentrated in the center of the target area,but there are a few isolated points at the edge that have to be assigned a CH under the maximum communication distance constraint,contributing to the relatively higher required number of CHs for the Normal distribution scenario.
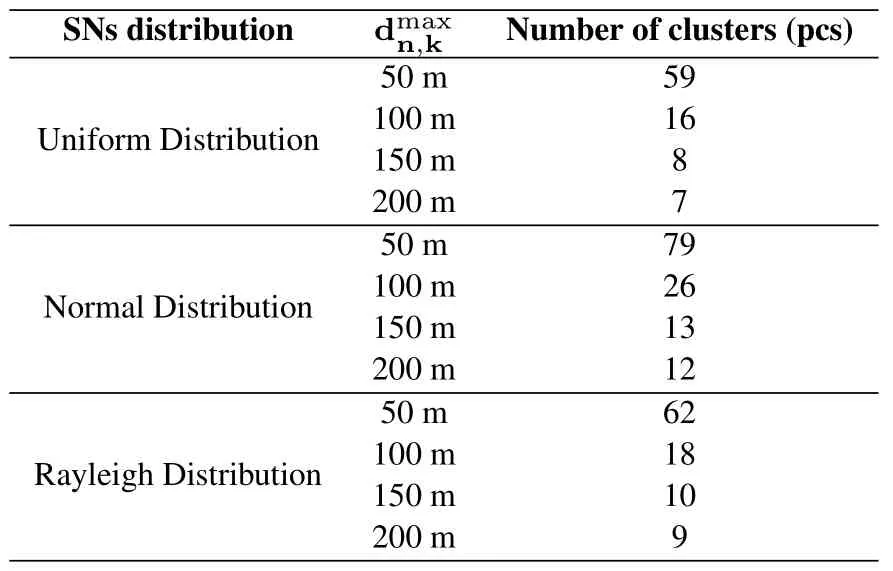
Table 2.Number of clusters and maximum communication distance with different SN distributions.
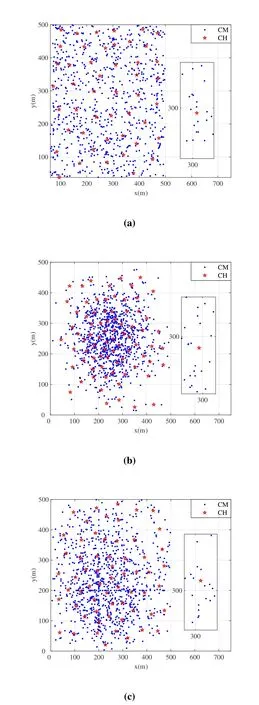
Figure 5.Clustering results with different SNs distributions. (a)Uniform distribution;(b)Normal distribution;(c)Rayleigh Distribution.
Figure 6 illustrates the association between the number of SNs and the total transmit power of CMs based on the improved K-means++clustering algorithm forFrom the fgiure,it can be seen that the total transmit power of CMs increases rapidly and then slowly as the number of SNs increases.Because as the coverage of SNs in the target area increases,the number of clusters will also increase,which causes a rapid increase in the transmit power of CMs.When the coverage of SNs reaches a certain value,the number of clusters slightly changes when increasing the number of SNs.Furthermore,the additional SNs will be assigned to the existing clusters,thus the total transmit power of CMs increases slowly.It can also be seen that the curves betweenand betweenhas a bigger interval,while200mhas a small interval between the curves.The reason is that asincreases,the number of clusters signifciantly decreases,leading to an increase in the average distance from CMs to CHs within each cluster,and thus the total transmit power increases signifciantly.Finally,whenincreases to a certain level,the number of clusters and the total CM transmit power will remain stable due to the elbow method.
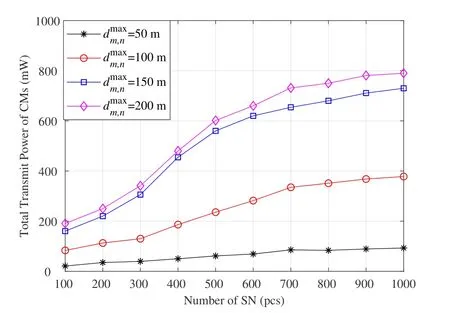
Figure 6.Total transmit power of CMs versus the number of SNs with different
Figure 7 shows the average reward versus training rounds for the AC-UD algorithm with different moving stepdstepof UAVs,where the distribution of SNs follows a uniform distribution.From the fgiure,it can be seen thatdstep=10mhas the most stable convergence and the largest average reward,whiledstep=100mhas the most fluctuating convergence and the lowest average reward.This is because the positions of the UAVs are randomly initialized at the beginning of each round,and the fnial positions of the UAVs are different due to the moving step.The difference between the trained positions and the optimal positions at convergence will increase as thedstepincreases,resulting in a smaller average reward.Therefore,in practical applications,the optimal UAVs deployment positions can be approximated by reducing thedstep.In the following simulation,we setdstep=50m.

Figure 7.Average reward versus the number of training rounds of the AC-UD algorithm with different moving steps.(a)dstep=10 m;(b)dstep=50 m;(c)dstep=100 m.
Figure 8 presents the average reward of the AC-UD algorithm versus the number of training rounds for different SN distributions.It can be seen from the fgiure that the scenario with Uniform distribution converges with the lowest average reward,followed by the Normal distribution scenario and the highest by the Rayleigh distribution scenario.The reasons are as follows: the CHs in the Normal or Rayleigh distribution scenario are concentrated in the central region,and the average distance between CHs and the associated UAVs is shorter relative to the Uniform distribution scenario,and thus the total transmit power of the CHs is relatively lower,and the average reward will be higher.Nevertheless,the average reward of the Normal distribution scenario is lower than that of the Rayleigh distribution scenario because under the maximum communication distance constraint.In this case,it is necessary to assign CHs to isolated SNs located at the edges,which leads to an increase in the total transmit power and a decrease in the average reward.

Figure 8.Average reward versus the number of training rounds of AC-UD with different SN distributions. (a) Uniform distribution;(b)Normal distribution;(c)Rayleigh distribution.
Figure 9 shows the optimal locations and association of UAVs with different distributions of SNs.The triangles of three colors in the fgiure represent three UAVs,and the small circles represent CHs.UAVs and their associated CHs are represented in the same color.It can be seen from the fgiure that the target area is equally divided into three parts by the UAVs,and the CHs chose the nearest UAV in the Uniform distribution scenario.In the Normal and Rayleigh distributions scenario,UAVs are relatively concentrated near the center of the region,especially the Normal distribution.In the Normal distribution scenario,most of the SNs are concentrated in the center of the region,the UAVs are deployed near the center to reduce the transmit power.Furthermore,when the number of UAV associations exceedsϖ,UAVs will select CHs with a larger transmit power difference in the overlapping areas,and the excessive CHs have to connect to other UAVs.
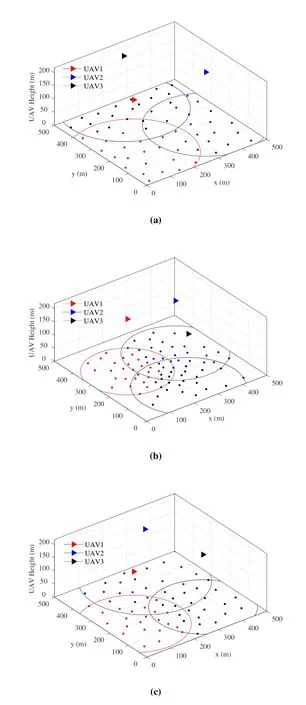
Figure 9.UAV deployment and CH-UAV association with different SNs distributions(a)Uniform distribution;(b)Normal distribution;(c)Rayleigh distribution.
Figure 10 shows the load of UAVs with different SNs distributions by using different association algorithms,the comparison algorithms are the shortest distance-based association algorithm and the random association algorithm.As shown in the fgiure,the proposed PD-A algorithm could guarantee the loading balance of UAVs,because in the algorithm when the UAV load exceeds its maximum CHs associations,the excessive CHs will be selected based on the power difference,and connect to other UAVs.

Figure 10.Load of each UAV with different distributions.(a)Uniform distribution;(b)Normal distribution;(c)Rayleigh distribution.
Figure 11 shows the total transmit power versus the number of SNs for different optimization algorithms whenThe comparison algorithms are the K-means based SN clustering(KC)algorithm and the cluster based UAV deployment(C-UD)algorithm[23].The KC algorithm uses the same cluster number,and the deployment of UAVs and the CH-UAV association is the same as the AC-UDC algorithm.In the C-UD algorithm,the cluster centers of CHs are decided as the locations of UAVs,and the CH-UAV association is the same in the AC-UDC algorithm.It can be seen from the fgiure that the total transmit power of all the algorithms increases as the number of SNs increases,and the increase rate becomes slower.Because the coverage of the CHs increases with the increased transmit power,when its coverage reaches a certain level,the number of CHs will remain stable,and the additional transmit power is according to new CMs.In addition,the proposed AC-UDC algorithm requires the minimum total transmit power,whereas the C-UD algorithm requires the maximum total transmit power.Because in the KC algorithm,the CHs are randomly selected,leading to a higher transmit power.Meanwhile,in the C-UD algorithm,the locations of UAVs are cluster centers of CHs,which makes the UAV deployments deviate from the optimal locations.In this case,the deployments of UAVs have a greater impact on the total transmit power when the maximum communication distance and the number of CHs are fxied,thus the C-UD algorithm requires the maximum total transmit power.
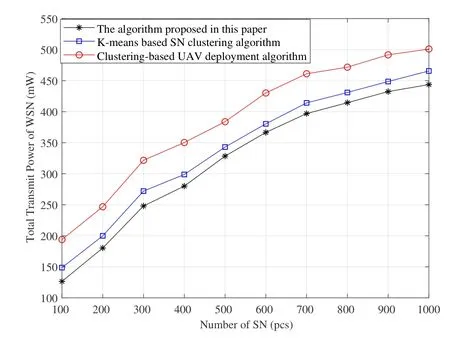
Figure 11.Total transmit power versus the number of SNs with different optimization algorithms.
Figure 12 shows the total transmit power versus the maximum communication distance with different optimization algorithms when the number of SNs is 1000.From the fgiure,it can be seen that with the increase of the maximum communication distance,the total transmit power decreases sharply and increases gradually whendmax=80,and remains stable whendmax=180.With the increased maximum communication distance,the number of CHs decreases rapidly at the beginning,and the average communication distance of CMs increases slowly.Therefore,the total transmit power mainly decreases as the transmit power of CHs decreases.Whendmaxincreases to a certain value,the number of CHs decreases slowly until stable,while the average communication distance of CMs still increases,so the total transmit power increases.When reached the minimum number of clusters,the clustering result no longer changes with the increase of the maximum communication distance based on the elbow method,and the total transmit power becomes stable.
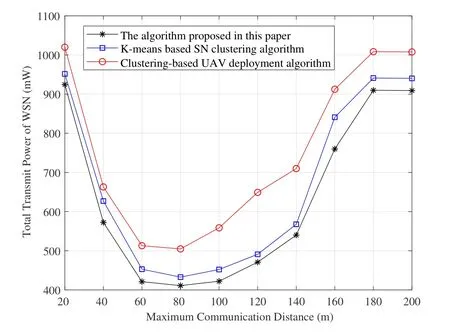
Figure 12.Total transmit power versus and the maximum communication distance with different optimization algorithms.
V.CONCLUSION
In this paper,we proposed an Actor-Critic based UAVassisted data collection algorithm in the WSN.We aimed to minimize the power consumption during the UAV-assisted data collection in the WSN by optimizing the locations and number of CHs,positions of UAVs,and the association between UAVs and CHs.Firstly,we proposed the improved K-means++clustering algorithm to optimize the number of CHs and locations under the maximum communication distance constraint of SNs.Secondly,the AC-based UAV deployment algorithm was introduced to determine the optimal location of each UAV.Furthermore,the power difference based CH-UAV association algorithm was shown to resolve the association between UAVs and CHs.The simulation results validated the feasibility and effectiveness of these algorithms.In the future work,the multi-agent machine learning could be considered to minimize swarm energy consumption during data collection and avoid collisions between UAVs in movement scenarios.
ACKNOWLEDGEMENT
This work was supported by the National Natural Science Foundation of China (NSFC)(61831002,62001076),the General Program of Natural Science Foundation of Chongqing (No.CSTB2023NSCQ-MSX0726,No. cstc2020jcyjmsxmX0878).
- China Communications的其它文章
- Distributed Application Addressing in 6G Network
- A Self-Attention Based Dynamic Resource Management for Satellite-Terrestrial Networks
- A Support Data-Based Core-Set Selection Method for Signal Recognition
- Integrated Clustering and Routing Design and Triangle Path Optimization for UAV-Assisted Wireless Sensor Networks
- Joint Task Allocation and Resource Optimization for Blockchain Enabled Collaborative Edge Computing
- Stochastic Gradient Compression for Federated Learning over Wireless Network

