Uniformity Control of Scanned Beam in 300 MeV Proton and Heavy Ion Accelerator Complex at SESRI
HOU Lingxiao, YUAN Youjin, SHEN Guodong, RUAN Shuang, LIU Jie,ZHU Yunpeng, WANG Geng, GUO Hongliang, LYU Mingbang,GAO Daqing, XU Zhiguo, SHENG Lina, YANG Jiancheng,*
(1.Institute of Modern Physics, Chinese Academy of Sciences, Lanzhou 730000, China;2.University of Chinese Academy of Sciences, Beijing 100049, China)
Abstract: In recent years, heavy ion accelerator technology has been rapidly developing worldwide and widely applied in the fields of space radiation simulation and particle therapy. Usually, a very high uniformity in the irradiation area is required for the extracted ion beams, which is crucial because it directly affects the experimental precision and therapeutic effect. Specifically, ultra-large-area and high-uniformity scanning are crucial requirements for spacecraft radiation effects assessment and serve as core specification for beamline terminal design. In the 300 MeV proton and heavy ion accelerator complex at the Space Environment Simulation and Research Infrastructure (SESRI), proton and heavy ion beams will be accelerated and ultimately delivered to three irradiation terminals. In order to achieve the required large irradiation area of 320 mm×320 mm, horizontal and vertical scanning magnets are used in the extraction beam line. However, considering the various requirements for beam species and energies, the tracking accuracy of power supplies (PSs), the eddy current effect of scanning magnets, and the fluctuation of ion bunch structure will reduce the irradiation uniformity. To mitigate these effects, a beam uniformity optimization method based on the measured beam distribution was proposed and applied in the accelerator complex at SESRI. In the experiment, the uniformity is successfully optimized from 75% to over 90% after five iterations of adjustment to the PS waveforms. In this paper, the method and experimental results were introduced.
Key words:heavy ion accelerator; beam uniformity; scanning magnet; MIC
The SESRI (Space Environment Simulation and Research Infrastructure), which was initially proposed by HIT (Harbin Institute of Technology) in 2015, is a comprehensive infrastructure dedicated to simulating the space environment and studying the interaction of high-energy particle radiation with materials, devices, modules, and biospecimen[1-2]. The irradiation experiment in SESRI facility requires an ultra-large irradiation area of 320 mm×320 mm and a high irradiation uniformity of at least 90%, which poses a challenge to the design of the accelerator. To obtain uniform scanning, a scanning magnet was employed to sweep the beam in the transverse direction in a beam-matched pattern[3-4]. Compared with passive scattering[5]and pencil beam scanning[6-7], this method can deliver a larger field size due to the fewer beam degrading and scattering components. However, the tracking accuracy of power supplies (PSs), the eddy current effect of scanning magnets, and the fluctuation of ion bunch structure will affect the irradiation uniformity. To mitigate these effects, a beam uniformity optimization method was proposed, which was based on the measured beam distribution from the multi-channel ionization chamber (MIC) that downstream of the scanning magnets.
In this paper, the sources of non-uniformity will be analyzed firstly, mainly including the tracking accuracy of the PSs and the eddy current effect of the scanning magnets. Secondly, the MIC measurement system will be introduced. Thirdly, a uniformity control system will be devised to enhance uniformity by utilizing data obtained from MIC and adjusting of PS waveforms.
1 Accelerator of SESRI
As a key part of SESRI, a 300 MeV proton and heavy ion accelerator facility was designed and constructed by Institute of Modern Physics, Chinese Academy of Sciences (IMP, CAS) in 2021. The accelerator facility mainly consists of an ECR ion source, a linac injector, a synchrotron, and three irradiation terminals. The accelerator can provide proton beam with a maximum energy of 300 MeV, and ion beams such as the209Bi32+beam with a maximum energy of 7 MeV/u, which will be extracted from the synchrotron and transferred to different experimental terminals. The schematic layout of the SESRI facility is shown in Fig.1, with the total length of the beamline about 177 m. The major parameters of the accelerator facility are listed in Table 1.
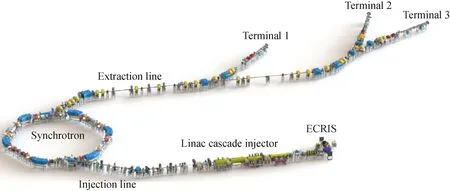
Fig.1 Layout of 300 MeV proton and heavy ion accelerator complex at SESRI
Generally, the beam extracted from the accelerator is very small, only about 10 mm in size. To expand the beam size to an irradiation area of 320 mm×320 mm, the horizontal and vertical scanning magnets were applied, which were powered by a triangular wave with a maximum frequency of 200 Hz and amplitude of ±500 A. The scanning magnets provide a time-varying transverse deflecting force that deflects the beam both in the horizontal and vertical directions, thus scanning the beam into a large and uniform irradiation area. The uniform scanning was performed at three terminals as shown in Fig.2. Finally, the beam distribution was acquired using MICs at the terminal ends to measure the particle number and uniformity of the scanned beam.
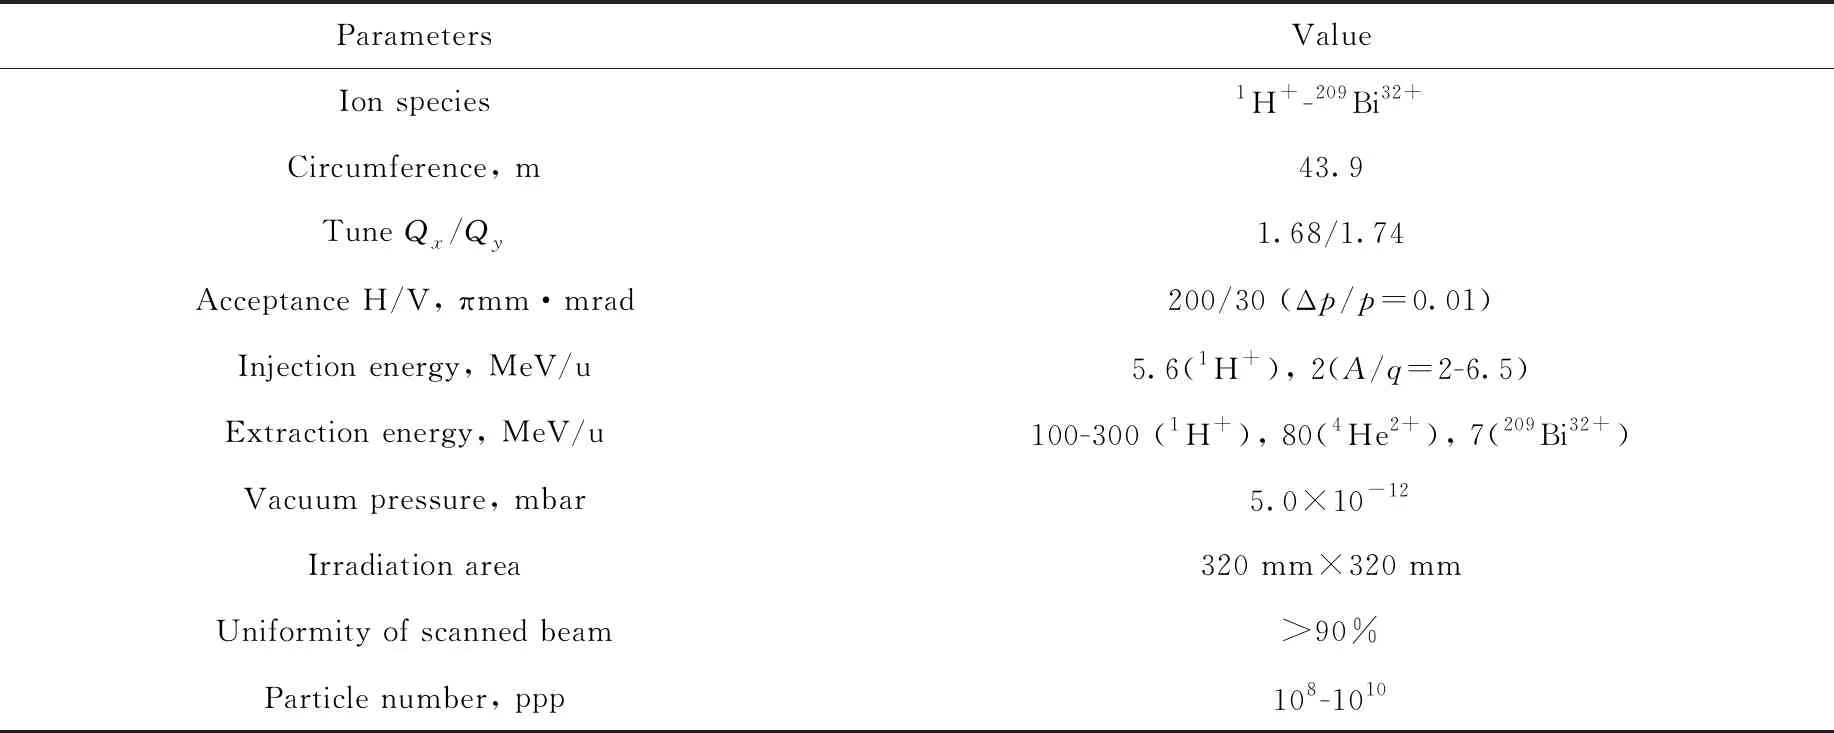
Table 1 Main parameters of accelerator facility

Fig.2 Layout of irradiation terminal
2 Error analysis of scanning magnets
Scanning magnets are powered by triangular waveforms with a maximum frequency of 200 Hz and amplitude of ±500 A. The scanning frequency and amplitude correspond to the gradient of the PS waveform, which is the main error source for the PS and magnets, and directly results in the non-uniformity in the final irradiation area.
2.1 Tracking error of PSs
The tracking error, which refers to the deviation between the set current and the output current, has been repeatedly measured for different amplitudes and frequencies. A measurement result of PS waveform and tracking deviation is shown in Fig.3. The deviation of the waveform is approximately fixed at ±2.15 A except for the switching points of current direction, as shown by the blue line in Fig.3. The value of the waveform is directly related to the location of the beam. The peak of the waveform corresponds to the edge of the irradiation area, which is sufficiently larger than the design area size of 320 mm×320 mm. Consequently, the tracking error at the peaks of the waveform is negligible, and the overall tracking error can be considered to be fixed at ±2.15 A.
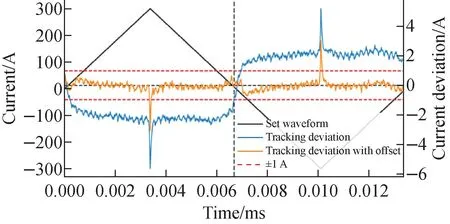
Fig.3 PS waveform and tracking deviation in 300 A/119 Hz
An offset of ±2.15 A on the PS waveform means that the value of the waveform is increased or decreased by 2.15 A (for 300 A/119 Hz). As a result, by subtracting the offset from the waveform, the deviation is reduced as shown by the orange line in Fig.3. Considering that the PSs operate between 100 A and 500 A at frequencies ranging from 50 Hz to 200 Hz, different offsets should be applied to ensure that the tracking deviation is less than 1 A for all cases. As a summary of the measurements, for different set waveforms, the larger the scanning frequency and magnitude, the greater the tracking error, thus requiring a larger offset. Here, starting from a single PS waveform, the offset is simply identified as one parameter to reduce the error.
2.2 Eddy current error of scanning magnets
According to Faraday’s law of electromagnetic induction, the variation of the magnetic field induces eddy currents within a conductor, resulting in a delay of the actual magnetic field relative to the ideal magnetic field[8-9]. Therefore, for rapidly changing magnetic fields, such as those produced by scanning magnets, the eddy current effect is particularly pronounced[10]. However, considering that the operation of scanning magnets is not synchronized with the timing system, merely causing a delay does not lead to non-uniformity in the distribution of the scanned beam. Nevertheless, due to the inherent tracking errors in the output current of the PSs, which is not uniformly changing, the delayed effect of the eddy current is also no longer a fixed value, resulting in a certain degree of non-uniformity in the scanned beam distribution.
Fig.4 illustrates the variation of eddy currents over time within one cycle of the scanning magnet waveform. The curve labeled “dcct” represents the provided scanning magnet current waveform, while the curve labeled “coil” represents the normalized magnetic field waveform measured by the coil in the scanning magnet. The magnetic field delay for both is indicated as “delay”. Due to the previously mentioned offset, it can be observed that the delay curve exhibits a noticeable discontinuity at the zero-crossing point, with its maximum value also occurring at the zero-crossing point.
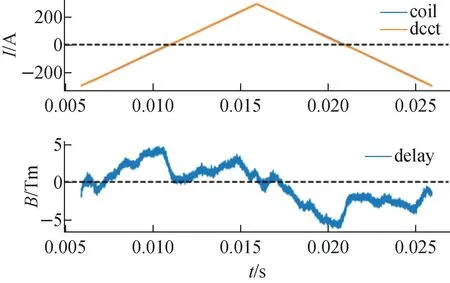
Fig.4 Variation of eddy currents over time within one cycle of scanning magnet
Due to the high scanning frequency of the scanning magnet, the sampling frequency of the data acquisition equipment may affect the results. Therefore, Fig.5 illustrates the maximum magnetic field deviation measured by the coil at different sampling frequencies when the scanning magnet is set to different frequencies. It can be observed that the magnetic field deviation is unrelated to the sampling frequency, but its absolute value increases as the scanning magnet frequency increases. As a result, the maximum deviation is observed at a maximum scanning frequency of 200 Hz, reaching -4.7%.
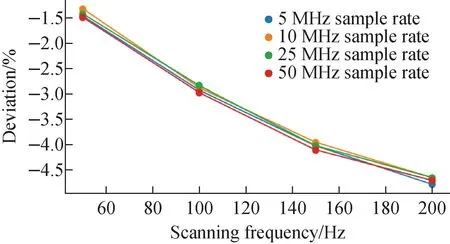
Fig.5 Maximum deviation of eddy currents at different scanning frequencies
3 Detection and scanning system
3.1 Detection system: MICs
The multi-channel ionization chambers (MICs) were installed at the accelerator terminal possess position-resolving capabilities, enabling accurate and rapid real-time monitoring of beam profile uniformity online. After acquiring beam profile using MICs at irradiation plane, the uniformity (or flatness) of the scanned beam is determined by:
(1)
whereAminandAmaxare the minimum and maximum signal amplitudes respectively measured from MICs[7].
To precisely measure the beam profile across a range of beam intensities, the MIC probe design, electronics development, data processing, and interaction were developed independently[12-15]. Careful calibration of the downstream MICs was performed using upstream scintillator detectors and ionization chambers under beam conditions. MICs were located at the end of each SESRI terminal, downstream of the horizontal and vertical scanning magnets. On the surface of MIC detectors, there are 200 channels arranged crosswise in the horizontal and vertical directions. Two MICs with the same number of channels are used in two different detection areas, which are 350 mm×350 mm in Terminal 2 and 400 mm×400 mm in Terminal 3, respectively.
A comparison of beam profiles with and without the scanning magnets is presented as shown in Fig.6, where the beam size can be expanded from 20 mm to 320 mm. The particle counts that accumulated in MIC channels for a beam cycle are illustrated in Fig.7, in which two red dotted lines correspond to the 320 mm boundary, between which equation (1) is applied to calculate the terminal uniformity. According to the data in Fig.7, the uniformity only reaches 76.6%, which is lower than the target of 90%.
There is no secret to why our marriage has lasted while so many others have failed. There is no formula for success that I can offer, other than to express that the most important feature of our relationship is that it has never lost the sense of romance3 that bloomed when we first met. Too often marriage kills the romance that was born in the courtship of a relationship. To me, I have always felt that I am still courting Patricia, and therefore the romance has never died.
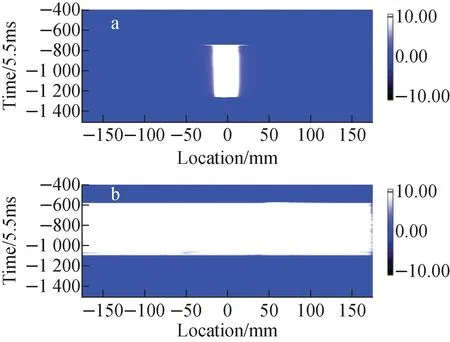
Fig.6 Beam profile measured by MIC without scanning magnets operating (a) and with scanning magnets excited by triangular waveform (b)
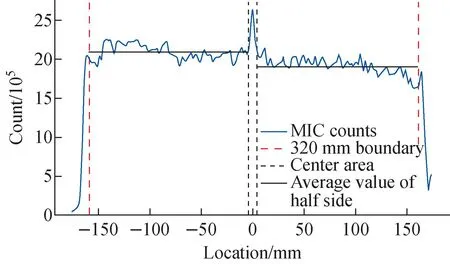
Fig.7 Particle count distribution of MIC
3.2 Scanning system
Schematic diagram of scanning system is shown in Fig.8.
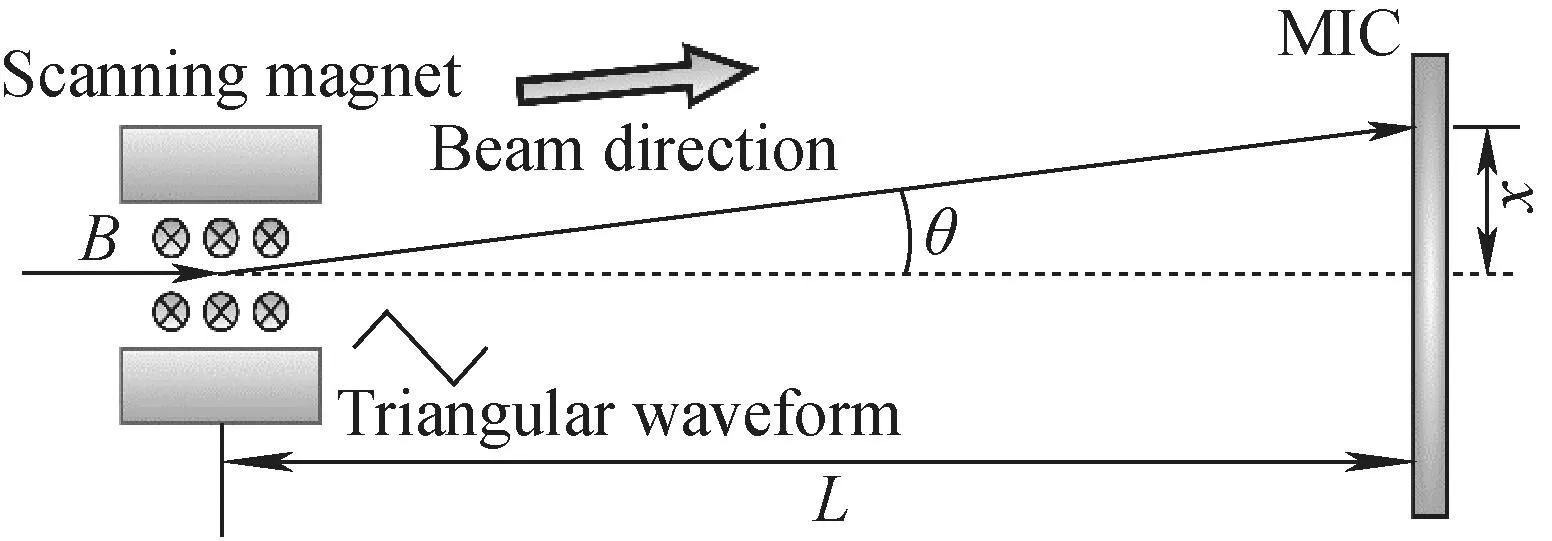
Fig.8 Schematic diagram of scanning system
The triangular waveform can be divided into rising and falling segments, each linear segment can be described as:
Ii(t)=±G(t-ti)+Ci
(2)
whereGrepresents the waveform gradient,tiandCidenote the initial time and amplitude of the triangular waveform. In the ideal scenario without any error effects, the magnetic field of the scanning magnets can be estimated as:
(3)
whereNis the number of coil turns,his the half gap of the magnet, andμ=4π×10-7H/m is the vacuum permeability. Using the impulse theorem method, particle velocity can be calculated by:
(4)
wherem,q,v0andvBrepresent the mass, charge, longitudinal and transverse velocities of particles respectively, andlis the length of the scanning magnet. Finally, the positionxof particles on the surface of the MIC can be represented as:
(5)

(6)
wherefrepresents the frequency of the scanning magnet. Without any correction, the constant waveform gradientG0can be described as:
(7)
whereIampis the amplitude of the triangular waveform. Then, the particle density on the MIC surface without any correction is:
(8)
4 Uniformity control of scanned beam
Based on the previous discussion on the relationship between scanning magnet waveforms and MIC beam count distributions, it is possible to optimize the MIC beam count distribution by synchronously adjusting the waveform. In the long-term beam test, errors in the distribution were studied to control the scanned beam, namely center error, edge error and flatness error as shown in Fig.9.
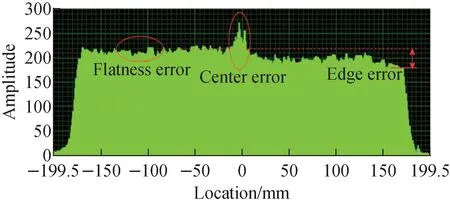
Fig.9 Three adjustment methods for uniformity control of scanned beam
4.1 Center error
The center error is a large peak in the center, which can be depicted as a cross in the 2D plane. It arises from the zero-crossing effect of the PS. The solution is discussed in section 2.1, which recommends adding an offset to the waveform. Increasing the offset can mitigate the center error, but if the offset is too large, a concave distribution may appear in the center. So, a proper offset is needed.
4.2 Edge error
The edge error is manifested by the unequal heights on the positive and negative half-axes. It results from inappropriate parameters of the slow extraction, beamline optics, or installation error of the MIC. While the current amplitude increases, the irradiation area on the MIC becomes larger. Considering the total number of particles does not increase, the particle density decrease. Since the left and right halves on the MIC respectively corresponded to the positive and negative halves of the current waveform (or possibly the opposite, depending on the MIC configuration), the problem can be solved by adjusting the amplitudes of the positive and negative parts of the current waveform.
4.3 Flatness error
Through the above two steps, the overall count distribution of the beam can be relatively flat. But there are still random fluctuations in particle counts at different positions. Therefore, the next step is to fine-tune the waveform for further improvement. For this purpose, it is necessary to discuss the correspondence between the current waveform and the count distribution of the MIC beam.
Ideally, particle counts on MICs can be described as:
(9)
wherexrepresents location, andtrepresents the duration of the MIC operation. Now, the count distribution ofNcount(x) needs to be optimized to a constantNmean, which means 100% uniformity. To achieve this, the original constant waveform gradientG0can be converted into a variableGcor.(x):
(10)
(11)
whereNnorm.(x) is the normalized MIC count distribution. In equation (5), locationxand waveform value have a linear relationship. Therefore, the positionxin equation (11) is replaced with the currentI. In fact,Grepresents the gradient of the currentI, soGcan also be replaced by the derivative of theI:
Gcor.(I)=G0Nnorm.(KI)=
(12)
(13)
The sign of left side of the equation (13) depends on whether the triangular waveform is on the rising or dropping parts. Actually, equation (13) indicates that waveformIcan be easily solved through accumulation.
Overall,Nnorm.(x) can be obtained by measuring the MIC count distribution. Then plugging it into the equation (13) for accumulation, combined with handling the center error and edge error. Finally, a current waveform can be calculated as shown in Fig.10. After loading this current waveform, the uniformity will be significantly optimized, but usually still cannot reach 90%. By repeating this process several times (less than five times), the uniformity can be improved to above 90%. Fig.11 illustrates original and corrected MIC count curves. As can be seen from Fig.11, the uniformity is finally improved from 76.6% to 93.7% after waveform adjustment, which exceeds the design target.
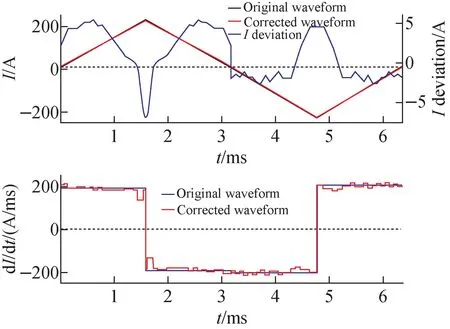
Fig.10 Original and corrected triangular waveform
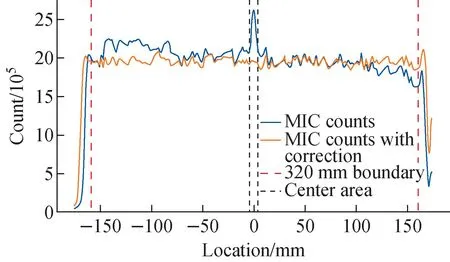
Fig.11 Original and corrected MIC count curves
4.4 Location-current calibration
According to the conclusion in section 3.2, the method for waveform correction involves adjusting the dI/dtcurve as shown in Fig.10. If a point on the dI/dtcurve is significantly reduced at a current amplitudeI0, a peak will form on the beam distribution of the MIC. The positionx0of this peak is proportional to the current amplitudeI0, as referenced in equation (5). By varying the current amplitudeI0, the positionx0of the peak on the beam distribution can be altered. Fig.12 illustrates peaks of MIC count distribution corresponding to different waveform and calibration of MIC location and normalized waveform current. As shown in Fig.12, a series of different peaks are generated for a range of current amplitudes. Linear regression of the peak positions and current amplitudes demonstrates a strong linear relationship, validating the feasibility of the dI/dtadjustment method.
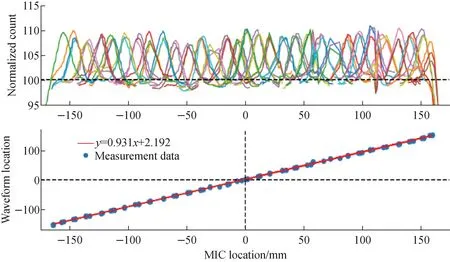
Fig.12 Peaks of MIC count distribution corresponding to different waveform (a) and calibration of MIC location and normalized waveform current (b)
5 Conclusion
This paper aims to address the issue of irradiation uniformity under conditions of ultra-large scanning areas. Firstly, low uniformity mainly results from the tracking error of the scanning magnet PS and the eddy current error of the scanning magnet. Subsequently, the structure and mathematical relationships of the measurement and scanning systems are analyzed. Based on the error sources and mathematical relationships, an effective method to improve the uniformity of the scanning beam was developed. The method of uniformity optimization is based on the measured beam distribution from the MIC that downstream of the scanning magnets. This method was successfully applied in the accelerator complex at SESRI, in which the uniformity is optimized from 75% to over 90% after five iterations of adjustment to the PS waveforms. This directly enhances the beam quality at the terminal, aiding in achieving better experimental precision and improving the operational efficiency of the SESRI accelerator.

