Effect of the interval between two shocks on ejecta formation from the grooved aluminum surface
Mingyng Xu , Jinli Sho , Weidong Song *, Enling Tng
a School of Equipment Engineering, Shenyang Ligong University, Shenyang 110159, China
b State Key Laboratory of Explosion Science and Technology, Beijing Institute of Technology, Beijing 100081, China
Keywords:Ejecta Microjet Two shocks Interval Smoothed particle hydrodynamics
ABSTRACT This work focuses on the effect of the interval between two shocks on the ejecta formation from the grooved aluminum (Al1100) surface by using smoothed particle hydrodynamics numerical simulation.Two unsupported shocks are obtained by the plate-impact between sample and two flyers at interval,with a peak pressure of approximately 30 GPa for each shock.When the shock interval varies from 2.11 to 7.67 times the groove depth, the bubble velocity reduces to a constant, and the micro jetting factor RJ from spike to bubble exhibits a non-monotonic change that decreases initially and then increases.At a shock interval of 3.6 times the groove depth, micro jetting factor RJ from spike to bubble reaches its minimum value of approximately 0.6.While, the micro jetting factor RF from spike to free surface decreases linearly at first,and stabilizes around 0.25 once the shock interval surpasses 4.18 times the groove depth.When the shock interval is less than 4.18 times the groove depth, the unloading wave generated by the breakout of the first shock wave is superimpose with the unloading part of the second shock wave to form a large tensile area.
1.Introduction
Ejecta is induced by the shock wave releasing at the material surface [1-4].The shock wave is usually generated through explosion [5], ballistic plate-impact [6], or laser-driven shock [7].Ejecta plays an important role in various fields related to shock compression science and technology, including implosion dynamics [8], inertial confinement fusion [9] and pyrotechnics [10].The phenomena associated with ejecta include microjets and micro-spallation [11].In engineering applications, the medium is generally multi-layered, so the shock wave is reflected and transmitted at the interfaces of the multilayer medium.Also, there are usually multiple detonation points in implosion[12].Therefore,the material interface is subjected to multiple shocks[13,14].After the first shock released at the material interface,succeeding shocks can affect ejecta production [15].
Buttler et al.[15]measured ejecta masses from double-shocked metals.They observed the second shock ejected areal masses of about 4 ± 1 mg/cm2, and attributed the value to unstable Richtmyer-Meshkov impulse phenomena.In addition, they observed an additional mass ejection process caused by the abrupt recompression of the local spallation or cavitation of the double shocked Sn.The radiographs of material damage in 1960s era in Ref.[16],as well as the proton radiographs of the study of solid-and liquid-ejecta formation from tin and copper[5],demonstrated that the ejecta production is related to the subsurface material failure.Buttler et al.[5] stated that ejecta formation at a metal-vacuum interface can be characterized as a special limiting case of a Richtmyer-Meshkov (RM) instability [17], where the Atwood number is A=(ρ(vacuum)-ρ(metal))/(ρ(metal)+ρ(vacuum))= -1[18].Williams and Crapes[13]performed continuum simulations of ejecta production from multiply-shocked metal surfaces,explained qualitative features seen in previous experimental results at Atomic Weapons Establishment (AWE) and Los Alamos National Laboratory (LANL) [15].But, in the simulation performed by Williams et al.,due to the fidelity and the domain of the calculation,the intershock intervals of double shocks are shorter than that of the supporting experiments [13].It is necessary to further investigate the quantification rules of the interval of multiple shocks at different pressure ranges on ejecta.
Karkhanis et al.[19] first simulated the experiments of ejecta production from second shock.Karkhanis and Ramaprabhu [20]applied a hydrodynamic approach to analyze ejecta formation from doubly shocked liquid metals,provided a baseline understanding of ejecta physics [9].Then, they simulated two-shockwave experiments,and these Sn experiments were reported in Ref.[15].But,in the continuum hydrodynamic simulations [20], they considered that the metallic material is completely in a liquid state and continuous, which is not in line with the actual engineering situation because the metal did not melt completely [21-23].In addition, the subsurface failure occurs after the material surface was first shocked [13].Therefore, the subsurface failure interacts with the succeeding shock, which affects the ejecta formation.
In the study, our main interest is in the effect of the interval between two shocks on ejecta.Based on our earlier work[6,11],we have performed the smoothed particle hydrodynamics (SPH) simulations of the ejecta formation induced by double shocks.The double shocks are obtained by the plate-impact between two flyers and the sample because the plate-impact shock loading method can control the shock pressure and profile.The effect of the interval between the two shocks on ejecta formation is investigated.The mass distribution and velocity distribution of ejecta are presented for different intervals between the two shocks.
2.Model and simulation approach
We use the self-developed SPH code,which has been described and verified in previous Refs.[6,11,24].The two shock waves in the sample are produced by the impact of two flyers, the initial configuration of the model is shown in Fig.1.The length and width of the sample are 550 μm and 100 μm, respectively.A wedgeshaped groove is constructed on the free surface of the sample.The wedged groove has a 90°angle and a depth of 50 μm.In the numerical simulations, the periodic boundary is imposed in y direction.The wedged groove,the sample and the flyer have the same width in the y direction,and the upper and lower boundaries of the sample and the flyer are periodic boundaries.Therefore,the sample and the wedged groove are considered periodic.The periodic grooves are treated as waves.The initial perturbation amplitude h0is half of the height difference between the peak and the valley,and the perturbation wavelength λ is equal to the distance between two peaks [25,26].The initial perturbation amplitude of the wedged groove is 25 μm, and the perturbation wavelength of the wedged groove is 100 μm.The thickness of the flyers Lfis 72 μm, and the width of the flyers is 100 μm.The impact velocity of the flyers is 3 km/s.The sample and flyer materials are both Al1100.In Fig.1,by varying the interval between the two flyers, two pulses with a series of intervals can be obtained in the sample.Lsis the interval between the two flyers.We conduct two-dimensional SPH simulations to study the effect of shock interval on ejecta formation and subsurface damage,based on the two-dimensional structure of the sample and two flyers.The free boundary condition is set in x-direction.Each SPH particle measures 0.25 μm in length and width.Grieves by using two dimensional simulations achieved the results excellent agreement with proton radiographs of subsurface structures in LANL experiments [3,27,28].In our previous Ref.[11], by using the two-dimensional SPH code, the microjet formation and the subsurface damage can be simulated.
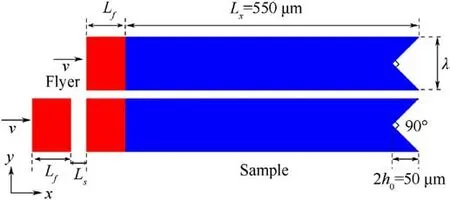
Fig.1.The initial configuration of the model: The upper is single shock loading, and the lower is double shocks loading.The perturbation wavelength λ of the wedged groove is 100 μm.The impact velocity v is 3 km/s, and the thickness of the flyers Lf is 72 μm.Ls is the interval between the two flyers.
The SPH equations [29,30] applied to the dynamics of elasticplastic material can be written as
where the Greek superscripts α and β denote the coordinate directions, i and j denote the corresponding particles.The spatial coordinates xβ and time t are the independent variables.The scalar density ρ,internal energy e,the velocity component vα,and the total stress tensor σαβare the dependent variables.vαij is the velocity component of relative motion of particle i and j.Fiis the external force acting on particle.The stress tensor σαβconsists of two components, the hydrostatic pressure P and the deviatoric stress ταβ.
where, the superscripts α and β symbolize the coordinate directions.
The equation of state (EOS), constitutive model and spall damage model are adopted in the SPH simulations.Mie-Grüneisen EOS is adopted to calculate the hydrostatic pressure, which is widely used in strong shock problem [6,31,32].Mie-Grüneisen EOS based on the shock adiabat is expressed as
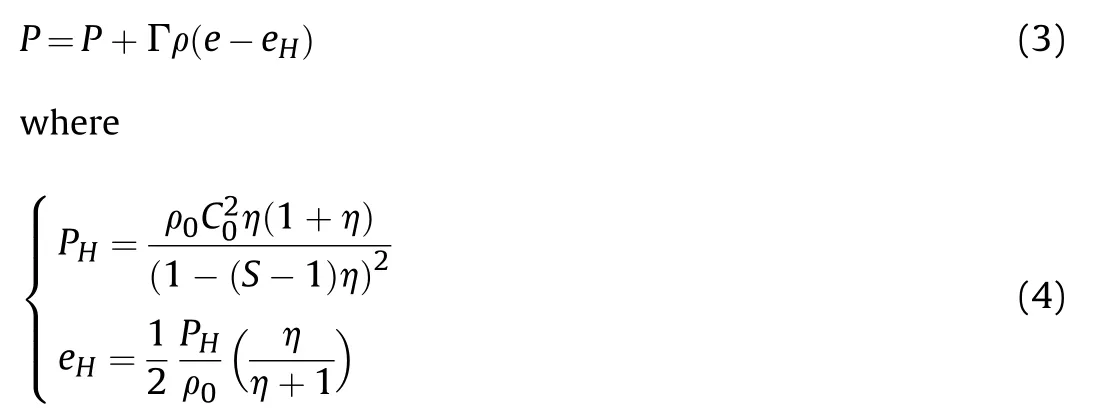
where P is the material pressure; PHis the Hugoniot pressure;e is the specific internal energy; eHis the Hugoniot energy; Γ is the Grüneisen parameter, Γρ=Γ0ρ0=constant the compressibility is represented by η = (ρ/ρ0)- 1; C0stands for the material bulk sound velocity;the Hugoniot coefficient,denoted as S,is typically a constant.
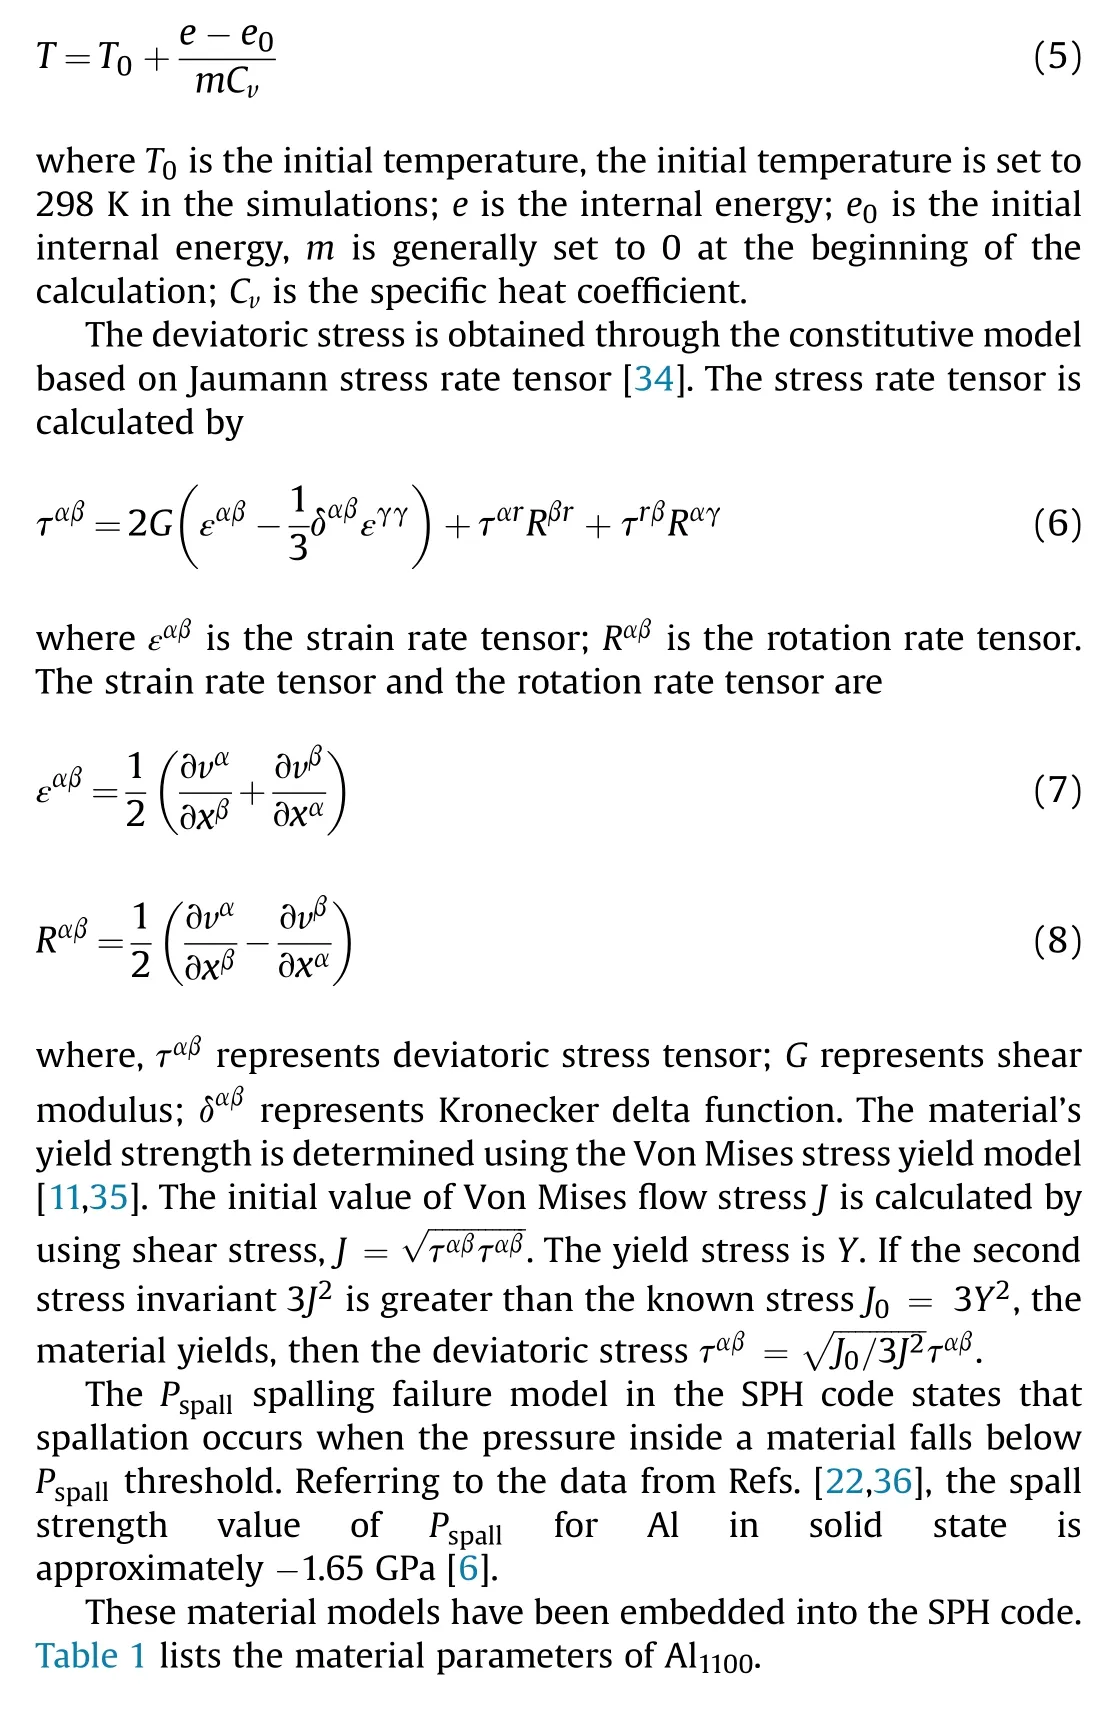
The Mie-Grüneisen EOS contains internal energy component,and temperature is related to internal energy.We use the algorithm proposed by Zukas [29,33] [G.R.Liu, M.B.Liu.Smoothed particle hydrodynamics: a meshfree particle method.World Scientific,Singapore, 2003; Zukas J.A.High velocity impact, John Wiley &Sons, New York, 1990.] to calculate the temperature in the SPH code.The temperature is calculated by
3.Results and discussion
In order to understand the effect of EOS and Jaumann stress rate on the simulation results in the current work, the relationship between the shock pressure and the relative volume V/ V0is obtained by the SPH simulations, as shown in Fig.2.V is specific volume.V = 1/ρ, and V0= 1/ρ0.This pressure-relative volume relationship represents the Rankine-Hugoniot equation on shock wave theory.The SPH simulation results about Hugoniot agree well with the experimental data[37,38]for a wide shock pressure range,which validated the EOS and Jaumann stress rate used in the SPH code.

Table 1 The material parameters of Al1110.
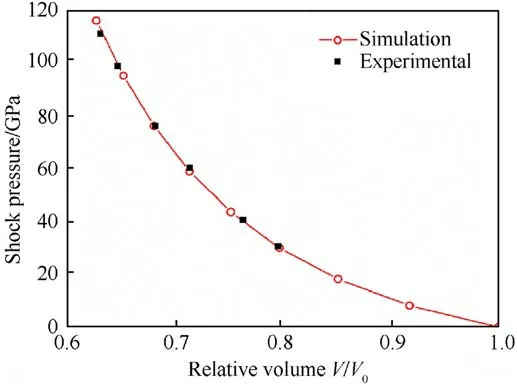
Fig.2.The simulation results about Hugoniot (Shock pressure-V/V0) are compared to the experimental data [37].
Our previous studies (Refs.[6,11,24]) have already verified the SPH code.In Ref.[11], we compared the SPH simulations of the shock pressures, the spike velocity vs particle velocity, the ejecta total mass vs time with theoretical predictions using the ejecta models [5,9,25,39,40].The simulation results closely matched the theoretical predictions.Additionally, in Ref.[6] we compared experimental results to theoretical and simulation predictions of ejecta velocity as it varied with impact velocity and sample material.These findings suggest that the SPH models are suitable for describing microjet formation during shock releasing.
3.1.Double shock wave profiles
The dependence of microjetting on shock strength has been fully discussed in previous studies [3,41].Here, we focus on the effect of the interval between two shocks on the ejecta formation.According to the control variable method, the flyers are set to impact the sample at the same velocity (3 km/s) to generate the shock waves with the same intensity, and the shock pressure corresponds to the typical microjetting state.
At 68 ns, the first shock wave front reaches the groove defect,and the shock waves generated by the single impact and two impacts are projected on the x-axis, as shown in Fig.3.For the two impacts, the intervals between the two flyers are 10 μm, 30 μm,50 μm, 70 μm, 90 μm and 110 μm.The sample is impacted by a single 72 μm thickness flyer, generating an unsupported shock wave with a triangular profile in Fig.3 [41-43].The two spaced flyers impacting the sample generate two shocks.When the two shock waves reach the groove defect respectively, they attenuate into approximately triangular unsupported shock waves.Therefore,the material around the groove interface is subjected to two unsupported shocks, and the interval between the two shocks is different.The interval between two flyers is selected to represent the interval between two shock pulses because they correspond.The interval between the two flyers ranges from 10 μm to 130 μm in the numerical simulations, correspondingly the distance interval between the two shock fronts ranges from 105.44 μm to 433.07 μm.The peak pressures of the shock waves generated by the flyers impacting the sample at a velocity of 3 km/s are all 30.02 GPa,corresponding to the strong microjet state.The time interval is the duration between the arrival of the first and second shock wave fronts at the valley of a single groove.According to onedimensional shock wave propagation theory and the numerical simulation results, the time intervals are obtained.The time interval between the two shock fronts ranges from 14.28 ns to 58.64 ns in the numerical simulations.
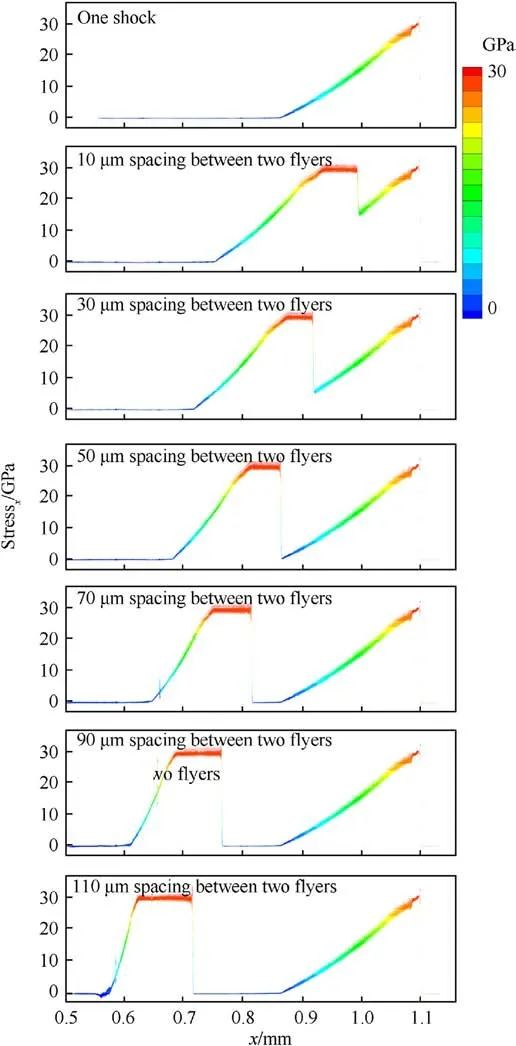
Fig.3.Comparison of the shock waves profiles generated by the single impact and double impacts at 3 km/s impact velocity (at 68 ns).
3.2.Formation process of ejecta induced by the double shocks with different intervals
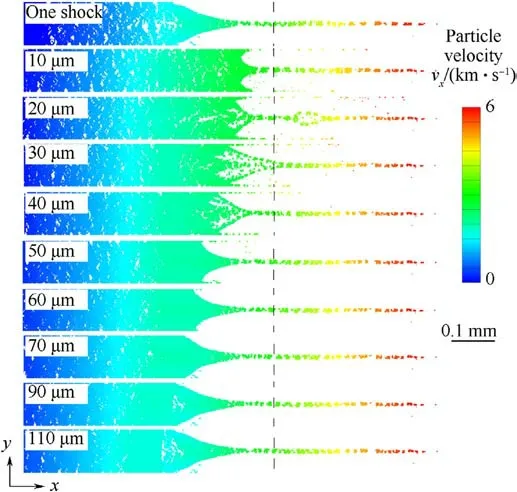
Fig.4.The velocity distributions (at 0.2 μs) of the microjets induced by the single shock and two shocks at interval.When the intervals between two flyers are 10 μm,20 μm, 30 μm, 40 μm, 50 μm, 60 μm, 70 μm, 90 μm and 110 μm, the time intervals between two shock fronts are 14.28 ns,19.95 ns,24.39 ns,28.28 ns,31.79 ns,35.14 ns,38.52 ns, 45.23 ns and 51.95 ns respectively.The colors correspond to the velocity component in the x direction,and the vertical dashed line indicates the position of the free surface.
The velocity distributions (at 0.2 μs) of microjets (ejecta)induced by the single shock and two shocks at interval are shown in Fig.4.The color-coding represents the velocity component in the x direction, and the dashed line indicates the position of the free surface.The position of the free surface is the position of the flat surface after the shock wave releases at the flat surface without defects.The morphology and velocity gradient of the microjets can be observed in Fig.4.The head velocity of microjet is about the same 6 km/s.The spike of microjet is from the head of microjet to the free surface, and the length of the spike is about the same 0.385 mm.The bubble of microjet is from the free surface to the bottom of microjet,and the length of the bubble varies greatly with the variation of the interval between two shock pulses in Fig.4.As the interval between two shock pulses increases, the spike amplitude of the microjet remains constant while the bubble amplitude gradually increases.Additionally,there is a significant change in the morphology of the microjet.
In order to further demonstrate the detailed factors that cause the morphology difference and velocity distributions of microjets induced by the single shock and the two shocks at different intervals, the formation process of microjets under the single shock and the double shocks is carefully analyzed in detail.Figs.5-10 show the stress evolution of the sample during the breakout of the single shock and the two shocks at different intervals from the wedge-shaped groove, obtained through the post-processing of numerical simulation results.The colors represent the stress component in the x direction in Figs.5-10.
Fig.5 shows the stress evolution of the sample during the breakout of the single shock wave from the groove interface.At 68 ns,the shock wave reaches the bottom of the groove.Between 68 ns and 85 ns,the stress in the sample rapidly decays due to the shock wave unloading from the groove interface.At 85 ns,the unloading wave generated from the groove interface is superimposed with the unloading part of the shock wave leading to the formation of tensile stress interface in the sample.This results in positive and negative stress regions behind the bottom of the groove.The stress in the sample has decreased significantly to a small value at 110 ns.The topography (at 0.2 μs) of the microjet induced by a single shock wave is shown in Fig.4.Many holes appear in the sample behind the bottom of the groove due to the tensile stress generated by the intersection of two shock waves: the unloading wave from the groove interface and the unloading part of the shock wave.
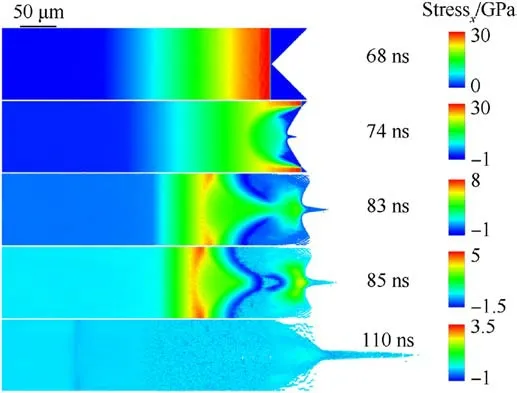
Fig.5.Snapshots of the stress evolution of the sample during the breakout of the single shock wave from the groove interface.
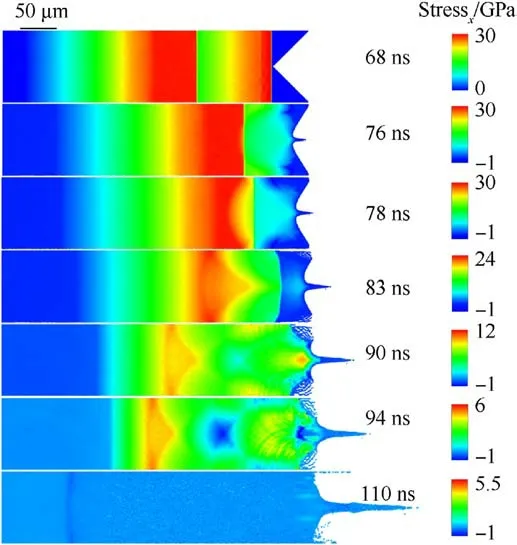
Fig.6.Snapshots of the stress evolution of the sample during the breakout of the two shock waves from the groove interface.The two shock waves are generated by the two flyers 10 μm apart impacting the sample.The time interval between two shock wave fronts is 14.28 ns.
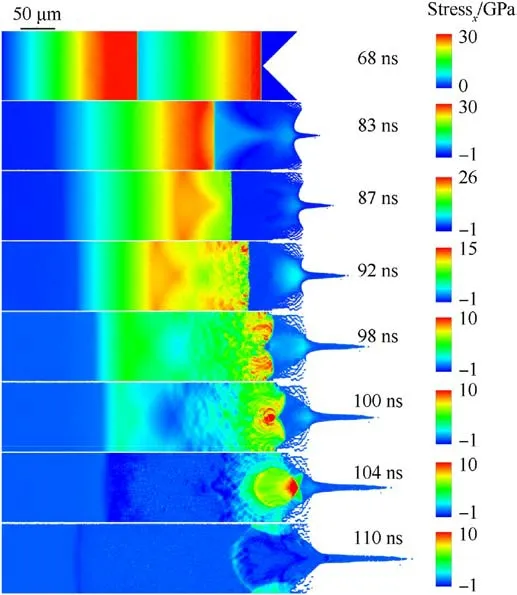
Fig.7.Snapshots of the stress evolution in the sample during the breakout of the two shock waves generated by two flyers 30 μm apart impacting the sample.The time interval between two shock wave fronts is 24.39 ns.
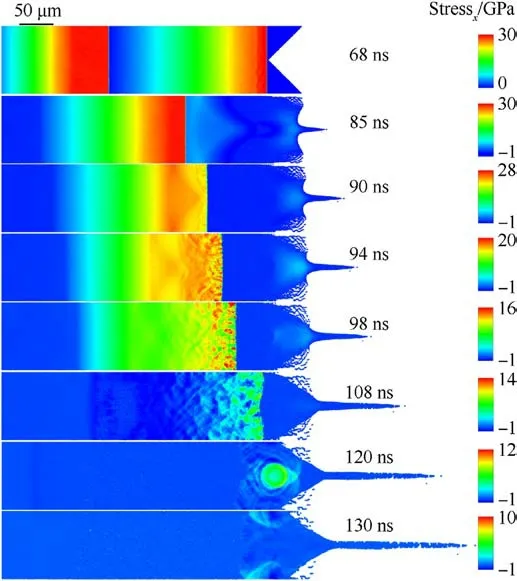
Fig.8.Snapshots of the stress evolution in the sample during the breakout of the two shock waves generated by the two flyers 50 μm apart impacting the sample.The time interval between two shock wave fronts is 31.79 ns.
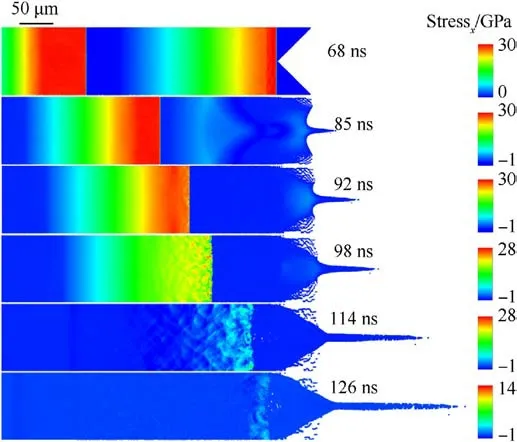
Fig.9.Snapshots of the stress evolution in the sample during the breakout of the two shock waves generated by the two flyers 70 μm apart impacting the sample.The time interval between two shock wave fronts is 38.52 ns.
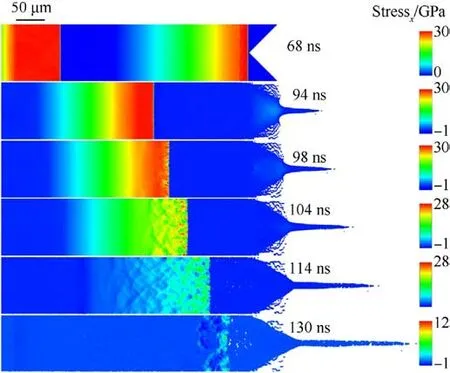
Fig.10.Snapshots of the stress evolution in the sample during the breakout of the two shock waves generated by the two flyers 90 μm apart impacting the sample.The time interval between two shock wave fronts is 45.23 ns.
The two flyers 10 μm apart impact the sample to generate the two shock waves, the stress evolution of the sample during the breakout of the two shock waves from the groove interface is shown in Fig.6.The first shock pulse reaches the bottom of the groove at 68 ns.At 76 ns,the first shock wave front releasing from the groove interface generates an unloading wave.The unloading wave and the unloading part of the first shock wave are superimposed.The intensity of the second shock wave remains unchanged from 68 ns to 76 ns.At 78 ns,there is a yellow semicircle in Fig.6 where the unloading wave generated by the first shock wave from the groove interface overlaps with the second shock wave front.At 83 ns, the unloading wave generated by the first shock wave and the second shock wave superimpose to form a strong stress area in the shape of a triangle within the sample.Meanwhile,the microjet tip has been formed.At 90 ns,the second shock wave superimposes on the unloading wave generated by the first shock wave, which causes a rapid decrease in stress in the sample.The second shock wave forms a region of higher stress at the bottom of the microjet.At 94 ns,the unloading wave generated by the release of the second shock wave front from the bottom of the microjet overlaps with the unloading part of the second shock wave,creating a tensile stress zone at the bottom.Additionally, the unloading wave generated by the first shock wave combines with the unloading part of the second shock wave to form a rectangular tensile area inside the sample.At 110 ns, the stress in the sample has attenuated to a very small level.Subsequently,the microjet and the sample continue to evolve under the influence of velocity distribution.The topography(at 0.2 μs)of the microjet induced by the two flyers 10 μm apart impacting the sample is shown in Fig.4.The bubble amplitude from the free surface to the bottom of the microjet is smaller compared to other cases in Fig.4, and two smaller microjets appear on both sides.Additionally, due to the release of the second shock wave at the tip and both sides of microjet, there is an increase in velocity at its bottom when compared to other cases in Fig.4.When the second shock wave front reaches the bottom of the microjet, its intensity is approximately 10 GPa.
Fig.7 shows the stress evolution in the sample during the breakout of the two shock waves from the groove interface.The two shock waves are produced by the two flyers 30 μm apart impacting the sample.The first shock pulse reaches the bottom of the groove at 68 ns.At 83 ns,the intensity of the first shock wave released from the groove interface rapidly decreases.At 87 ns,the unloading wave generated by the breakout of the first shock wave overlaps with the second shock wave, which forms a triangular strong stress region and the stress gradient around the triangular region in the sample.During the forward propagation of the second shock wave, it encounters the defects such as cracks and holes at 92 ns.These defects were produced by the breakout of the first shock wave at the groove interface.The second shock wave acts on the defects causing the streak-like stress concentrations.As a result,the second shock wave front rapidly decays and is nearly planar.At 98 ns,the second shock wave front becomes non-planar and develops the curved streaklike stress concentration areas on both sides.At 100 ns, a circular stress concentration area appears near the center of the second shock front.This is caused by the second shock front encountering an approximately circular area of failure.At 104 ns, the circular stress concentration region reaches the bottom of the microjet,with a stress intensity of approximately 12 GPa.At 110 ns, the release of the second shock wave and concentrated stress from the bottom of the microjet creates a tensile stress area that resembles an arrow outline at the bottom of the microjet.The morphology(at 0.2 μs) of the microjet produced by the two flyers 30 μm apart impacting the sample is shown in Fig.4.The bottom of the microjet exhibits large "arrow-shaped" holes and fragments, and two smaller microjets appear on both sides.The release of the second shock wave and concentrated stress at the bottom of the microjet forms a tensile stress area shaped like an arrow profile, which causes the sample material to fracture and break.
Fig.8 shows the stress evolution of the sample during the breakout of the two shock waves from the groove interface.The two shock waves are generated by the two flyers 50 μm apart impacting the sample.At 85 ns, the first shock wave has been released from the groove interface to generate an unloading wave, and this unloading wave front takes on an arc-shaped form.The intensity of the second shock wave remained constant at 85 ns.At 90 ns, the unloading wave generated by the first shock wave and the second shock wave superimpose to create a high stress area in the sample that has an approximately triangular shape.At 94 ns,the release of the first shock wave at the groove interface have already produced micro-cracks and micropores in the sample.The second shock wave front acts on the micro-cracks and micropores to produce"dappled" stress concentrations near the shock wave front.The stress concentrations cause the deformation and flow of the material,leading to energy consumption of the second shock wave.As a result,the intensity of the second shock wave rapidly decays from 94 ns to 108 ns.At 120 ns,the second shock wave front acts on an approximately circular damage area,increasing the stress within it while causing rapid decay of stress on both sides of the shock wave.At 130 ns,the circular stress concentration has been released from both sides of the microjet’s bottom and been replaced by tensile stress.The morphology (at 0.2 μs) of the microjet induced by the two flyers 50 μm apart impacting the sample is shown in Fig.4.Two smaller microjets appear on both sides of the main microjet due to the release of the second shock wave and circular concentrated stress.
Fig.9 shows the stress evolution of the sample during the breakout of the two shock waves from the groove interface.The two shock waves are generated by the two flyers 70 μm apart impacting the sample.At 85 ns, the first shock wave has been released from the groove interface to generate an unloading wave.This leads to tensile stress,while the intensity of the second shock wave remains constant.At 92 ns,the unloading wave generated by the reflection of the first shock wave overlaps with the second shock wave front,causing a rapid decrease in stress.At 98 ns, the release of the first shock wave at the groove interface has produced microcracks and micropores in the sample due to a long interval between the two shock waves.The second shock wave then acts on these microcracks and micropores, creating "dappled" stress concentrations in its area.These stress concentrations cause the deformation and flow of the material, which dissipates energy from the second shock wave.As a result,there is a rapid decay in the intensity of the second shock waves from 92 ns to 126 ns.At 126 ns, the second shock wave interacts with the holes induced by the release of the first shock wave, causing a "dappled" distribution of compressive and tensile stress around the hole.The morphology(at 0.2 μs)of the microjet induced by the two flyers 70 μm apart impacting the sample is shown in Fig.4.The second shock wave has minimal impact on the formation of the microjet since its intensity has already decayed when it reaches the bottom of the microjet.Although similar to a typical spike-bubble structure induced by a single shock wave,no obvious cracks and holes are observed at the microjet’s bottom.
Fig.10 shows the stress evolution in the sample during the breakout of the two shock waves from the groove interface.The two shock waves are produced by the two flyers 90 μm apart impacting the sample.At 94 ns, it is difficult to observe the unloading wave generated by the release of the first shock wave in Fig.10 because its intensity has been significantly attenuated.The micro-cracks and micropores generated by the first shock wave interact with the second shock wave, which results in "dappled" stress concentrations and stress unloading,causing the deformation and flow of material.This process consumes energy from the second shock wave,leading to a rapid decay in its intensity from 98 ns to 130 ns.At 130 ns, cracks and holes interacts with the second shock wave resulting in a "dappled" distribution of compressive and tensile stress in the shock area.The morphology(at 0.2 μs)of the microjet produced by the two flyers 90 μm apart impacting the sample is shown in Fig.4.The microjet has a spike-bubble structure similar to that induced by a single shock wave.Additionally,cracks and holes are visible at the bottom of the microjet due to the tensile stress generated by the release of the first unsupported shock at the groove interface.
In summary, when the interval between the two flyers is small(10-40 μm),and the time interval between the two shock fronts is short (14.28-28.28 ns), the unloading wave generated by the reflection of the first shock wave at the groove interface combines with the unloading part of the second shock wave,creating a large tensile area within the sample.Additionally, the release of the second shock wave at the microjet’s bottom produces a significant tensile stress.When the interval between the two flyers is large(≥50 μm) or when the interval between the two shocks is long(≥31.79 ns), micro-cracks and micropores are produced in the sample due to the release of the first shock wave at the groove interface.The interaction of the micro-cracks and micropores with the second shock wave results in "dappled" stress concentrations and stress unloading, which cause the deformation and flow of material leading to energy consumption of the second shock wave.As a result,the intensity of the second shock wave rapidly decays to very small levels, having little effect on the formation of microjet.
The release waves resulting from the reflection of shock waves at the groove are not plane waves.Nevertheless,a distance x-time t diagram can show the superposition of two shock waves and their reflected waves from the surface.Fig.11 shows the distance x-time t diagram depicting the two shock waves produced by the impacts at interval and the release waves generated by the reflection of the shock waves from the groove apex.At time t4,the superposition of second shock wave and the release wave generated by the first shock wave is clearly observed.
3.3.Quantitative comparative analysis of ejecta
To further analyze the effect of the interval of two shocks on the ejecta formation, we obtained the density distributions (at 0.2 μs)for the sample and microjet under two shocks at different interval,as shown in Fig.12.The material density at the bubble surface of the microjet and the density of fragments around the microjet are lower than the bulk density of the sample in Fig.12.Additionally,the material density of both crack and hole areas at the microjet bottom and within the sample is lower than the bulk density of the sample.
At 0.2 μs, the density distribution of the sample and microjet induced by the single shock is shown in Fig.12.There is a failure zone including holes and low-density fragments behind the microjet.This occurs because the stress in the middle of the sample is significantly higher than on both sides, as shown in Fig.5.The density distribution(at 0.2 μs)of the sample and microjet induced by the two flyers 10 μm apart impacting the sample is shown in Fig.12.In addition to the lower density material on the microjet bubble surface and the two smaller microjets, some cracks, holes,and low-density fragments appear behind the microjet due to the superposition of the unloading wave generated by the release of the second shock wave and the unloading part of the second shock wave forming a tensile effect in Fig.6.The density distributions(at 0.2 μs) of the sample and microjet induced by the impact of two flyers at intervals of 20 μm, 30 μm and 40 μm on the sample respectively are shown in Fig.12.The two smaller microjets on both sides of main microjet have lower density,and cavitation and many low-density fragments appear at the bottom of the microjet.The stress evolution of the sample in Fig.7 shows that the concentrated stress resulting from the second shock wave is released from the bottom of the microjet, forming tensile stress.This leads to cavitation and low-density fragments at the bottom of the microjet.From the 20, 30, and 40 mm intervals, after the second shock breakout, the second shock cause a merger of the second shock ejecta with the first shock ejecta sheet.The density distribution(at 0.2 μs) of sample and microjet induced by the two flyers 50 μm apart impacting the sample is shown in Fig.12.The microjet is flanked by two smaller low-density microjets,while a low-density area appears behind the microjet.The release of the second shock wave causes the two smaller low-density microjets.The interaction between the second shock wave and the micro-cracks and micropores formed by the first shock wave generates the tensile stresses that cause the low-density area in Fig.8.The density distributions(at 0.2 μs) of sample and microjet produced by the impact of two flyers at intervals of 60 μm,70 μm,90 μm and 110 μm on the sample respectively are shown in Fig.12.The low-density area inside the sample is caused by the tensile stresses resulting from the interaction between the second shock wave and the micro-cracks and micropores induced by the release of the first shock wave (see Fig.9).At 0.2 μs, the density distributions of the sample and microjet produced by the two flyers 90 μm,110 μm apart impacting the sample exhibit a failure area with holes and low-density fragments at the bottom of the microjet.This is similar to the failure area produced by a single impact in Fig.12.This is caused by the release of first shock at the groove.Moreover, the second shock wave has attenuated to a very weak level when it reaches this failure area, thus not hinder the formation of this failure area.
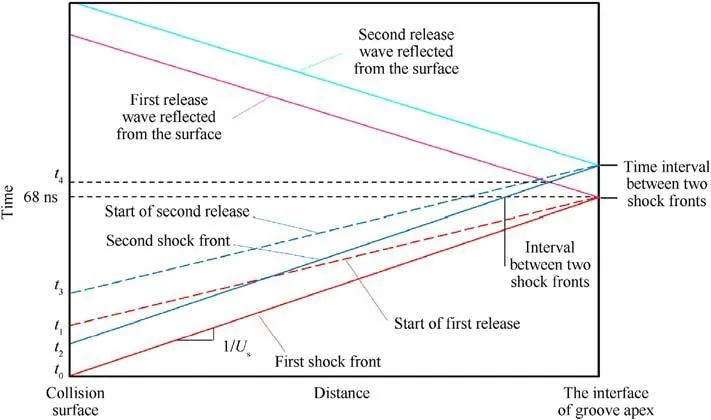
Fig.11.Distance x-time t plots of the shock waves generated by the two impacts at interval and the reflection of the shock waves from the groove apex.
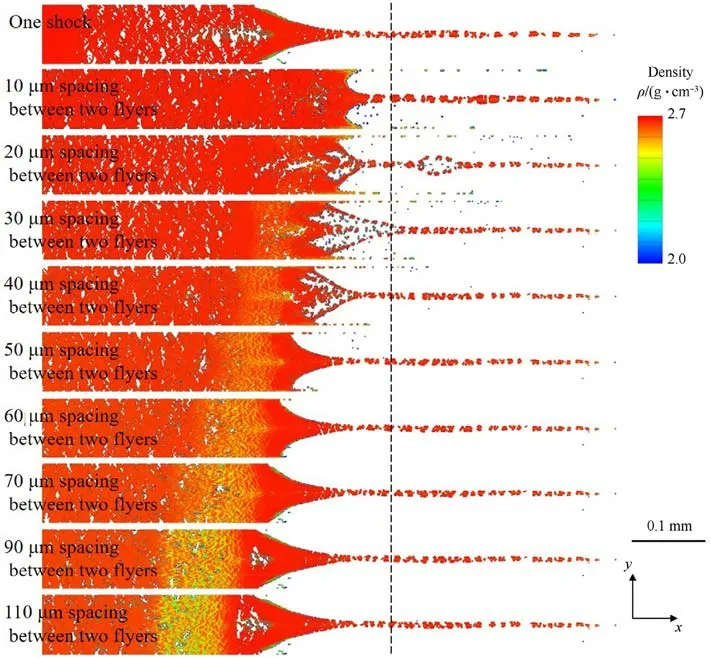
Fig.12.The density distributions (at 0.2 μs) of sample and microjets induced by the single shock and two shocks at various intervals.The dashed line indicates the free surface position.When the intervals between two flyers are 10 μm,20 μm,30 μm,40 μm,50 μm,60 μm,70 μm,90 μm and 110 μm,the time intervals between two shock fronts are 14.28 ns,19.95 ns, 24.39 ns, 28.28 ns, 31.79 ns, 35.14 ns, 38.52 ns, 45.23 ns and 51.95 ns respectively.
In summary, the morphology and density distribution of microjet are affected by the interval between two shocks.When the interval (10-50 μm) between the two flyers or the time interval(14.28-31.79 ns)between the two shock fronts is small,the second shock has a significant effect on the morphology and density distribution of the microjet.The release of second shock with high intensity at the bottom of the microjet causes two smaller lowdensity microjets on both sides of the microjet, and voids and many fragments at the bottom of the microjet.When the interval(60-110 μm) between the two flyers or the time interval(35.14-51.95 ns)between the two shock fronts is large,the effect of second shock on the morphology and density distribution of the microjet is reduced.This reduction occurs because the intensity of second shock wave has weakened significantly when it reaches the bottom of the microjet.The second shock wave causes a lowdensity area with cracks and voids inside the sample by interacting with the micro-cracks and micropores induced by the first shock wave.
The first shock wave is released from the groove interface to cause the inversion of surface perturbation.Because the intensity of second shock wave decreases rapidly, the release of the second shock wave cannot cause the second inversion of surface perturbation.This is different from the result of continuum hydrodynamics simulation in Ref.[20],because the influence of subsurface failure on the second shock wave is not considered in Ref.[20].
The unperturbed free surface under the same shock condition has an almost identical velocity of 3 km/s.The microjet consists of the spike from the free surface to the microjet tip and the portion from the microjet bottom to the free surface.We first define MJas the mass from the spike tip to the actual microjet bottom and MFas the mass from the spike tip to the free surface.The missing mass of groove defect is defined as Mdef=ρVd,where ρ is material density,Vdis groove defect volume.We introduce the ejecta jetting factor R[44] to quantify the ejected mass, which is defined as the ratio of ejected mass to groove defect mass[11,27].Additionally,the micro jetting factor from the spike tip to the microjet bottom is defined as RJ=MJ/Mdef.The micro jetting factor from the spike tip to the free surface is defined as RF= MF/Mdef.The relevant parameters of shock wave and microjet are listed in Table 2.According to Table 2,the values of jetting factors, spike velocity and bubble velocity of microjet for different intervals between two flyers are drawn in Fig.13.The horizontal dotted lines represent the relevant parameter values of the microjet generated by the single shock.
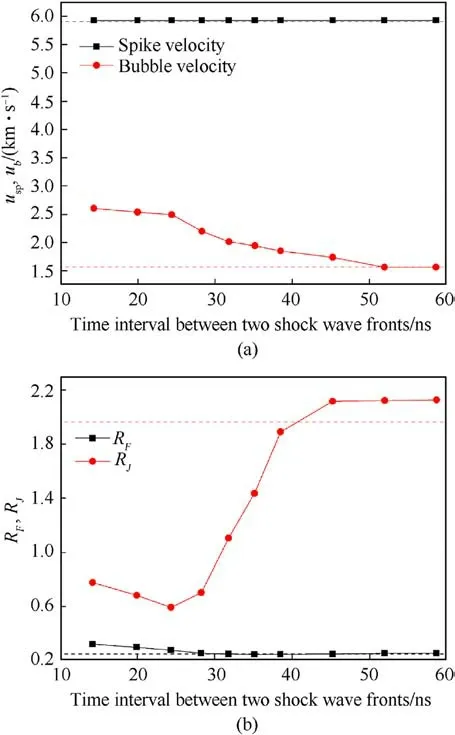
Fig.13.The values of (a) spike velocity usp, bubble velocity ub; (b) jetting factors RF and RJ of microjet corresponding to time interval between two shock wave fronts,and the horizontal dashed lines indicate the relevant parameter values of the microjet induced by the single shock.
In Table 2,the distance interval between two shock wave fronts corresponds to the time interval between two shock wave fronts.The time intervals are as follows:14.28 ns,19.95 ns,24.39 ns,28.28 ns, 31.79 ns, 35.14 ns, 38.52 ns, 45.23 ns, 51.95 ns and 58.64 ns.According to Table 2 and Fig.13, the spike velocity of the microjet remains constant at approximately 5.927 km/s when the time interval between two shock wave fronts increases from 14.28 ns to 58.64 ns, which corresponds to an increase in distance interval between the two shock wave fronts from 105.44 μm to 433.07 μm.This value is almost identical (5.903 km/s) to that of the microjet induced by the single shock.The spike velocity uspof the microjet remains constant regardless of the interval between the two shocks.The bubble velocity decreases gradually as the time interval between two shock wave fronts increases from 14.28 ns to 24.39 ns,and then decreases asymptotically to a constant value of 1.564 km/s when the time interval further increases to 58.64 ns.The micro jetting factor RJfrom spike to bubble decreases linearly from 0.7777 to 0.5946 as the time interval between two shock wave fronts increases from 14.28 ns to 24.39 ns.However,when the time interval is further increased to 58.64 ns, the micro jetting factor RJfirst increases rapidly and then asymptotically approaches a fixed value of 2.1277 for time interval greater than 45.23 ns.This means that,the mass of the microjet MJfrom spike to bubble decreases linearly when the time interval between two shock wave fronts increases from 14.28 ns to 24.39 ns.However, when the time interval increases from 24.39 ns to 58.64 ns, MJfirst rapidly increases and then stabilizes asymptotically for time interval greater than 45.23 ns.The micro jetting factor RFdecreases linearly from 0.3232 to 0.2542 as the time interval between two shock wave fronts increases from 14.28 ns to 28.28 ns, and remains stable and consistent with that of the single shock when the time interval is greater than 28.28 ns.This means that, as the time interval between two shock wave fronts increases from 14.28 ns to 28.28 ns, the spike mass MFfrom microjet head to free surface decreases linearly,and the spike part becomes thinner.Beyond a time interval of 28.28 ns,the spike mass MFremains constant and is equivalent to that of the single shock.

Table 2 The parameters of shock wave and microjet.
The bubble velocity uband the spike velocity uspof the microjet remain relatively stable when the time interval between two shock wave fronts increases from 14.28 ns to 24.39 ns, and the distance interval increases from 105.44 μm to 180.11 μm.As a result,there is only a slight change in||usp-ub|| and therefore little change in the length of microjet from spike to bubble when the time interval increases from 14.28 ns to 24.39 ns.As shown in Fig.12, the spike part of the microjet becomes thinner,and cavitation and many lowdensity fragments appear at the bottom of the microjet.Therefore,increasing the time interval between two shock wave fronts from 14.28 ns to 24.39 ns results in a decrease in both the microjet mass MJand the spike mass MF.As the time interval between two shock wave fronts increases from 28.28 ns to 58.64 ns,which corresponds to an increase in the distance interval from 208.84 μm to 433.07 μm,the microjet’s bubble velocity ubdecreases asymptotically to a fixed value of 1.564 km/s, while||usp-ub|| increases asymptotically to a fixed value of 4.363 km/s.Consequently,the length of microjet from spike to bubble increases.Also,as shown in Fig.12,the cavitation at the bottom of the microjet disappears.As a result, when the time interval increases from 28.28 ns to 58.64 ns,there is rapid increase in the microjet mass MJfrom spike to bubble which then stabilizes asymptotically for time interval greater than 45.23 ns.The spike mass MFfrom microjet head to free surface remains almost constant.
To quantitatively analyze the mass distribution characteristics of microjet,we compare the mass distribution of microjet induced by the single shock and the two shocks at different intervals.For clarity,Δt1,Δt2,Δt3,Δt4,Δt5,Δt6,Δt7,Δt8,Δt9and Δt10represent 14.28 ns,19.95 ns, 24.39 ns, 28.28 ns, 31.79 ns, 35.14 ns, 38.52 ns,45.23 ns,51.95 ns and 58.64 ns time intervals,respectively.The SPH simulations use a fixed mass mpof 1.69375 × 10⁻⁷g for each particle.We plot the ratios m/mp, which represent the mass of the microjet along the x-axis divided by the mass of each particle(at 0.2 μs).Additionally, we plot the ratios that show the accumulated mass from the microjet tip to its x-coordinate divided by the mass of each particle (at 0.2 μs).Fig.14 shows the (a) relative mass distribution and (b) accumulated mass distribution of microjets generated by the single shock and the two shocks at different intervals(14.28 ns,19.95 ns,24.39 ns,28.28 ns and 31.79 ns)along the x-axis at 0.2 μs.The actual position of the microjet bottom is indicated by arrows while the black dashed line represents the free surface.
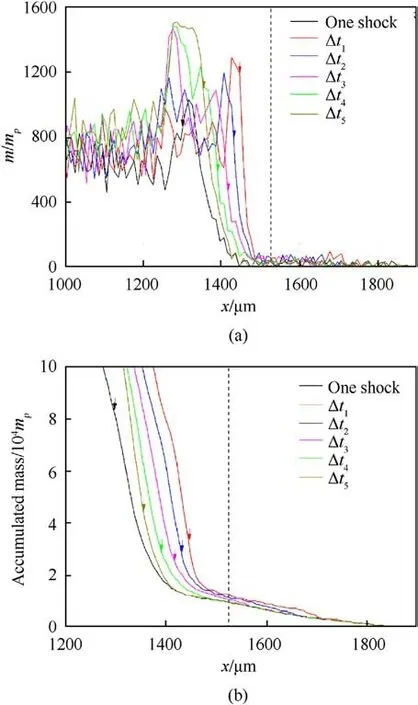
Fig.14.The (a) relative mass distribution and (b) accumulated mass distribution (at 0.2 μs)of microjets along the x-axis generated by the single shock and the two shocks at different time intervals(Δt1 =14.28 ns,Δt2 =19.95 ns,Δt3 =24.39 ns,Δt4 =28.28 ns,and Δt5 =31.79 ns).The black dashed line indicates the position of the free surface while arrows represent the actual position of the microjet bottom.
The spike part of the microjet extends from its head to the free surface, and experiences significant mass distribution fluctuation due to the fracture of the microjet.The relative mass distribution of the spike part generated by the two shocks at intervals of 14.28 ns and 19.95 ns is higher than that induced by the single shock or the two shocks at intervals of 28.28 ns and 31.79 ns on sample.In Fig.14(b), the accumulated mass distribution of the spike part shows minimal fluctuation, indicating that the mass distributions near the microjet head remain consistent for different impacts.The tip part of the microjet is already formed before the second shock wave reaches the groove (as shown in Figs.6-10), rendering little effect on the tip part of the microjet.In Fig.14(b),the accumulated mass distributions of the spike parts generated by the two shocks at time intervals of 14.28 ns,19.95 ns and 24.39 ns increase successively from the tip of the microjet to free surface along the negative x-axis.The increased mass distribution curves are greater than that generated by the single shock.This indicates that as the interval between two shocks increases from 14.28 ns to 28.28 ns,there is a gradual decrease in the micro jetting factor RFfrom the spike to the free surface in Fig.13(b).
In Figs.14(a) and (b), the mass distribution of the microjet increases abruptly in turn from the free surface to its actual bottom along the negative x-axis as the time interval between two shocks increases from 14.28 ns to 31.79 ns, and the accumulated mass distribution also increases rapidly in turn.This is due to the widening of the microjet with approaching its bottom in Fig.12.The actual bottom position of the microjet is different.The accumulated mass of the microjet from the tip to the bottom decreases initially as the time interval between two shocks increases from 14.28 ns to 24.39 ns, and then increases as the time interval increases from 24.39 ns to 31.79 ns in Fig.14(b).This variation is consistent with that of micro jetting factor RJfrom spike to bubble in Fig.13(b).
Fig.15 shows the (a) relative mass distribution and (b) accumulated mass distribution of microjets (at 0.2 μs) along the x-axis generated by the single shock and the two shocks at different intervals(35.14 ns, 38.52 ns, 45.23 ns, 51.95 ns and 58.64 ns).
Fig.12 shows a damage area at the bottom of the microjets induced by the two shocks at the intervals of 45.23 ns and 51.95 ns.As a result, the relative mass distribution near the bottom of the microjet decreases significantly with increasing the interval between two shocks from 38.52 ns to 51.95 ns in Fig.15(a).However,when the time interval between two shocks increases from 35.14 ns to 51.95 ns, the mass MJfrom the spike to the bottom of microjet still increases because the actual bottom of the microjet moves towards negative x-axis.When the interval between two shocks exceeds 51.95 ns, the relative mass distribution and accumulated mass distribution from the tip to bottom of the microjets become nearly identical, and the actual bottom position of the microjet remains constant.As a result,the mass MJfrom the spike to bottom of the microjet remains consistent and similar to that produced by the single impact (as shown in Fig.13(b)).
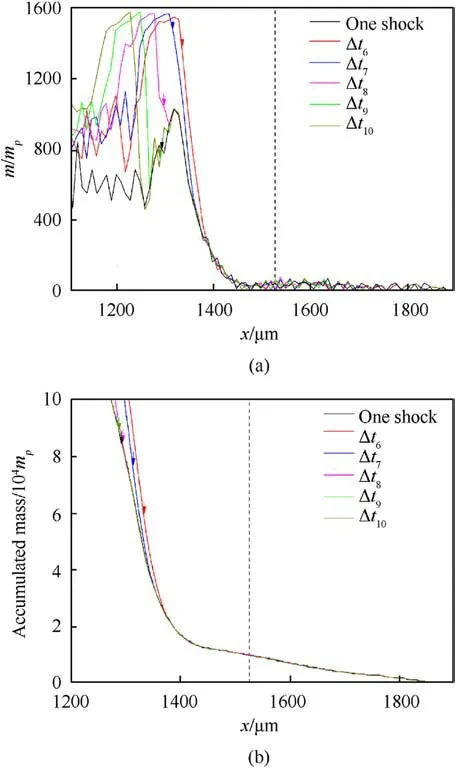
Fig.15.The (a) relative mass distribution and (b) accumulated mass distribution (at 0.2 μs)of microjets along the x-axis generated by the single shock and the two shocks at different time intervals(Δt6 =35.14 ns,Δt7 =38.52 ns,Δt8 =45.23 ns,Δt9 =51.95 ns, and Δt10 = 58.64 ns).The black dashed line indicates the free surface, while the arrows represent the actual position of the microjet bottom.
Fig.16 shows the velocity profile curves of the microjets(at 0.2 μs)along the x-axis induced by the single shock and the two shocks at different intervals(14.28 ns,19.95 ns,24.39 ns,28.28 ns,31.79 ns,35.14 ns,38.52 ns,45.23 ns,51.95 ns and 58.64 ns).The position of free surface is indicated by a black dashed line.The velocity profile curves of these microjets are similar from the head of microjet to the free surface, but they differ near the bottom of the microjets after the free surface.
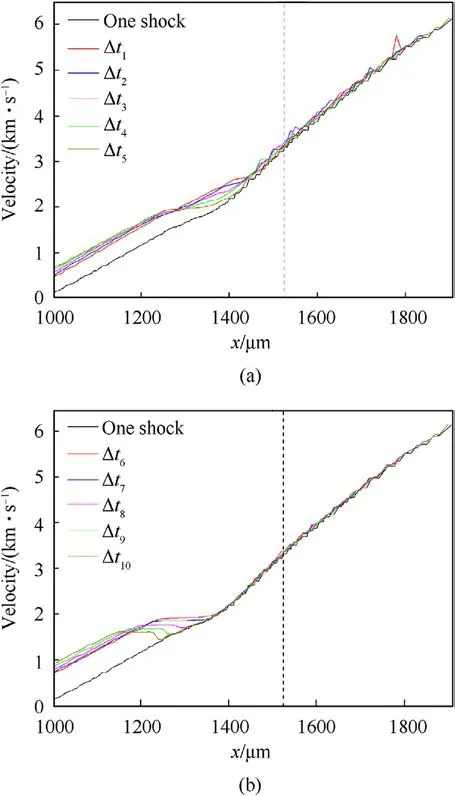
Fig.16.The velocity profile curves of the microjets (at 0.2 μs) along the x-axis generated by the single shock and the two shocks at different time intervals(Δt1 = 14.28 ns, Δt2 = 19.95 ns, Δt3 = 24.39 ns, Δt4 = 28.28 ns, Δt5 = 31.79 ns,Δt6 =35.14 ns,Δt7 =38.52 ns,Δt8 =45.23 ns,Δt9 =51.95 ns,and Δt10 =58.64 ns).The black dashed line indicates the free surface.
As the time interval between two shocks increases from 14.28 ns to 58.64 ns, the velocity profile curves of the microjets bend downward in turn along the negative x-axis direction, and then pass through a nearly horizontal segment and reach the same position as the curve under the two shocks at a 14.28 ns interval.The bending position of the velocity profile curves gradually moves towards the inside of sample.Also, as the time interval between two shocks increases from 14.28 ns to 58.64 ns,there is an increase in the overlapping section of the velocity profile curve of the microjet induced by the two shocks and that induced by the single shock.Due to differences in the velocity distributions and velocity gradients within the bubbles, there are variations in the actual bottom positions of the microjets.In Fig.15,When the time interval between the two shocks increases from 24.39 ns to 51.95 ns, the microjet length from spike to bubble increases, so the mass of the microjet MJincreases.Furthermore, subsurface damage (such as spallation,cracks and holes)affects the mass MJof microjet induced by two shocks.
4.Conclusions
We have conducted SPH numerical simulation to investigate how the interval between two shocks affects the ejecta formation from the grooved Al1100surface under two shocks releasing.The two shock waves are the unsupported shock waves when these waves reach the groove surface.In fact, due to changes in the interval between two shock pulse, microjetting can exhibit different modes,namely jet and near surface tensile failure.On the one hand,according to the loading waveform,the temperature of the material undergoing secondary loading and unloading should have a significant increase, which makes the material has stronger fluidity after the first shock under the second shock, which may increase the formation of ejecta.However,since the first shock changes the morphology of the free surface defect,this may not be beneficial for the energy-gathering effect of microjet under subsequent shock.The final jet shape is mainly determined by the material state and the surface perturbation state.On the other hand, during the unloading process of the first shock, some damages will be generated, which means that the damaged material needs to be compacted first in the second shock.This will obviously absorb shock energy.In the subsequent release, the evolution of damage determines the mass and distribution of the low-speed ejecta.In this work,the time interval between two shock wave fronts ranges from 14.28 ns to 58.64 ns, corresponding to the distance interval of 105.44 μm-433.07 μm.The peak pressures of the shock waves are constant at 30.02 GPa.Some basic understandings have been obtained, which have regular reference value.From this work, the following conclusions can be drawn.
(1) The spike amplitude of the microjet remains constant as the interval between two shocks increases.However,the bubble amplitude gradually increases with the significant change of the microjet morphology.When there is a small interval between shocks(the time interval from 14.28 ns to 28.28 ns),a large tensile area forms inside the sample due to superimposition of the unloading part of the second shock wave and the unloading wave produced by the reflection of the first shock wave at the groove interface.Conversely, when there is a large interval between the two shocks (the time interval more than 31.79 ns), the micro-cracks and micropores form in response to the release of the first shock wave at the groove interface, and then interact with the second shock wave leading to "dappled" stress concentrations and unloading in the second shock area.As a result,the intensity of the second shock wave rapidly decreases, having little effect on the microjet formation.Due to the influence of subsurface failure on the second shock wave, its release cannot cause the second inversion of surface perturbation.
(2) The spike velocity uspof the microjet is found to remain constant, independent on the interval between two shocks.The wedged groove has a depth of 50 μm.As the time interval between two shocks increases from 14.28 ns to 58.64 ns,the bubble velocity gradually decreases until it reaches a constant value.When the distance interval exceeds 383.66 μm(7.673 times the groove depth), the mass and space-time evolution of the microjet are nearly identical to that induced by the single shock release.
(3) The micro jetting factor RJfrom spike to bubble is found to decrease linearly and then increase to a fixed value of about 2.1 rapidly, with increase of the time interval between the two shocks.The micro jetting factor RFfrom spike to the free surface undergoes a similar decrease change; however, RFremains almost stable with the time interval with no more distinct increase as RJ.When the time interval between the two shocks increases from 14.28 ns to 24.39 ns,the spike part of the microjet tapers,and cavitation and many low-density fragments appear at the bottom of the microjet.As a result,both RJand RFappear to decrease.The actual bottom positions of the microjets differ under the two shocks at different intervals.With further increase of the time interval, the length of microjet from spike to bubble increases, which leads to an increase of RJ.
Declaration of competing interest
The authors declare that they have no known competing financial interests or personal relationships that could have appeared to influence the work reported in this paper.
Acknowledgements
This work was supported by the Doctoral Research Launch Foundation of Liaoning Province (Grant No.2022-BS-185), China;the Science Challenge Project (Grant No.TZ2016001), China; the National Natural Science Foundation of China(Grant Nos.11972092,12172056,12002049),China;the key Laboratory of Computational Physics (Gant No.HX02021-24)720-24); and Shenyang Ligong University Talent Introduction Support Fund, China.
- Defence Technology的其它文章
- Explosion resistance performance of reinforced concrete box girder coated with polyurea: Model test and numerical simulation
- An improved initial rotor position estimation method using highfrequency pulsating voltage injection for PMSM
- Target acquisition performance in the presence of JPEG image compression
- Study of relationship between motion of mechanisms in gas operated weapon and its shock absorber
- Data-driven modeling on anisotropic mechanical behavior of brain tissue with internal pressure
- The effect of reactive plasticizer on viscoelastic and mechanical properties of solid rocket propellants based on different types of HTPB resin

