
Nondestructive technique for identifying nuclides using neutron resonance transmission analysis at CSNS Back‑n
2024-03-09 08:49ShengDaTangYongHaoChenJingYuTangRuiRuiFanQiangLiGongLiDongLiuZhengYaoJinXingZhuCuiTianXiangChenYiWeiYangRongLiuHanYiYangLiZhenYangQiAnHaoFanBai0JiangBoBaiJieBaoPingCaoQiPingChenZhenChenZengQiCui0An
Nuclear Science and Techniques 2024年1期
Sheng‑Da Tang · Yong‑Hao Chen · Jing‑Yu Tang · Rui‑Rui Fan,6 · Qiang Li,6 · Gong Li · Dong Liu ·Zheng‑Yao Jin · Xing‑Zhu Cui · Tian‑Xiang Chen · Yi‑Wei Yang · Rong Liu · Han Yi · Yang Li · Zhen Yang ·Qi An · Hao‑Fan Bai0 · Jiang‑Bo Bai · Jie Bao · Ping Cao · Qi‑Ping Chen · Zhen Chen · Zeng‑Qi Cui0 ·An‑Chuan Fan · Chang‑Qing Feng · Fan‑Zhen Feng · Ke‑Qing Gao · Min‑Hao Gu,6 · Chang‑Cai Han ·Zi‑Jie Han · Guo‑Zhu He · Yong‑Cheng He · Yang Hong,3 · Yi‑Wei Hu0 · Han‑Xiong Huang ·Wei‑Hua Jia · Hao‑yu Jiang0 · Wei Jiang · Zhi‑jie Jiang · Ling Kang · Bo Li · Chao Li · Jia‑Wen Li ·Xiao Li · Jie Liu0 · Shu‑Bin Liu · Guang‑Yuan Luan · Chang‑Jun Ning · Bin‑Bin Qi · Jie Ren ·Zhi‑Zhou Ren · Xi‑Chao Ruan · Zhao‑Hui Song · Kang Sun,3 · Zhi‑Xin Tan · Li‑Jiao Wang,3 ·Peng‑Cheng Wang · Zhao‑Hui Wang · Zhong‑Wei Wen · Xiao‑Guang Wu · Xuan Wu · Li‑Kun Xie ·Yong‑Ji Yu · Guo‑Hui Zhang0 · Lin‑Hao Zhang,3 · Mo‑Han Zhang,6 · Qi‑Wei Zhang · Xian‑Peng Zhang ·Yu‑Liang Zhang · Yue Zhang · Zhi‑Yong Zhang · Mao‑Yuan Zhao · Lu‑Ping Zhou,3 · Zhi‑Hao Zhou,3 ·Ke‑Jun Zhu,6,3
Abstract Nondestructive and noninvasive neutron assays are essential applications of neutron techniques.Neutron resonance transmission analysis (NRTA) is a powerful nondestructive method for investigating the elemental composition of an object.The back-streaming neutron line (Back-n) is a newly built time-of-flight facility at the China Spallation Neutron Source(CSNS) that provides neutrons in the eV to 300 MeV range.A feasibility study of the NRTA method for nuclide identification was conducted at the CSNS Back-n via two test experiments.The results demonstrate that it is feasible to identify different elements and isotopes in samples using the NRTA method at Back-n.This study reveals its potential future applications.
Keywords CSNS · White neutron beam · NRTA · Nuclide identification · Nondestructive method
1 Introduction
Neutrons are unique probes for analyzing the interior properties of materials in a nondestructive manner owing to their strong penetration power.Various neutron techniques based on the interactions between neutrons and materials have been successfully developed and applied in different fields.Neutron resonance analysis (NRA) is a technique that uses neutron resonance absorption to identify and quantify elements and isotopes in a sample [1–3].Its basic principle is that the absorption of neutrons by nuclei as a function of neutron energy shows specific resonance peaks and dips based on which elemental composition of the material can be determined [4].Neutron resonance transmission analysis(NRTA) is an NRA method based on the transmission of a neutron beam through a sample, in which the resonances are observed as dips as a function of neutron energy.
The first demonstration of NRTA as a nondestructive method for determining the isotopic abundance of spent nuclear fuel pins was by Priesmeyer and Harz [3].235,238U and239Pu contents were obtained in their study.Subsequently, NRTA for isotopic assay was used as a nondestructive technique to characterize special nuclear materials[5–7].The results obtained using NRTA were consistent with those obtained using mass spectrometry and neutron activation methods [8].NRTA has also been applied in other fields, such as the characterization of reference materials for nuclear data measurement [9] and cultural heritage objects and artifacts [10].Moreover, NRTA has also been used with neutron imaging, known as neutron resonance transmission imaging, at the J-PARC facility [11], ISIS spallation neutron source [12], and KURRI-LINAC [13].The NRTA method was investigated extensively by a group from EC-JRC Geel at the GELINA facility [14–16], which is a white neutron source that provides neutrons from 10 meV to 20 MeV [17].A white neutron beam covering the energy range from eV to MeV has significant advantages over thermal neutron beams because a broad energy range covers almost all the resonance regions of the elements, whereas the thermal beam is mainly used for heavy elements.The back-streaming neutron line (Back-n) at China Spallation Neutron Source (CSNS)is a newly built white neutron beam covering the range from 0.5 eV to 300 MeV [18, 19].The time-of-flight (TOF)technique was used at Back-n to accurately determine the neutron energy.The energy resolution at Back-n end station 2 (ES#2) was lower than ~ 2% for neutrons below 1 MeV.Because of these favorable beam properties, Back-n is suitable for the study and application of the NRTA technique.
This paper describes the first test experiments using the NRTA method at the CSNS Back-n facility.The experimental results for two samples containing light or medium elements are presented.Data analysis shows that element/isotope identification using the NRTA method is feasible at Back-n.
2 Experimental setup of NRTA at CSNS Back‑n
Located in Dongguan, Guangdong, the multi-disciplinary CSNS facility has been operational since 2018.It generates neutrons via a spallation reaction by impinging 1.6 GeV protons onto a massive tungsten target.The nominal proton beam power of CSNS Phase I is 100 kW.In the forthcoming CSNS Phase II upgrading project, the beam power will be increased to 500 kW, and several more spectrometers [20,21] and experimental stations [22] will be built.Although most neutron beamlines at CSNS deliver thermal neutrons for neutron scattering applications, Back-n beamline delivers neutrons within a very broad energy range (from 0.5 eV to 300 MeV) mainly for nuclear data measurements [19, 23,24] and nuclear technology applications [25, 26].
Since its inception, the Back-n beam’s time characteristics have been a focal point of investigation [27] due to their crucial role in determining neutron energy and influencing energy resolution.The energy resolution of a TOF facility,considering the relativistic effect, is calculated as
whereγis the Lorentz factor,vis the neutron velocity, andcis the speed of light.TandLare the neutron flight time and flight path length, respectively, and ΔTand ΔLare their respective uncertainties.ΔTis mostly from the incident proton pulse width, whose full-width at half-maximum was 60 ns during the measurements in this study.ΔLis caused by the neutron moderation and scattering in the spallation target before they enter the neutron tube.The moderation process has been investigated via Monte Carlos simulations[28, 29], and the uncertainties of the moderation distance(ΔL) at different energies were obtained.Table 1 lists the ΔLvalues at different energies and the energy resolutions calculated using Eq.(1), which indicates that the energy resolution is a function of the neutron energy.
In this study, we implemented NRTA measurements using a neutron total cross-section spectrometer.This spectrometer comprised a multilayer fast fission chamber(FIXM) and a sample changer [30].The FIXM is a neutron detector that uses235U and238U samples as neutron converters.Figure 1 shows the typical setup for the neutron total cross-section measurements.The samples to be measured were placed on a sample changer at end station 1 (ES#1), and the detector was set up at ES#2.The beam spot at the sample position is typically turned to be Φ60 mm, whereas that at the detector position is typically configured to be approximately Φ40 mm.This configuration ensures that the neutron beam at ES#2 is entirely covered by a neutron converter with a diameter of Φ50 mm.Total cross-section measurements typically include sample-out and sample-in measurements.Sample-out measurements involve characterizing a neutron beam without any sample in the beam, whereas sample-in measurementsinvolve placing the sample in the beam at ES#1.The long distance (approximately 20 m) and the collimator between the sample and detector minimally suppress the multiscattering neutron background.The transmission spectrum is the ratio of the normalized neutron counts of the sample-in to the sample-out, from which the total cross section can be determined.The neutron total cross sections ofnatC[30],natLi [31],9Be,27Al [32],natFe,natPb,natCr, and209Bi[33] have been measured using this setup at Back-n.

Table 1 Energy resolutions of CSNS Back-n at ES#2

Fig.1 Layout for neutron total cross-section measurements
The NRTA experiment at Back-n utilized the same setup as that used for the total cross-section measurements.Photographs of the sample changer and neutron detector are shown in Fig.2.The resonances were observed as absorption dips in the transmission spectrum as a function of the neutron energy, from which the nuclides in the sample could be identified because the resonances of each nuclide are as unique as fingerprints.The energy positions of the resonance dips in the transmission spectrum provide qualitative information about the composition, whereas the profiles of the resonance dips present quantitative details about the composition.In our first NRTA experiments, we resolved the qualitative information about the samples.Quantification of the elemental composition is more complicated and will be our subsequent task.
3 Results and discussion
The NRTA method is centered on measuring and analyzing neutron transmission spectra.The TOF technique was used to determine the neutron energy.Further details of the TOF method at Back-n can be found in our previous publications [18, 34].Another crucial aspect of neutron energy determination is the double-bunch effect, in which two identical proton bunches have well-defined intervals(410 ns) in an incident pulse.Double-bunch unfolding is necessary for energy regions higher than 10 keV, as the 410 ns uncertainty is no longer negligible.An unfolding code based on Bayes’ theorem was developed to unfold the TOF spectrum [35, 36].The systematic uncertainty introduced by the unfolding process can be estimated using the unfolding code, which is highly dependent on statistical uncertainties.The uncertainty of the unfolding is typically 1.5–2.5 times that of the statistical uncertainty.
3.1 Experiment using imitated lunar soil
As shown in Fig.3, an artificially simulated lunar soil sample was measured to verify the feasibility of the NRTA at Back-n.The sample was a cylinder with a diameter of 27 mmand a height of 21 mm, and comprised uniformly distributed elements.The details of its composition are listed in Table 2.

Fig.2 Sample changer at Backn ES#1 (left) and detector at ES#2 (right)

Fig.3 Photograph of imitated lunar soil sample.(Color figure online)
Figure 4 compares the measured fission rate spectra of the sample-in and the sample-out.The sample-in spectrum(the red curve in Fig.4) was attenuated by the scattering and absorption by the sample.Figure 5 shows the transmission of the neutron beam through the sample, which is the ratio of sample-in to sample-out measurements.Resonance absorption dips were observed in the transmission spectrum and could be used to determine the existing isotopes in the sample.
Figure 6 shows the transmission spectra in different energy regions to provide clear profiles of the absorption dips.All results are presented in 100 bins/decade (bpd), and the bin center is adopted as the energy of each bin.The resonances of sodium, aluminum, magnesium, iron, silicon, and oxygen were recognized.Table 3 presents a comparison of the measured resonance energy values and the corresponding resonance energy values in the ENDF/B-VIII.0 library[37].The differences between the values of the measurements and library, and the energy resolution at each energy level are also presented.The differences at most points are comparable to the energy resolution, except at 88.11 keV,which is assumed to be the overlap of the resonances of24Mg and56Fe at 83.45 and 84.84 keV, respectively.The overlap of the two resonances may increase the deviation between the measured and evaluated data.The differences vary with energy because, as discussed in Sect.2, the energy resolution is a function of the neutron energy.Binning is another reason for the differences in the resonance energy positions between the measurement and library.The energy bin center depends on the bin width, and smaller energy binning should provide a more accurate resonance energy;however, it increases the statistical uncertainties.This issue can be addressed using long beam-time measurements in the future.In this study, a 100 bpd was used as the final option.In addition, although the unfolding method was used in a good order for the region higher than 10 keV, the double-bunch commission inevitably introduced systematic uncertainties.

Fig.4 Comparison of sample-out and sample-in measurements of imitated lunar soil

Fig.5 Transmission spectrum of imitated lunar soil
Through qualitative analysis, most elements listed in Table 2 were identified, except for calcium, potassium,and titanium.Their absorption was not evident, probablybecause of the significant statistical fluctuations and their low abundance.In the above analysis, we only selected apparent dips and did not attempt to determine all the resonances of each nuclide.This is feasible for a qualitative study of the sample.
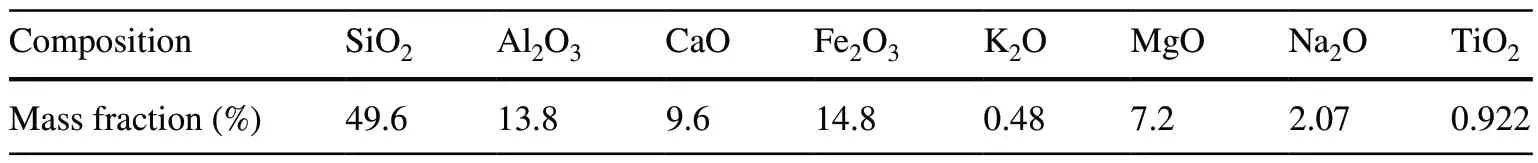
Table 2 Composition of imitated lunar soil sample

Fig.6 Expanded transmission spectra of imitated lunar soil in different energy regions

Table 3 Resonance energy of imitated soil sample
3.2 Experiment using relic obtained from South China Sea
The NRTA at Back-n also investigated an underwater relic found in the South China Sea.Figure 7 shows a block of silicate and calcium carbonate embedded in many copper coins.It had an irregular shape, with an approximate size of 25 cm × 10 cm × 10 cm.The experimental setup was the same as that used to measure the imitated lunar soil.However, this object contained nonuniformly distributed elements and had an irregular shape.An associated experiment using a CMOS camera was also conducted to capture transmission images of the sample using the total transmission and resonance-selected methods [38].
Figure 8 displays the spectra for both sample-in and sample-out measurements.The sample-in measurements significantly attenuated because of the large sample size.Figure 9 shows the transmission of the neutron beam through the sample, from which the isotopes in the sample is examined.Figure 10 shows zoomed-in graphs of the transmission spectra in different energy regions.The resonances of copper,calcium, sodium, silicon, and iron were observed.These recognized isotopes were consistent with our expectations.63Cu and65Cu originated from the coins in the object.28Si,40Ca,56Fe, and16O originated from silicate and calcium carbonate,which are the main components of the object.The presence of23Na is normal because sodium is abundant in the sea.
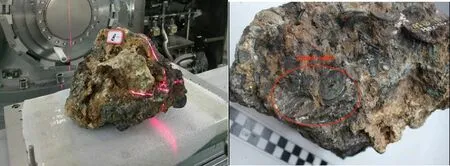
Fig.7 Photographs of underwater relic found in South China Sea.(Color figure online)
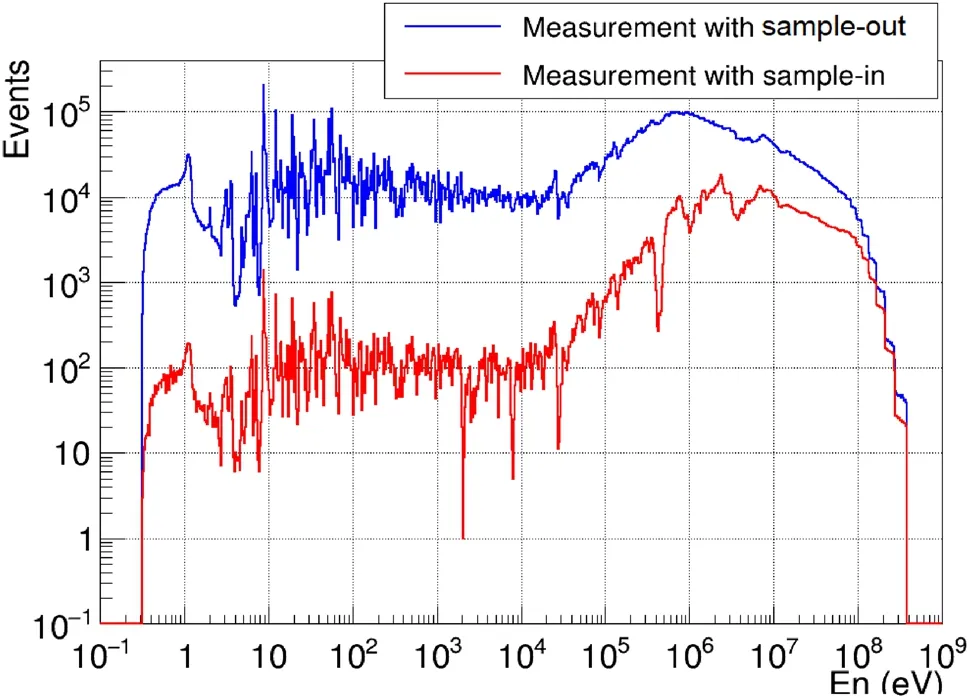
Fig.8 Comparison of sample-out and sample-in measurement results of underwater relic

Fig.9 Transmission spectrum of underwater relic
We compared the measured resonance energy positions with corresponding values in the ENDF/B-VIII.0 library (Table 4).The energy binning was 100 bpd.The differences in the resonance energy positions between the measurement and the library were comparable to the energy resolution.In addition to the reasons mentioned in Sect.3.1 for such differences, the irregular shape and massive volume of the sample could also increase the deviation between the measured and library values.
4 Conclusions and prospect
In 2018, CSNS introduced a new white neutron beamline,Back-n.Its beam characteristics (high neutron flux, broad energy range, and good energy resolution) motivated us to launch a feasibility study of NRTA for nuclide identification.Experiments on two different samples, an imitated lunar soil sample and an underwater relic, were performed for the first time at Back-n.The existence of16O,28Si,27Al,54,56Fe,24Mg, and23Na in the simulated lunar soil sample and63,65Cu,16O,28Si,56Fe,40Ca, and23Na in the underwater relic were confirmed using the NRTA method.A simple qualitative analysis demonstrated that CSNS Back-n could identify nuclides using the NRTA method.The beam characterization and results of this study demonstrate that the CSNS Back-n is a promising platform for nuclide identification.

Fig.10 Expanded transmission spectra of underwater relic in different energy regions
FIXM serves as the primary neutron detector for transmission measurements at Back-n.It helps in monitoring the flux based on235U(n, f) and238U(n, f) reactions.However, the resonances of235U(n, f) cross section below the ~ keV region are somewhat intense, which might induce fluctuations in the transmission spectrum.Lithium glass can be a valuable compensation for the fission chamber in the low-energy region because of the large and smooth cross section of the6Li(n, t) reaction [39].A lithium glass monitor is planned for future transmission measurements at Back-n, which is characterized by its quick response, high efficiency, and smooth transmission spectrum.However,because the lithium glass scintillator is sensitive toγ-rays,n/γdiscrimination [40] andγ-rays background must be investigated thoroughly.
In this paper, we present a simple qualitative analysis focused on confirming the presence of specific isotopes.Accurate quantification analysis for resolving the elemental abundance in a sample is significantly more complicated.Quantification analysis is feasible by performing sophisticated resonance analysis, which must include theexperimental effects, resolution function, sample properties, and detector characteristics.This is the subject of our subsequent study.

Table 4 Resonance energy of imitated soil sample
Author contributionAll authors contributed to the study conception and design.Material preparation, data collection and analysis were performed by Sheng-Da Tang, Yong-Hao Chen, Jing-Yu Tang, Rui-Rui Fan, Qiang Li, Gong Li, Dong Liu, Zheng-Yao Jin, Xing-Zhu Cui,Tian-Xiang Chen, Yi-Wei Yang, Rong Liu, Han Yi, Yang Li and Zhen Yang.The first draft of the manuscript was written by YHC and all authors commented on previous versions of the manuscript.All authors read and approved the final manuscript.
Data availabilityThe data that support the findings of this study are openly available in Science Data Bank at https:// cstr.cn/ 31253.11.scien cedb.j00186.00352 and https:// www.doi.org/https:// doi.org/ 10.57760/scien cedb.j00186.00352.
Declarations
Conflict of interestJing-Yu Tang is an editorial board member for Nuclear Science and Techniques and was not involved in the editorial review, or the decision to publish this article.All authors declare that there are no competing interests.
Authors and Affiliations
Sheng‑Da Tang1,2,3· Yong‑Hao Chen2,3· Jing‑Yu Tang4,5· Rui‑Rui Fan2,3,6· Qiang Li2,3,6· Gong Li7· Dong Liu7·Zheng‑Yao Jin7· Xing‑Zhu Cui2· Tian‑Xiang Chen2· Yi‑Wei Yang8· Rong Liu8· Han Yi2,3· Yang Li2,3· Zhen Yang1·Qi An5,9· Hao‑Fan Bai10· Jiang‑Bo Bai8· Jie Bao11· Ping Cao4,5· Qi‑Ping Chen8· Zhen Chen5,9· Zeng‑Qi Cui10·An‑Chuan Fan7· Chang‑Qing Feng5,9· Fan‑Zhen Feng7· Ke‑Qing Gao2,3· Min‑Hao Gu2,6· Chang‑Cai Han12·Zi‑Jie Han8· Guo‑Zhu He11· Yong‑Cheng He2,3· Yang Hong2,3,13· Yi‑Wei Hu10· Han‑Xiong Huang11·Wei‑Hua Jia2,3· Hao‑yu Jiang10· Wei Jiang2,3· Zhi‑jie Jiang5,9· Ling Kang2,3· Bo Li2,3· Chao Li5,9· Jia‑Wen Li5,9·Xiao Li2,3· Jie Liu10· Shu‑Bin Liu5,9· Guang‑Yuan Luan11· Chang‑Jun Ning2,3· Bin‑Bin Qi5,9· Jie Ren11·Zhi‑Zhou Ren8· Xi‑Chao Ruan11· Zhao‑Hui Song12· Kang Sun2,3,13· Zhi‑Xin Tan2,3· Li‑Jiao Wang2,3,13·Peng‑Cheng Wang2,3· Zhao‑Hui Wang11· Zhong‑Wei Wen8· Xiao‑Guang Wu11· Xuan Wu2,3· Li‑Kun Xie5,9·Yong‑Ji Yu2,3· Guo‑Hui Zhang10· Lin‑Hao Zhang2,3,13· Mo‑Han Zhang2,6· Qi‑Wei Zhang11· Xian‑Peng Zhang12·Yu‑Liang Zhang2,3· Yue Zhang2,3· Zhi‑Yong Zhang5,9· Mao‑Yuan Zhao5,9· Lu‑Ping Zhou2,3,13· Zhi‑Hao Zhou2,3,13·Ke‑Jun Zhu2,6,13
✉ Yong-Hao Chen chenyonghao@ihep.ac.cn
✉ Zhen Yang yangzh97@mail.sysu.edu.cn
1Sino-French Institute of Nuclear Engineering and Technology, Sun Yat-sen University, Zhuhai 519082,China
2Institute of High-Energy Physics, Chinese Academy of Sciences (CAS), Beijing 100049, China
3Spallation Neutron Source Science Center,Dongguan 523803, China
4School of Nuclear Science and Technology, University of Science and Technology of China, Hefei 230026, China
5State Key Laboratory of Particle Detection and Electronics,University of Science and Technology of China,Hefei 230026, China6State Key Laboratory of Particle Detection and Electronics,Institute of High Energy Physics, Chinese Academy of Sciences, Beijing 100049, China
7USTC Archaeometry Laboratory, University of Science and Technology of China, Hefei 230026, China
8Institute of Nuclear Physics and Chemistry, China Academy of Engineering Physics, Mianyang 621900, China
9Department of Modern Physics, University of Science and Technology of China, Hefei 230026, China
10State Key Laboratory of Nuclear Physics and Technology,School of Physics, Peking University, Beijing 100871, China
11Key Laboratory of Nuclear Data, China Institute of Atomic Energy, Beijing 102413, China
12Northwest Institute of Nuclear Technology, Xi’an 710024,China
13University of Chinese Academy of Sciences, Beijing 100049,China
 Nuclear Science and Techniques2024年1期
- Nuclear Science and Techniques的其它文章
- Digital signal acquisition system for complex nuclear reaction experiments
- Uncertainty and sensitivity analysis of in‑vessel phenomena under severe accident mitigation strategy based on ISAA‑SAUP program
- Generation and regulation of electromagnetic pulses generated by femtosecond lasers interacting with multitargets
- Infrared microspectroscopy beamline BL06B at SSRF
- A new liquid membrane diffusion model for characterizing the adsorption kinetics of europium by using a continuous measurement of adsorption platform
- Conceptual design of a 714‑MHz RFQ for compact proton injectors and development of a new tuning algorithm on its aluminium prototype